| Param | Original file | Final file |
|---|---|---|
| Filename | modeM0/AS1A06_006T01_9000002724_18376cztM0_level2.evt | modeM0/AS1A06_006T01_9000002724_18376cztM0_level2_quad_clean.evt |
| Size (bytes) | 1,305,728,640 | 227,949,120 |
| Size | 1.2 GB | 217.4 MB |
| Events in quadrant A | 8,895,738 | 1,436,264 |
| Events in quadrant B | 9,153,562 | 1,445,057 |
| Events in quadrant C | 9,199,606 | 1,408,135 |
| Events in quadrant D | 11,055,993 | 1,351,032 |
| Mode M0 | |||
|---|---|---|---|
| Quadrant | BADHDUFLAG | Total packets | Discarded packets |
| A | 0 | 38632 | 3 |
| B | 0 | 38910 | 3 |
| C | 0 | 39426 | 3 |
| D | 0 | 44955 | 3 |
| Mode SS | |||
|---|---|---|---|
| Quadrant | BADHDUFLAG | Total packets | Discarded packets |
| A | 0 | 372 | 0 |
| B | 0 | 372 | 0 |
| C | 0 | 372 | 0 |
| D | 0 | 372 | 0 |
| Mode M9 | |||
|---|---|---|---|
| Quadrant | BADHDUFLAG | Total packets | Discarded packets |
| A | 0 | 18 | 0 |
| B | 0 | 18 | 0 |
| C | 0 | 18 | 0 |
| D | 0 | 18 | 0 |
| Quadrant | Total seconds | Saturated seconds | Saturation percentage |
|---|---|---|---|
| A | 18333 | 179 | 0.976381% |
| B | 18333 | 184 | 1.003655% |
| C | 18333 | 303 | 1.652757% |
| D | 18334 | 788 | 4.298026% |
Noise dominated data is calculated using 1-second bins in cleaned event files. If a bin has >2000 counts, and if more than 50% of those come from <1% of pixels, then it is considered to be noise-dominated and hence unusable.
| Quadrant | # 1 sec bins | Bins with >0 counts | Bins with >2000 counts | High rate bins dominated by noise | Noise dominated (total time) | Noise dominated (detector-on time) | Marked lightcurve |
|---|---|---|---|---|---|---|---|
| A | 20138 | 18335 | 52 | 52 | 0.26% | 0.28% | 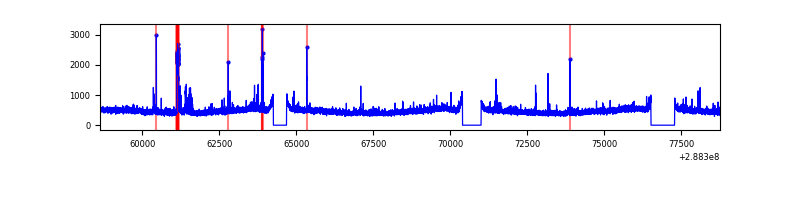 |
| B | 20138 | 18335 | 14 | 14 | 0.07% | 0.08% | 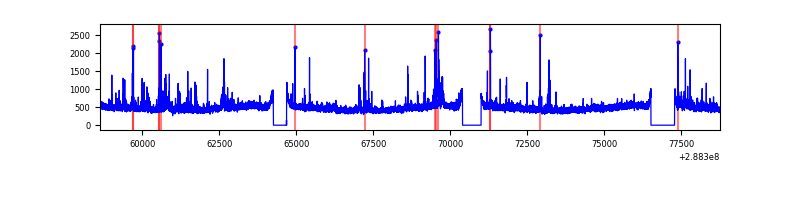 |
| C | 20138 | 18335 | 65 | 65 | 0.32% | 0.35% | 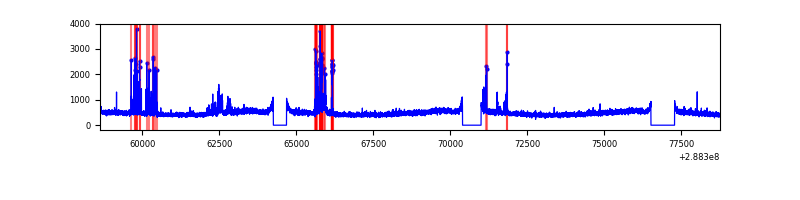 |
| D | 20139 | 18336 | 702 | 702 | 3.49% | 3.83% | 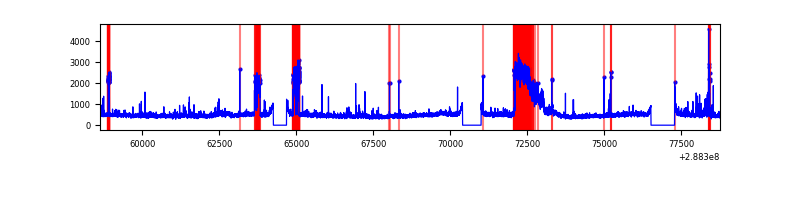 |
Top three noisy pixels from each quadrant. If the there are fewer than three noisy pixels in the level2.evt file, extra rows are filled as -1
| Pixel properties | Quadrant properties | ||||||
|---|---|---|---|---|---|---|---|
| Quadrant | DetID | PixID | Counts | Sigma | Mean | Median | Sigma |
| A | 15 | 174 | 343608 | 770.26 | 2200 | 2149 | 443.3 |
| A | 4 | 2 | 84788 | 186.42 | 2200 | 2149 | 443.3 |
| A | 0 | 226 | 19535 | 39.22 | 2200 | 2149 | 443.3 |
| B | 3 | 64 | 267095 | 627.68 | 2201 | 2149 | 422.1 |
| B | 0 | 189 | 93449 | 216.3 | 2201 | 2149 | 422.1 |
| B | 0 | 197 | 65207 | 149.39 | 2201 | 2149 | 422.1 |
| C | 0 | 207 | 498300 | 1001.07 | 2106 | 2117 | 495.7 |
| C | 14 | 238 | 320443 | 642.23 | 2106 | 2117 | 495.7 |
| C | 3 | 233 | 165226 | 329.08 | 2106 | 2117 | 495.7 |
| D | 7 | 238 | 2368202 | 4564.5 | 2117 | 2050 | 518.4 |
| D | 12 | 110 | 242764 | 464.36 | 2117 | 2050 | 518.4 |
| D | 1 | 52 | 172168 | 328.17 | 2117 | 2050 | 518.4 |
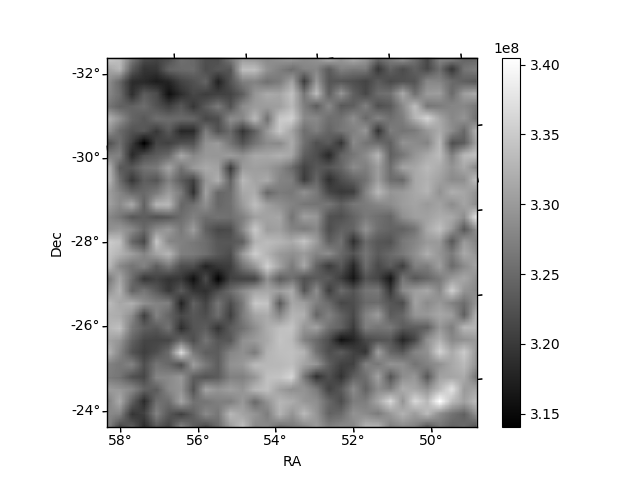
Histogram calculated using DETX and DETY for each event in the final _common_clean file
| Quadrant A | 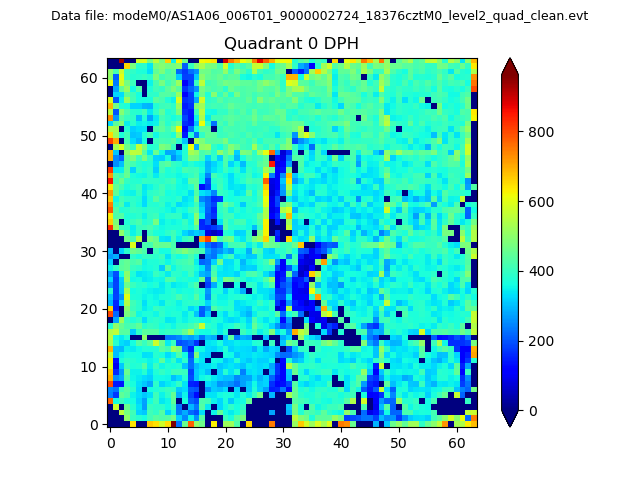 |
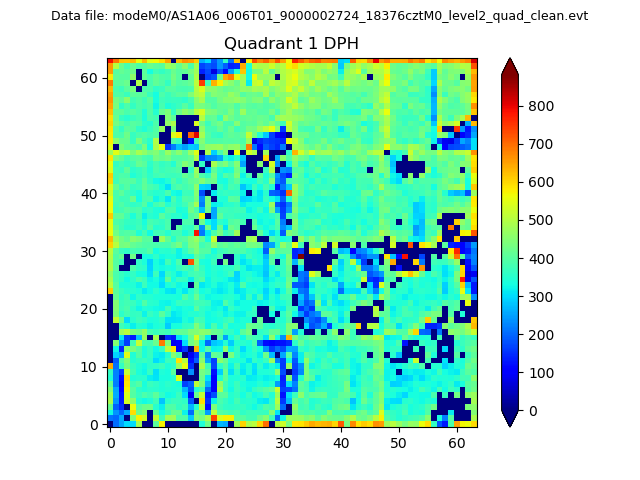 |
Quadrant B |
|---|---|---|---|
| Quadrant D | 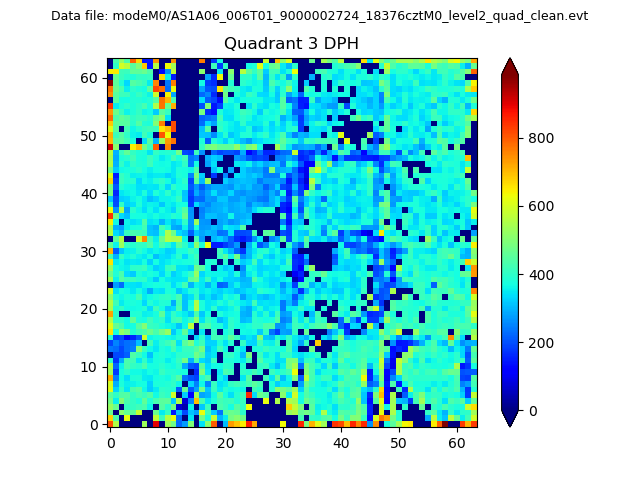 |
 |
Quadrant C |
| Plot type | Count rate plots | Images |
|---|---|---|
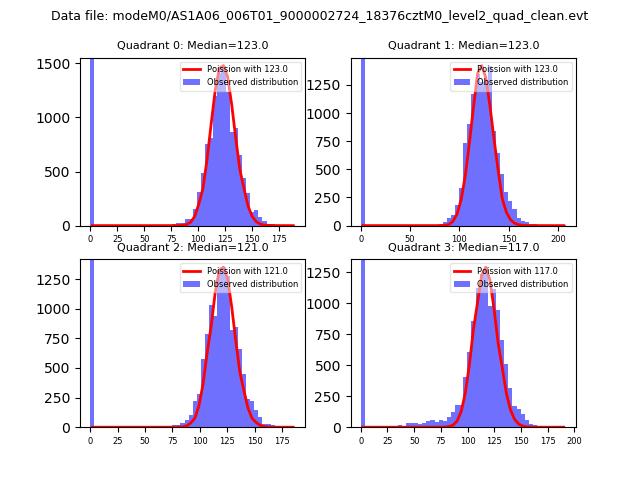
| Comparison with Poisson distribution Blue bars denote a histogram of data divided into 1 sec bins. Red curve is a Poisson curve with rate = median count rate of data. |
 |
 |
| Quadrant-wise count rates Data is divided into 100 sec bins |
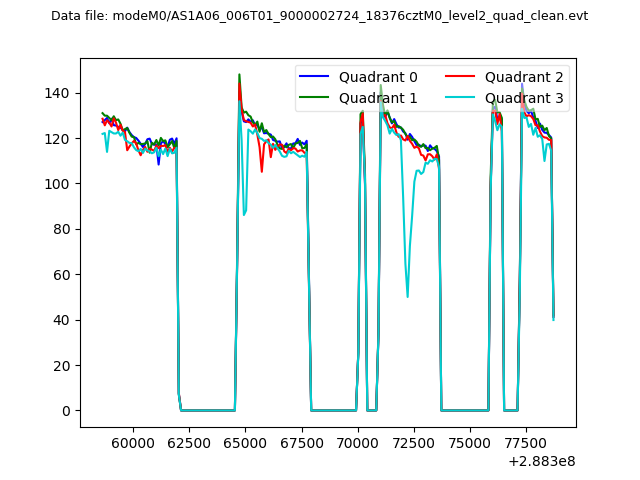 |
|
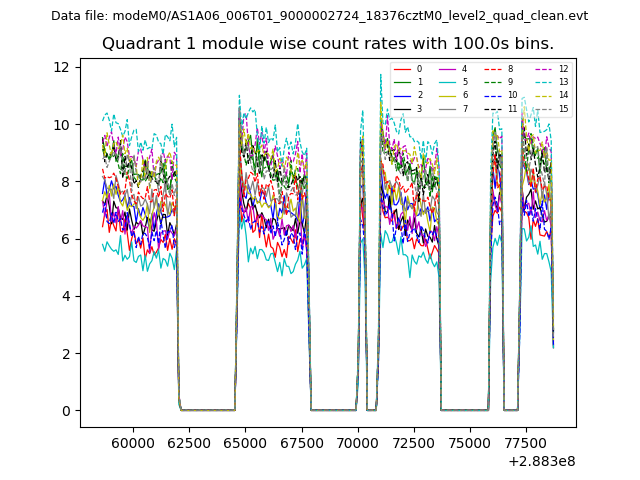
| Module-wise count rates for Quadrant A Data is divided into 100 sec bins |
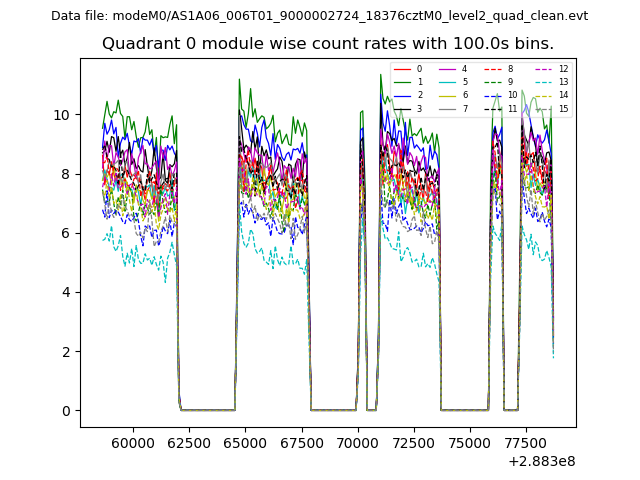 |
 |
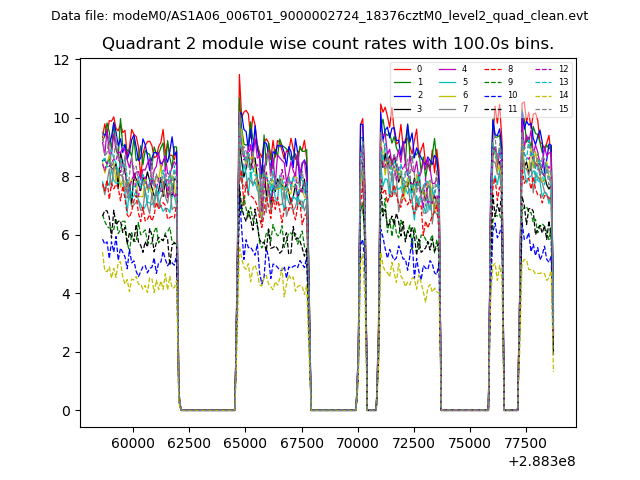
| Module-wise count rates for Quadrant B Data is divided into 100 sec bins |
 |
 |
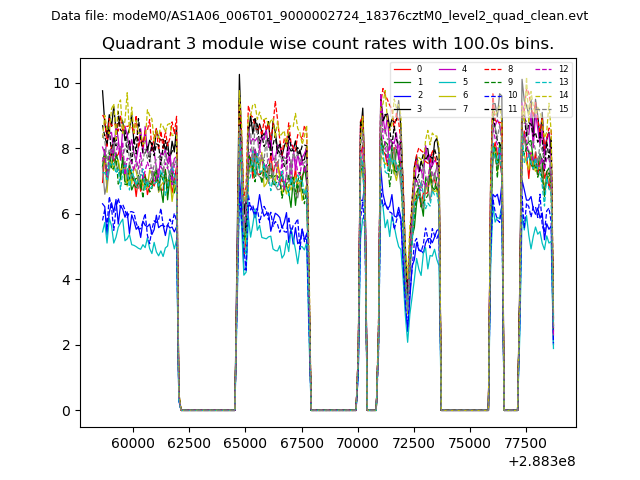
| Module-wise count rates for Quadrant C Data is divided into 100 sec bins |
 |
 |
| Module-wise count rates for Quadrant D Data is divided into 100 sec bins |
 |
 |
| Parameter | Plot |
|---|---|
| CZT HV Monitor | 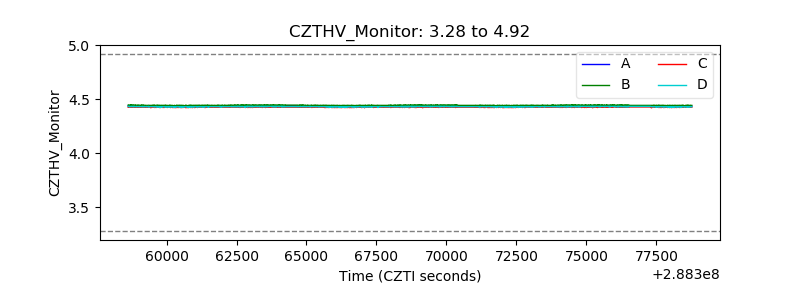 |
| D_VDD | 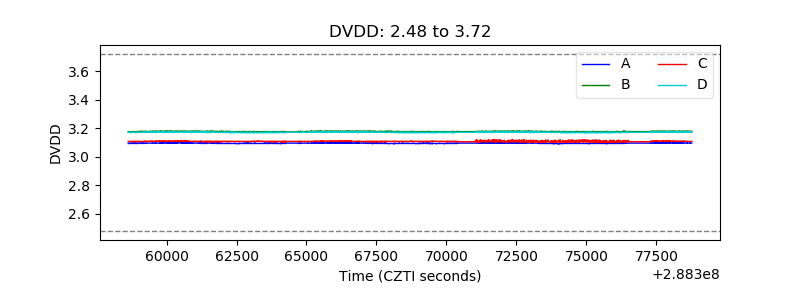 |
| Temperature 1 | 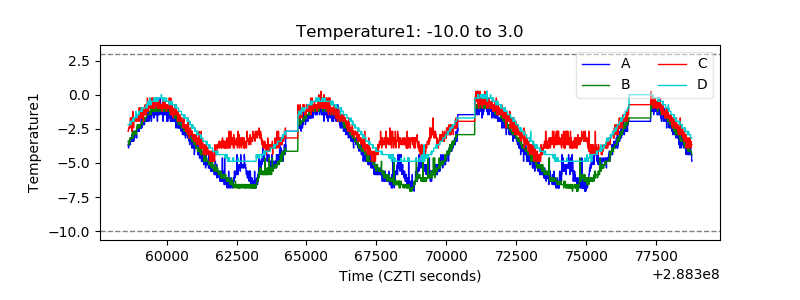 |
| Veto HV Monitor |  |
| Veto LLD | 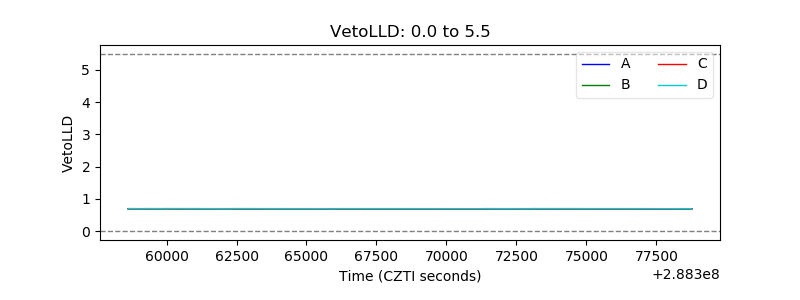 |
| Alpha Counter | 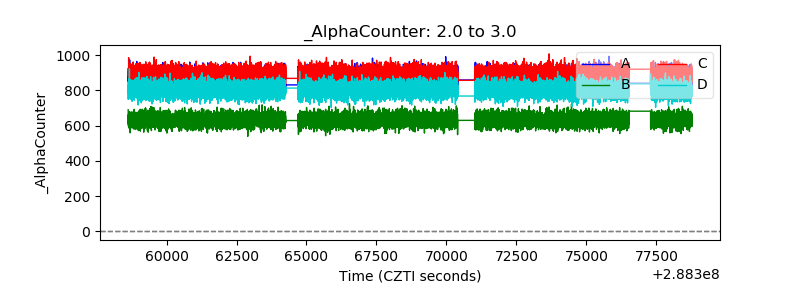 |
| _CPM_Rate |  |
| CZT Counter | 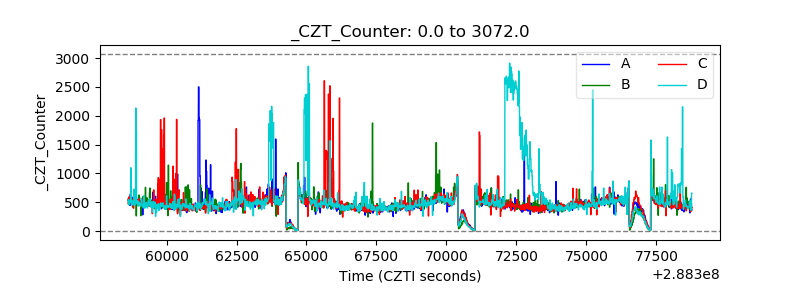 |
| +2.5 Volts monitor | 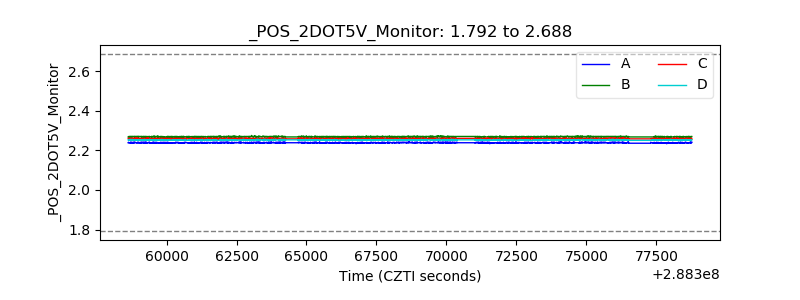 |
| +5 Volts monitor |  |
| _ROLL_ROT | 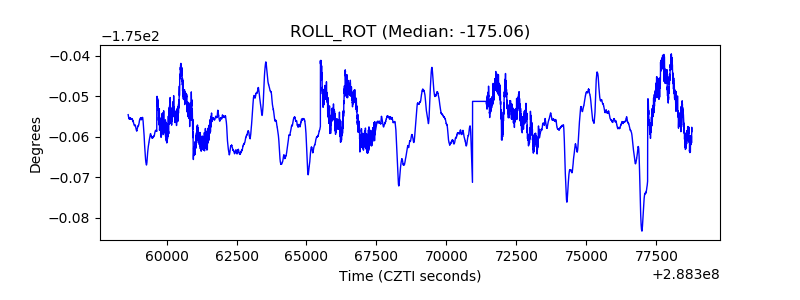 |
| _Roll_DEC | 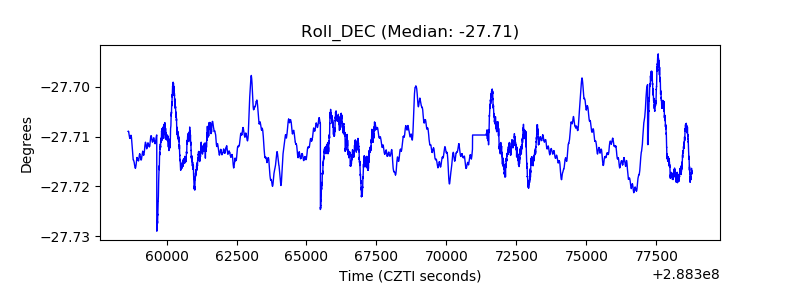 |
| _Roll_RA | 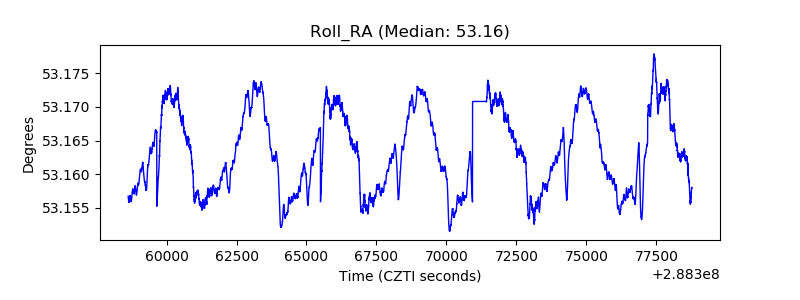 |
| Veto Counter | 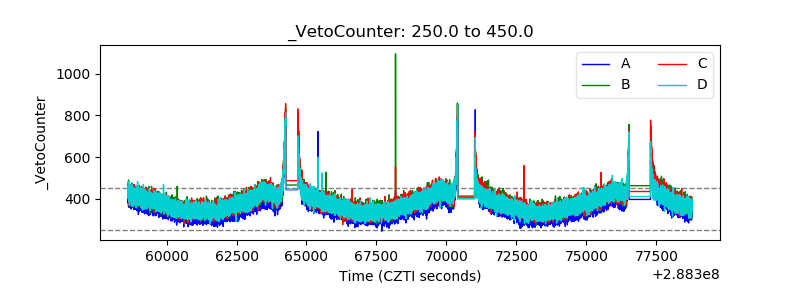 |