| Param | Original file | Final file |
|---|---|---|
| Filename | modeM0/AS1A06_006T01_9000002724_18377cztM0_level2.evt | modeM0/AS1A06_006T01_9000002724_18377cztM0_level2_quad_clean.evt |
| Size (bytes) | 488,574,720 | 87,079,680 |
| Size | 465.9 MB | 83.0 MB |
| Events in quadrant A | 3,232,201 | 554,342 |
| Events in quadrant B | 3,345,623 | 559,624 |
| Events in quadrant C | 3,122,110 | 545,774 |
| Events in quadrant D | 4,651,261 | 519,863 |
| Mode M0 | |||
|---|---|---|---|
| Quadrant | BADHDUFLAG | Total packets | Discarded packets |
| A | 0 | 13955 | 1 |
| B | 0 | 14142 | 1 |
| C | 0 | 13595 | 1 |
| D | 0 | 18229 | 1 |
| Mode SS | |||
|---|---|---|---|
| Quadrant | BADHDUFLAG | Total packets | Discarded packets |
| A | 0 | 132 | 0 |
| B | 0 | 132 | 0 |
| C | 0 | 132 | 0 |
| D | 0 | 132 | 0 |
| Mode M9 | |||
|---|---|---|---|
| Quadrant | BADHDUFLAG | Total packets | Discarded packets |
| A | 0 | 10 | 0 |
| B | 0 | 10 | 0 |
| C | 0 | 10 | 0 |
| D | 0 | 10 | 0 |
| Quadrant | Total seconds | Saturated seconds | Saturation percentage |
|---|---|---|---|
| A | 6562 | 28 | 0.426699% |
| B | 6563 | 56 | 0.853268% |
| C | 6563 | 59 | 0.898979% |
| D | 6562 | 305 | 4.647973% |
Noise dominated data is calculated using 1-second bins in cleaned event files. If a bin has >2000 counts, and if more than 50% of those come from <1% of pixels, then it is considered to be noise-dominated and hence unusable.
| Quadrant | # 1 sec bins | Bins with >0 counts | Bins with >2000 counts | High rate bins dominated by noise | Noise dominated (total time) | Noise dominated (detector-on time) | Marked lightcurve |
|---|---|---|---|---|---|---|---|
| A | 7497 | 6563 | 11 | 11 | 0.15% | 0.17% | 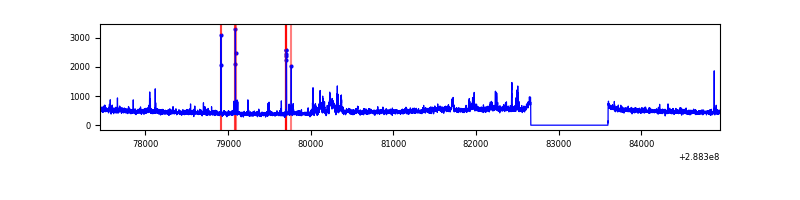 |
| B | 7498 | 6564 | 17 | 17 | 0.23% | 0.26% | 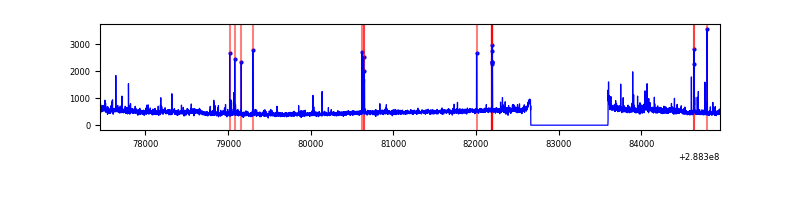 |
| C | 7498 | 6564 | 6 | 6 | 0.08% | 0.09% | 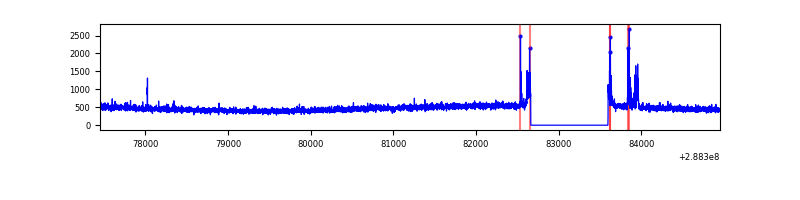 |
| D | 7497 | 6563 | 241 | 241 | 3.21% | 3.67% | 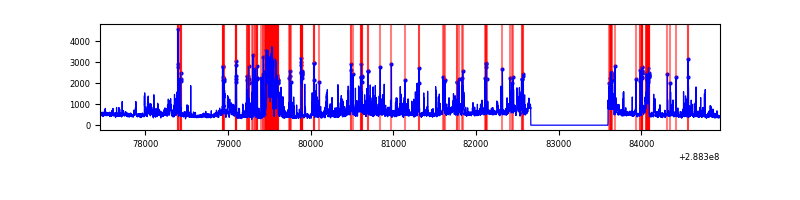 |
Top three noisy pixels from each quadrant. If the there are fewer than three noisy pixels in the level2.evt file, extra rows are filled as -1
| Pixel properties | Quadrant properties | ||||||
|---|---|---|---|---|---|---|---|
| Quadrant | DetID | PixID | Counts | Sigma | Mean | Median | Sigma |
| A | 15 | 174 | 167257 | 1044.18 | 783 | 767 | 159.4 |
| A | 4 | 2 | 48738 | 300.86 | 783 | 767 | 159.4 |
| A | 0 | 226 | 6933 | 38.67 | 783 | 767 | 159.4 |
| B | 3 | 64 | 71361 | 466.34 | 786 | 766 | 151.4 |
| B | 0 | 189 | 62581 | 408.34 | 786 | 766 | 151.4 |
| B | 0 | 197 | 37011 | 239.43 | 786 | 766 | 151.4 |
| C | 14 | 238 | 113931 | 638.62 | 750 | 755 | 177.2 |
| C | 0 | 207 | 76805 | 429.13 | 750 | 755 | 177.2 |
| C | 3 | 233 | 7226 | 36.51 | 750 | 755 | 177.2 |
| D | 1 | 52 | 1309944 | 7150.79 | 746 | 723 | 183.1 |
| D | 7 | 38 | 125892 | 683.66 | 746 | 723 | 183.1 |
| D | 7 | 238 | 125157 | 679.64 | 746 | 723 | 183.1 |
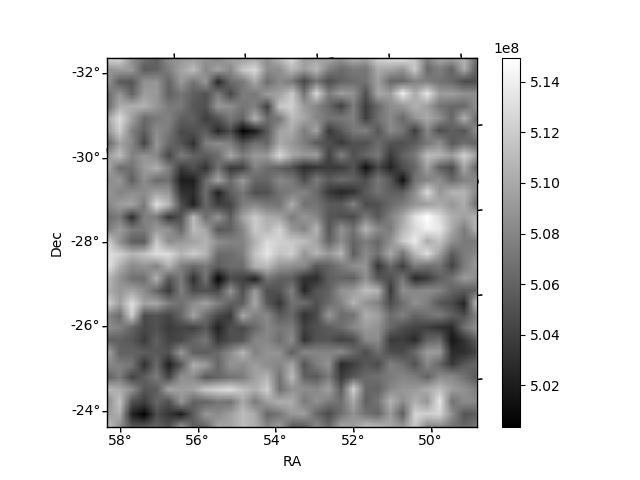
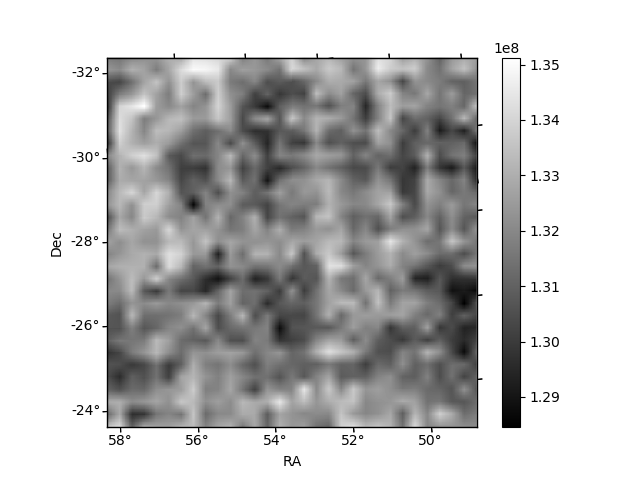
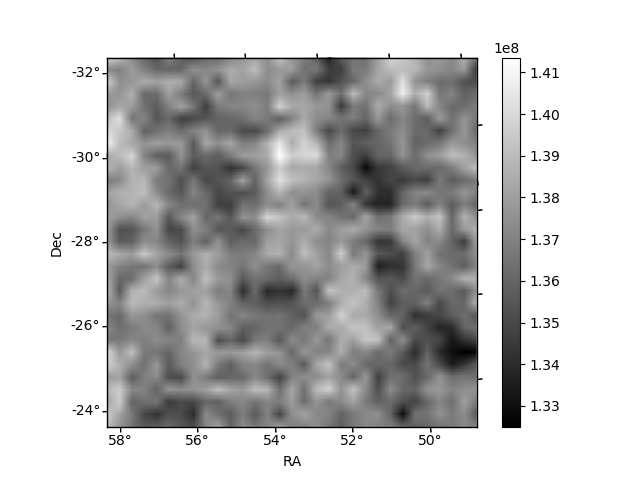
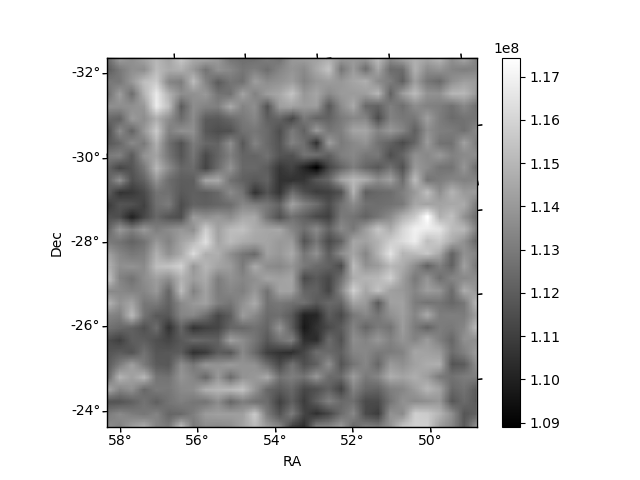
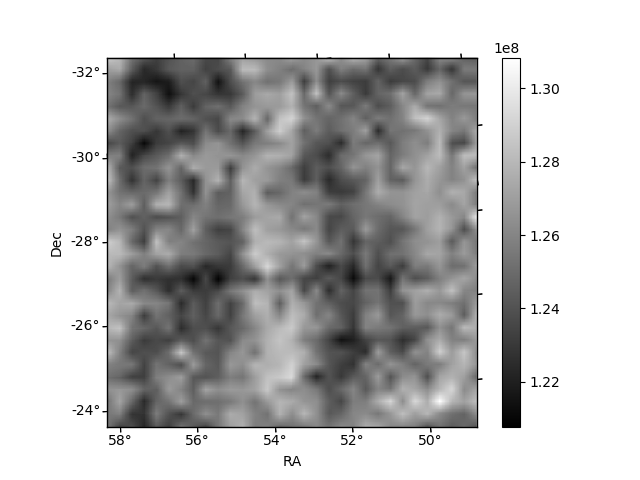
Histogram calculated using DETX and DETY for each event in the final _common_clean file
| Quadrant A | 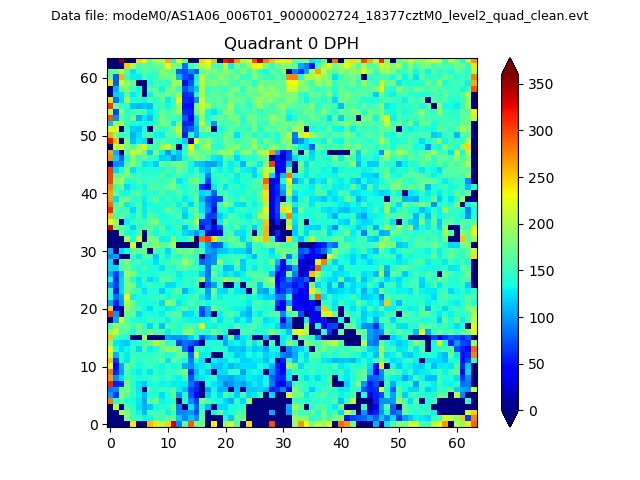 |
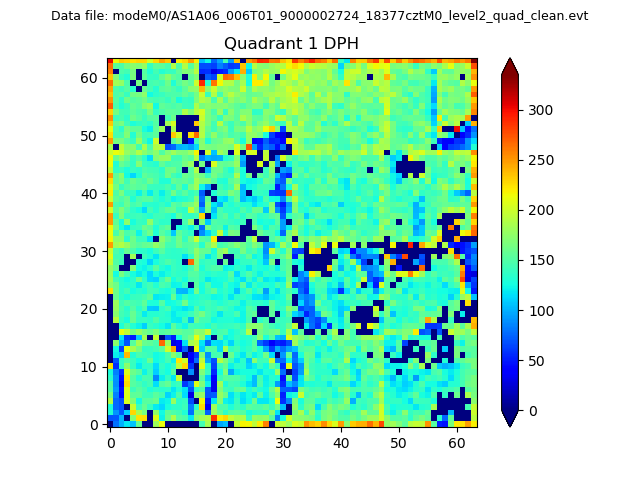 |
Quadrant B |
|---|---|---|---|
| Quadrant D | 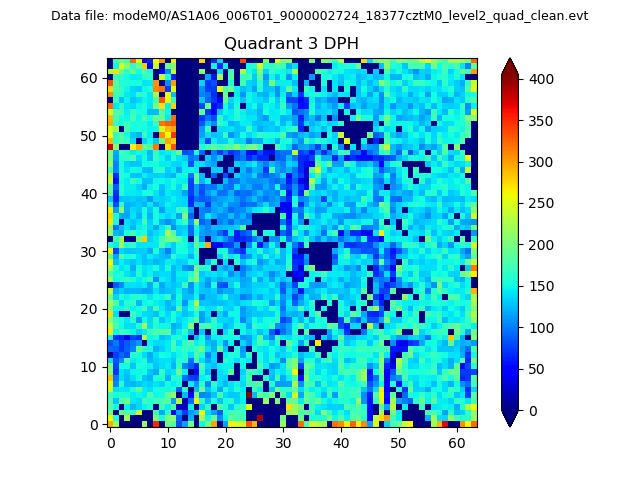 |
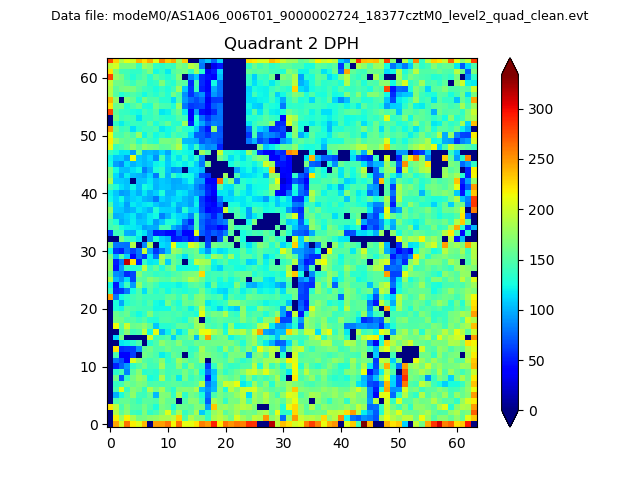 |
Quadrant C |
| Plot type | Count rate plots | Images |
|---|---|---|
| Comparison with Poisson distribution Blue bars denote a histogram of data divided into 1 sec bins. Red curve is a Poisson curve with rate = median count rate of data. |
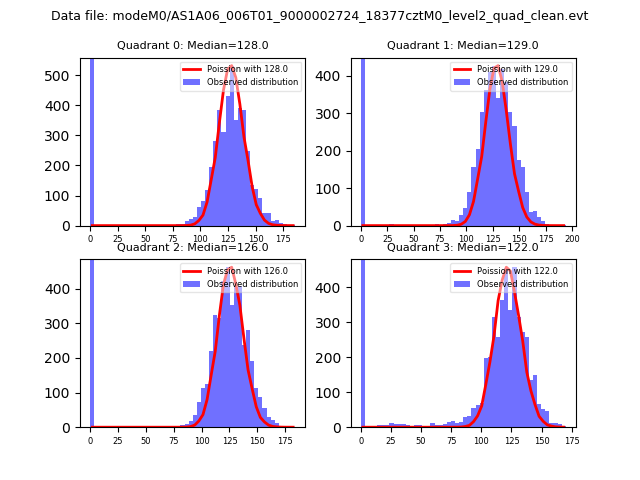 |
 |
| Quadrant-wise count rates Data is divided into 100 sec bins |
 |
|
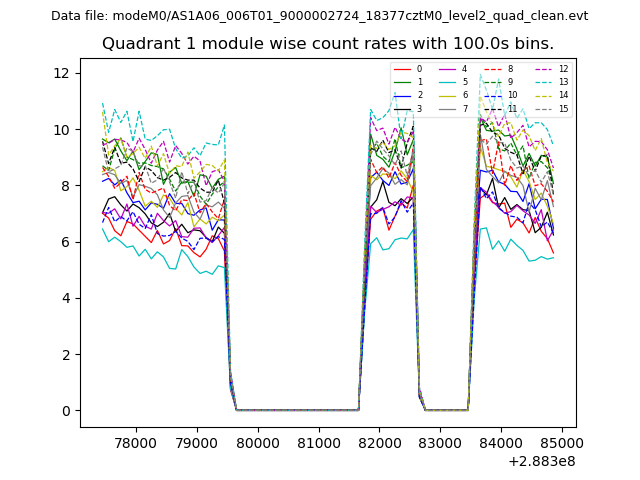
| Module-wise count rates for Quadrant A Data is divided into 100 sec bins |
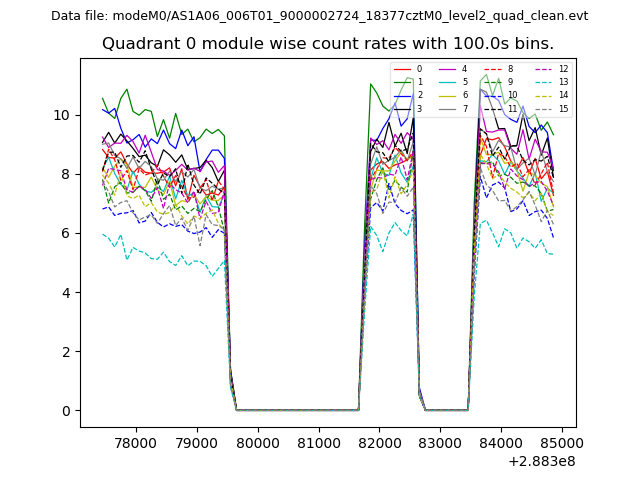 |
 |
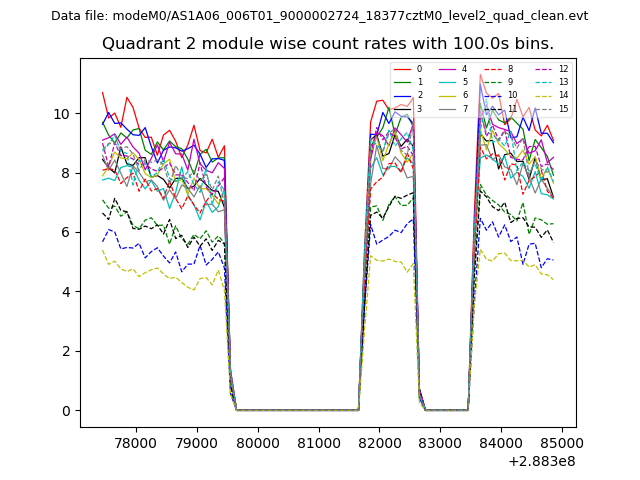
| Module-wise count rates for Quadrant B Data is divided into 100 sec bins |
 |
 |
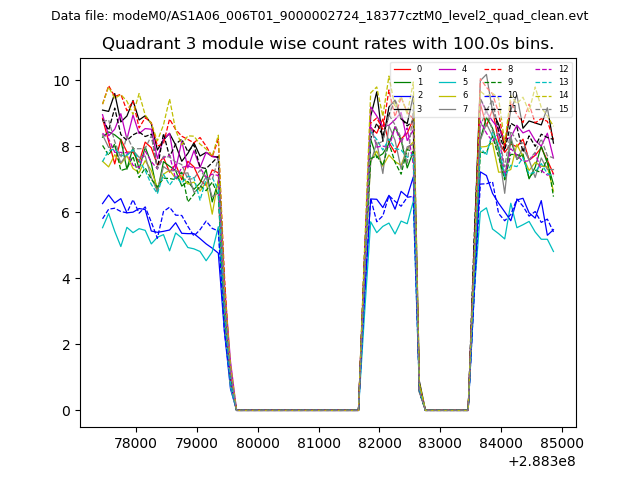
| Module-wise count rates for Quadrant C Data is divided into 100 sec bins |
 |
 |
| Module-wise count rates for Quadrant D Data is divided into 100 sec bins |
 |
 |
| Parameter | Plot |
|---|---|
| CZT HV Monitor | 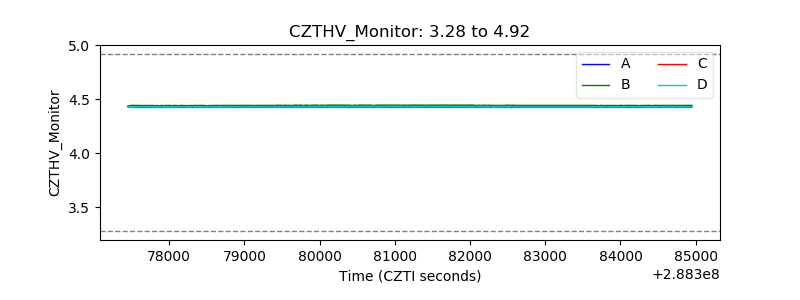 |
| D_VDD | 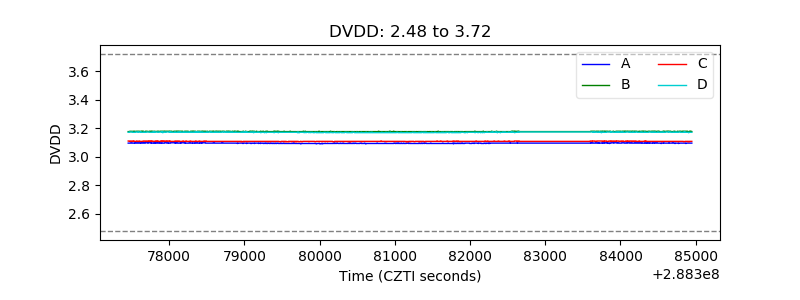 |
| Temperature 1 | 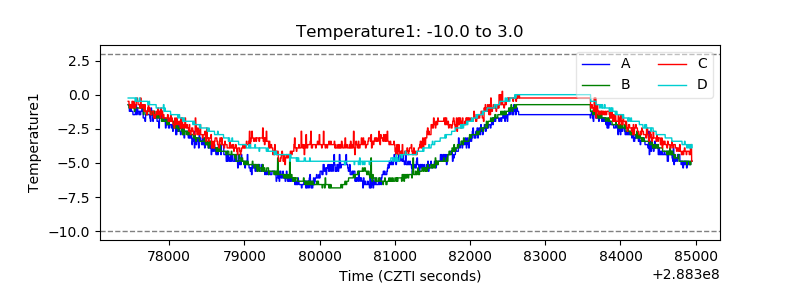 |
| Veto HV Monitor |  |
| Veto LLD | 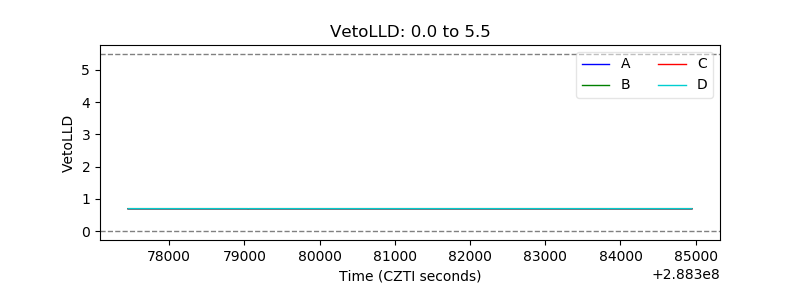 |
| Alpha Counter | 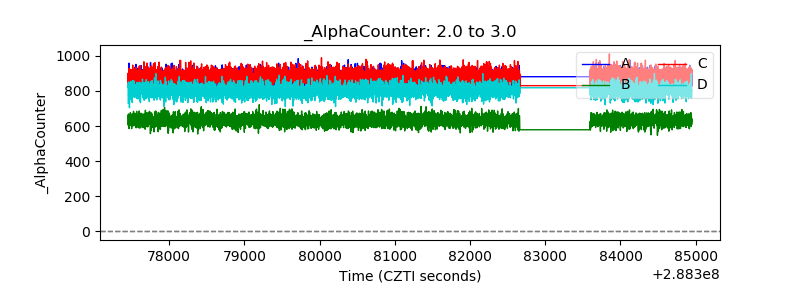 |
| _CPM_Rate |  |
| CZT Counter | 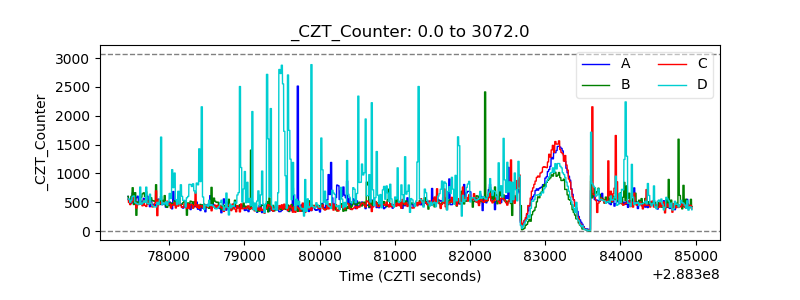 |
| +2.5 Volts monitor |  |
| +5 Volts monitor |  |
| _ROLL_ROT | 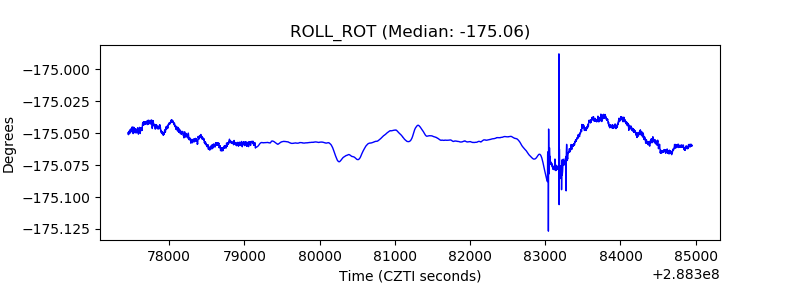 |
| _Roll_DEC | 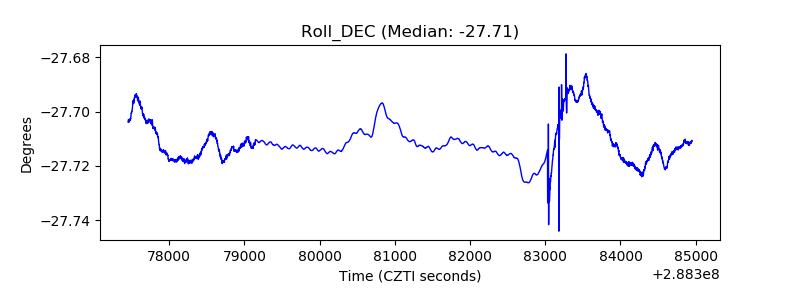 |
| _Roll_RA | 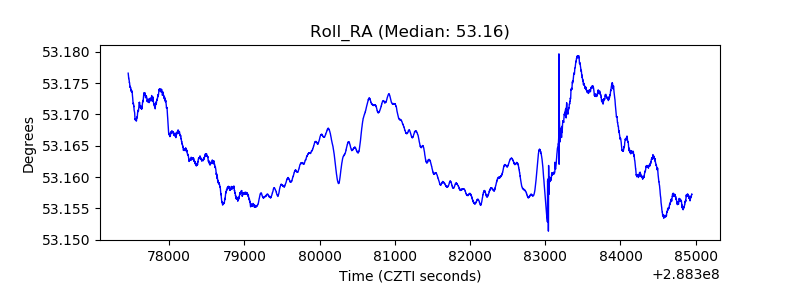 |
| Veto Counter | 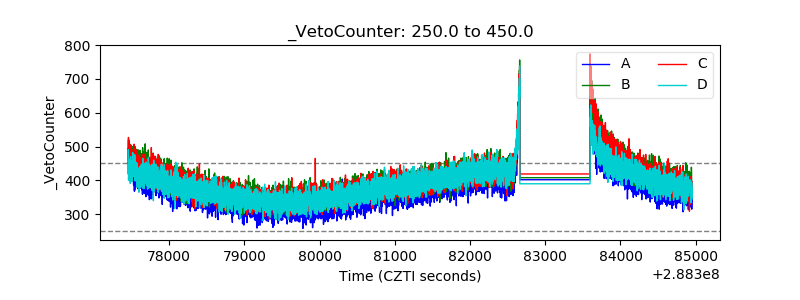 |