| Param | Original file | Final file |
|---|---|---|
| Filename | modeM0/AS1A06_006T01_9000002724_18378cztM0_level2.evt | modeM0/AS1A06_006T01_9000002724_18378cztM0_level2_quad_clean.evt |
| Size (bytes) | 481,579,200 | 89,778,240 |
| Size | 459.3 MB | 85.6 MB |
| Events in quadrant A | 3,185,719 | 575,344 |
| Events in quadrant B | 3,424,137 | 583,584 |
| Events in quadrant C | 3,185,625 | 567,743 |
| Events in quadrant D | 4,347,047 | 537,795 |
| Mode M0 | |||
|---|---|---|---|
| Quadrant | BADHDUFLAG | Total packets | Discarded packets |
| A | 0 | 13590 | 2 |
| B | 0 | 14303 | 2 |
| C | 0 | 13615 | 2 |
| D | 0 | 17306 | 7 |
| Mode SS | |||
|---|---|---|---|
| Quadrant | BADHDUFLAG | Total packets | Discarded packets |
| A | 0 | 132 | 0 |
| B | 0 | 132 | 0 |
| C | 0 | 132 | 0 |
| D | 0 | 132 | 0 |
| Mode M9 | |||
|---|---|---|---|
| Quadrant | BADHDUFLAG | Total packets | Discarded packets |
| A | 0 | 19 | 0 |
| B | 0 | 20 | 0 |
| C | 0 | 20 | 0 |
| D | 0 | 20 | 0 |
| Quadrant | Total seconds | Saturated seconds | Saturation percentage |
|---|---|---|---|
| A | 6514 | 19 | 0.291679% |
| B | 6514 | 53 | 0.813632% |
| C | 6514 | 61 | 0.936445% |
| D | 6513 | 205 | 3.147551% |
Noise dominated data is calculated using 1-second bins in cleaned event files. If a bin has >2000 counts, and if more than 50% of those come from <1% of pixels, then it is considered to be noise-dominated and hence unusable.
| Quadrant | # 1 sec bins | Bins with >0 counts | Bins with >2000 counts | High rate bins dominated by noise | Noise dominated (total time) | Noise dominated (detector-on time) | Marked lightcurve |
|---|---|---|---|---|---|---|---|
| A | 7609 | 6515 | 3 | 3 | 0.04% | 0.05% | 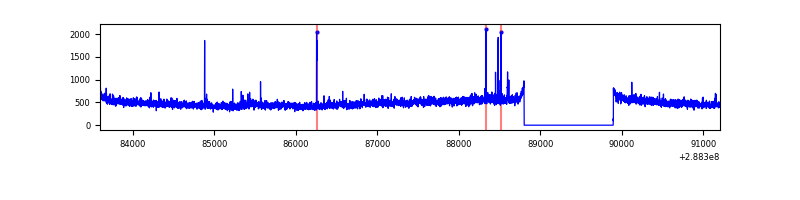 |
| B | 7609 | 6515 | 25 | 25 | 0.33% | 0.38% | 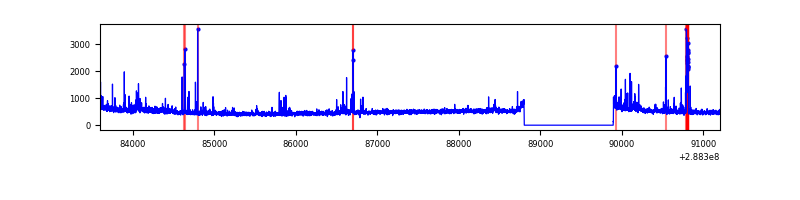 |
| C | 7609 | 6515 | 11 | 11 | 0.14% | 0.17% | 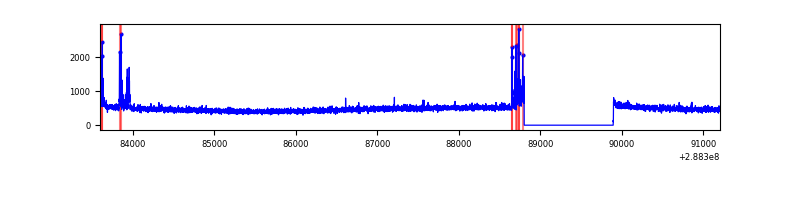 |
| D | 7608 | 6514 | 188 | 188 | 2.47% | 2.89% | 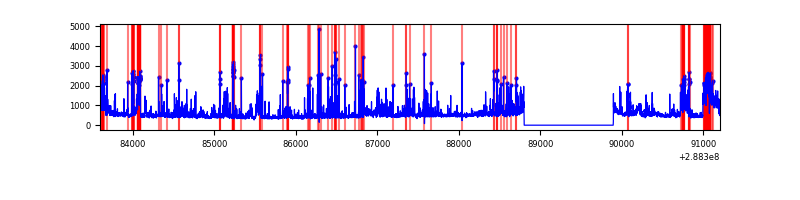 |
Top three noisy pixels from each quadrant. If the there are fewer than three noisy pixels in the level2.evt file, extra rows are filled as -1
| Pixel properties | Quadrant properties | ||||||
|---|---|---|---|---|---|---|---|
| Quadrant | DetID | PixID | Counts | Sigma | Mean | Median | Sigma |
| A | 8 | 34 | 71938 | 440.29 | 792 | 775 | 161.6 |
| A | 4 | 2 | 39081 | 237.0 | 792 | 775 | 161.6 |
| A | 15 | 174 | 17347 | 102.53 | 792 | 775 | 161.6 |
| B | 0 | 189 | 56181 | 365.48 | 796 | 777 | 151.6 |
| B | 15 | 222 | 56180 | 365.47 | 796 | 777 | 151.6 |
| B | 0 | 244 | 55107 | 358.39 | 796 | 777 | 151.6 |
| C | 14 | 238 | 117713 | 655.96 | 759 | 765 | 178.3 |
| C | 0 | 207 | 103274 | 574.97 | 759 | 765 | 178.3 |
| C | 3 | 233 | 5831 | 28.41 | 759 | 765 | 178.3 |
| D | 1 | 52 | 1087288 | 5851.53 | 756 | 733 | 185.7 |
| D | 7 | 38 | 202813 | 1088.28 | 756 | 733 | 185.7 |
| D | 2 | 33 | 79637 | 424.93 | 756 | 733 | 185.7 |
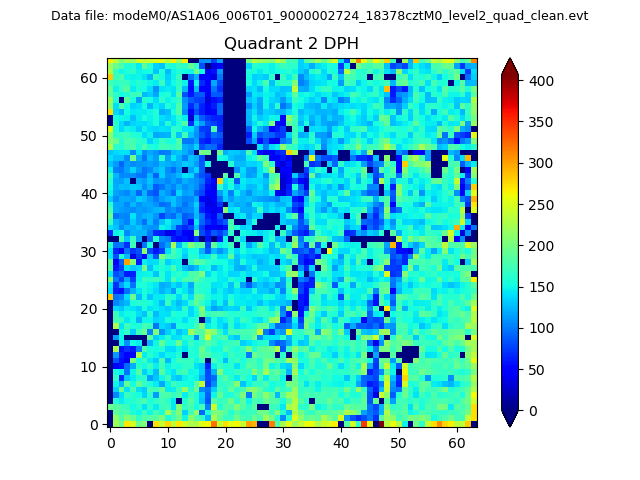
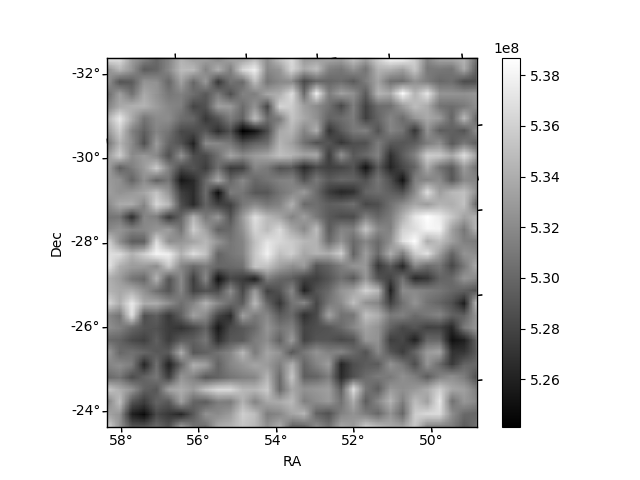
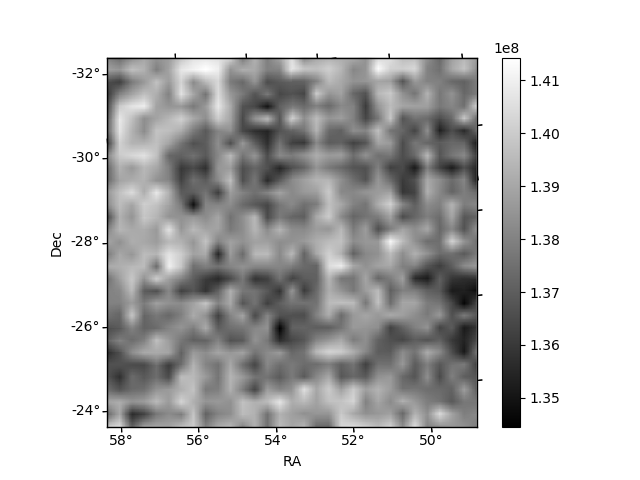
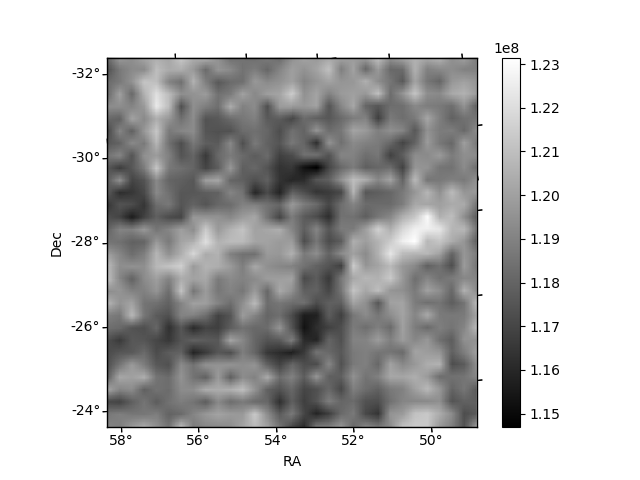
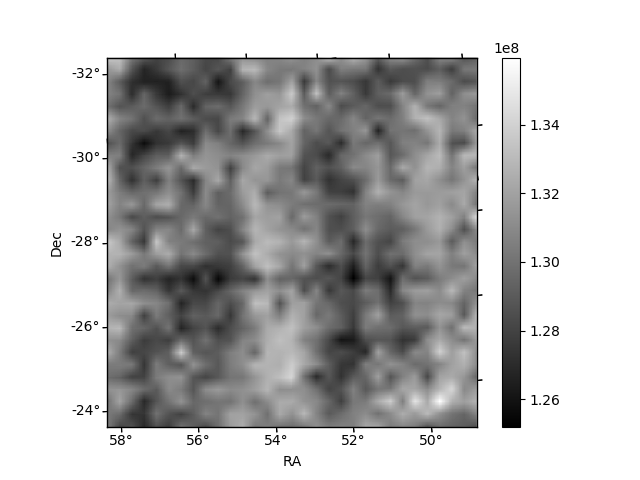
Histogram calculated using DETX and DETY for each event in the final _common_clean file
| Quadrant A | 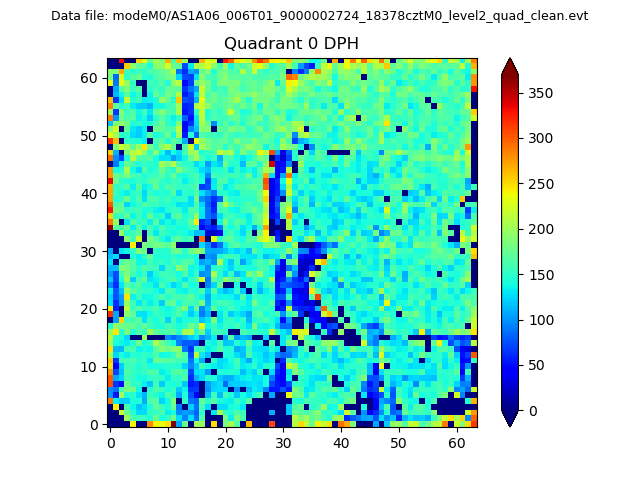 |
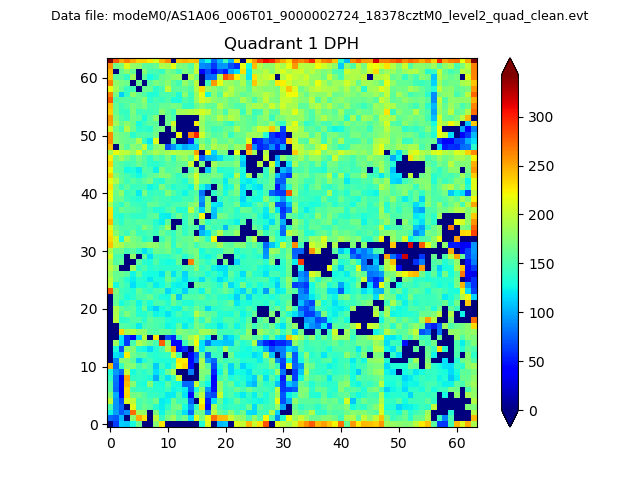 |
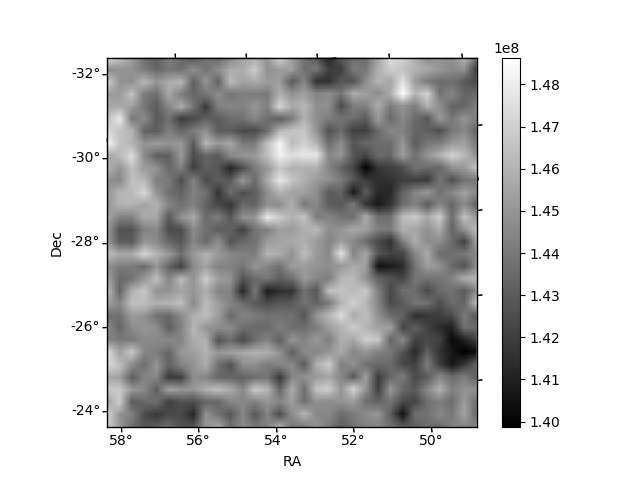
Quadrant B |
|---|---|---|---|
| Quadrant D | 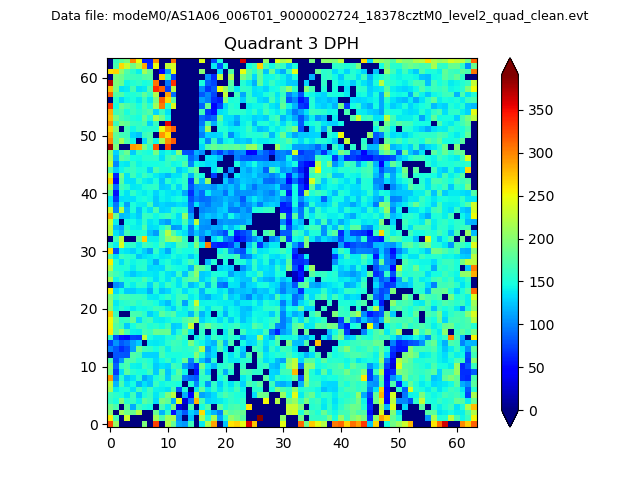 |
 |
Quadrant C |
| Plot type | Count rate plots | Images |
|---|---|---|
| Comparison with Poisson distribution Blue bars denote a histogram of data divided into 1 sec bins. Red curve is a Poisson curve with rate = median count rate of data. |
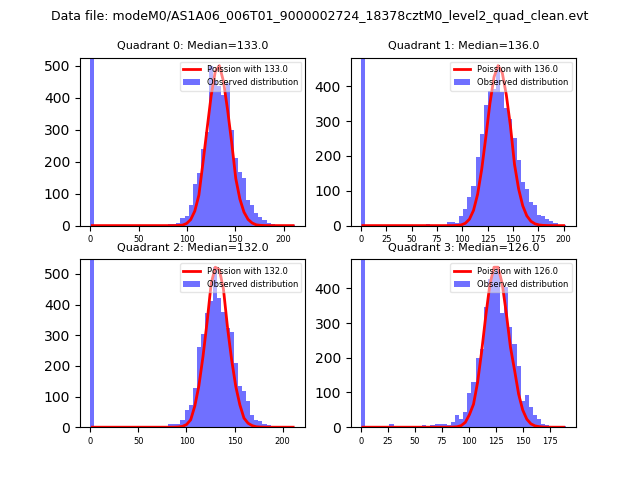 |
 |
| Quadrant-wise count rates Data is divided into 100 sec bins |
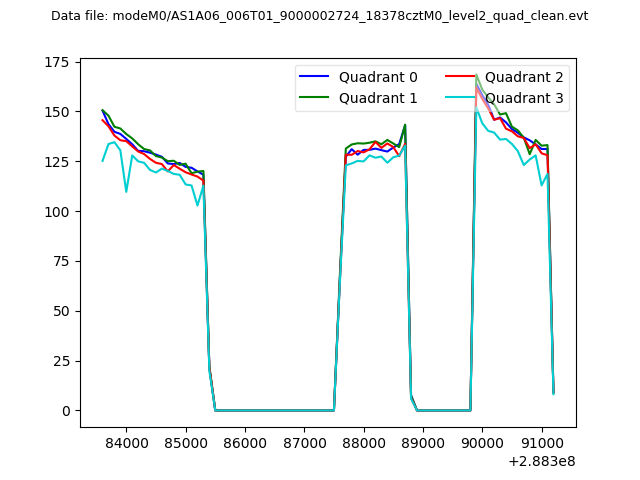 |
|
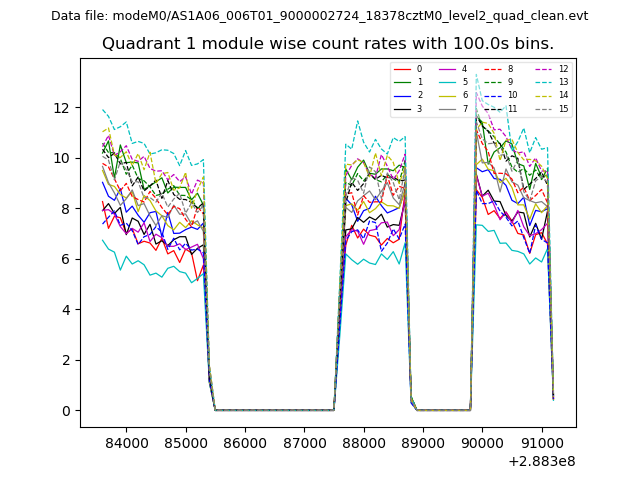
| Module-wise count rates for Quadrant A Data is divided into 100 sec bins |
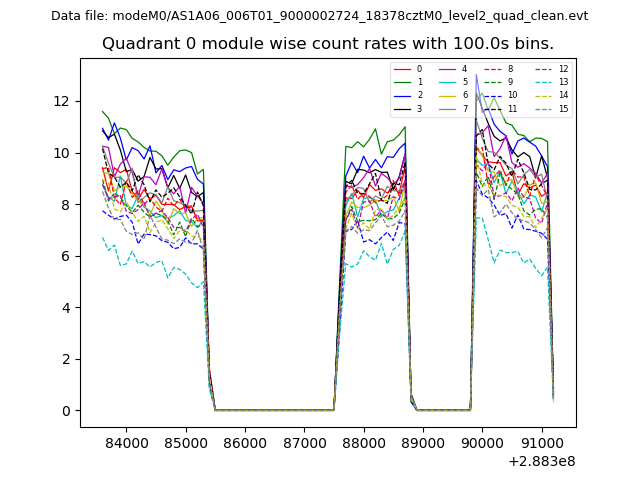 |
 |
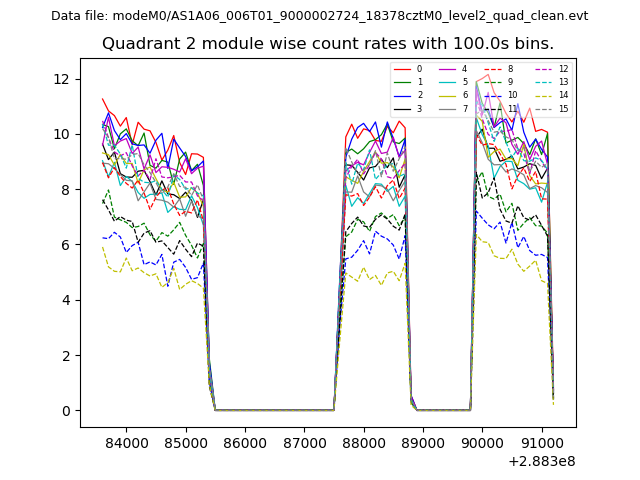
| Module-wise count rates for Quadrant B Data is divided into 100 sec bins |
 |
 |
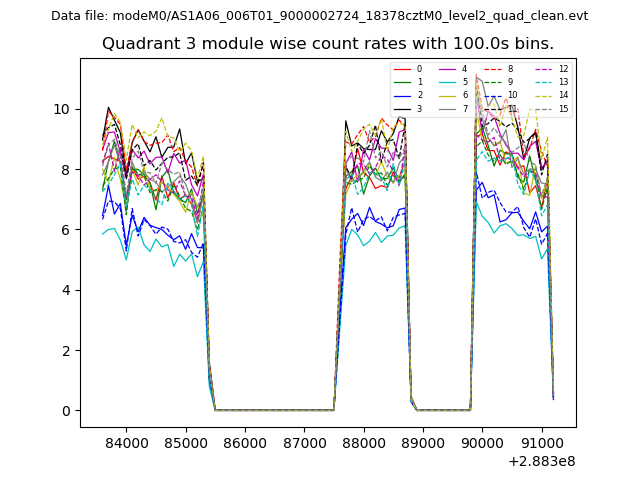
| Module-wise count rates for Quadrant C Data is divided into 100 sec bins |
 |
 |
| Module-wise count rates for Quadrant D Data is divided into 100 sec bins |
 |
 |
| Parameter | Plot |
|---|---|
| CZT HV Monitor | 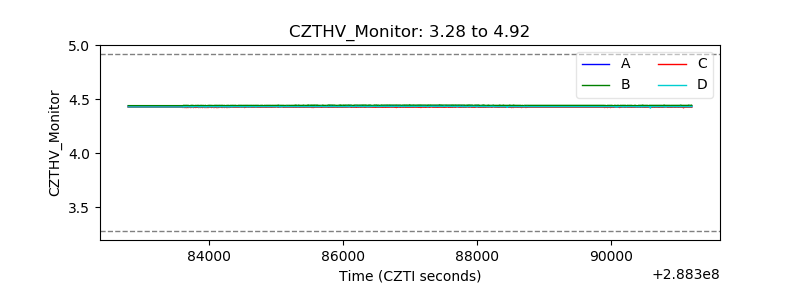 |
| D_VDD | 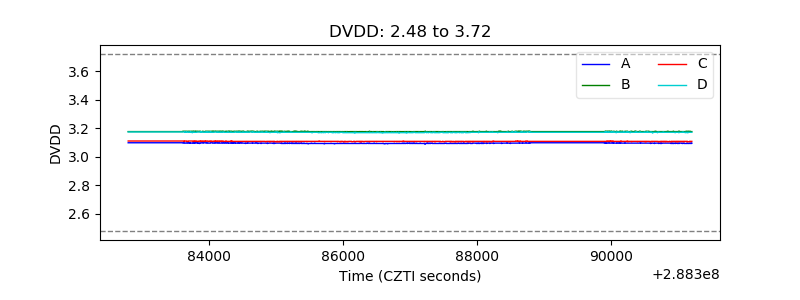 |
| Temperature 1 | 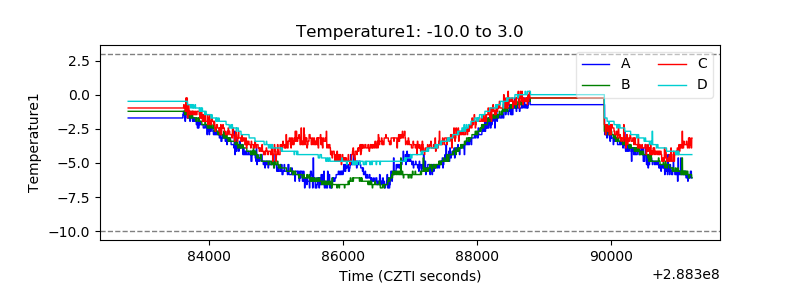 |
| Veto HV Monitor |  |
| Veto LLD | 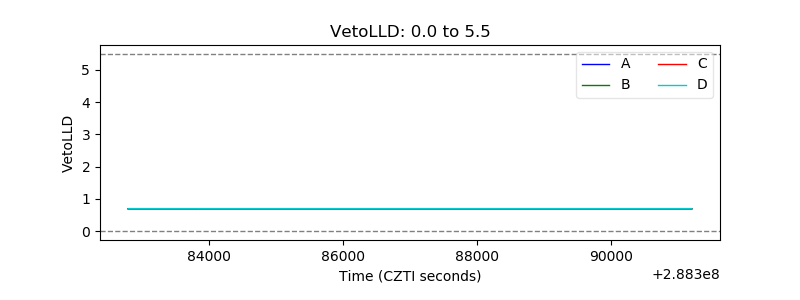 |
| Alpha Counter | 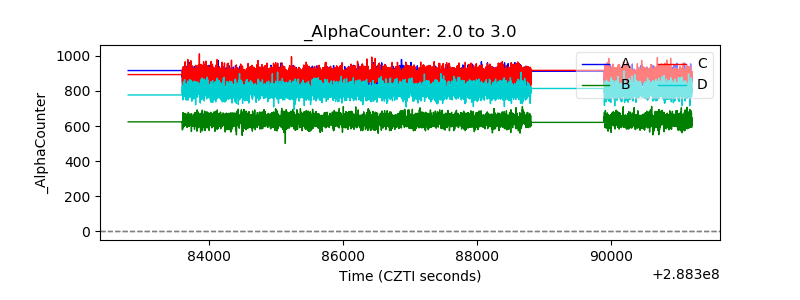 |
| _CPM_Rate | 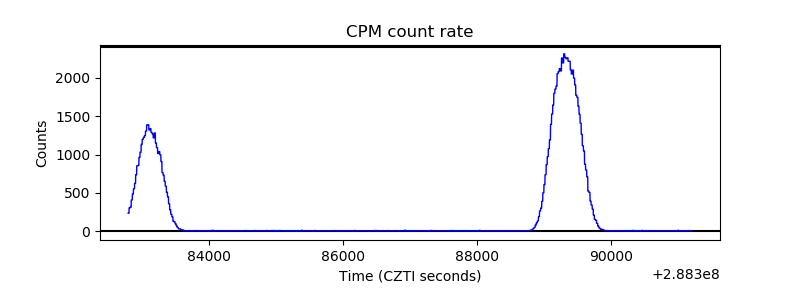 |
| CZT Counter | 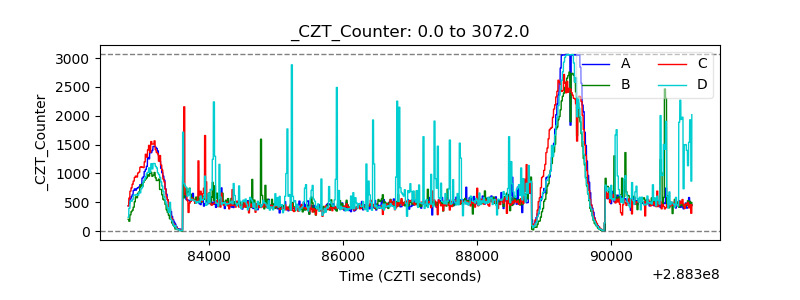 |
| +2.5 Volts monitor |  |
| +5 Volts monitor |  |
| _ROLL_ROT | 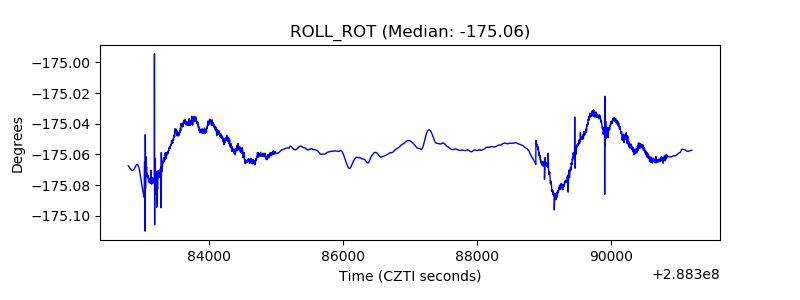 |
| _Roll_DEC | 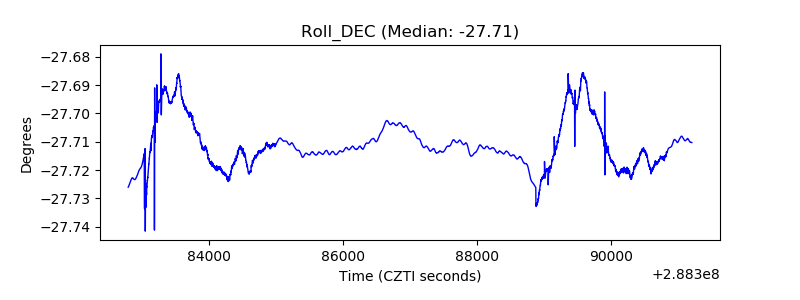 |
| _Roll_RA | 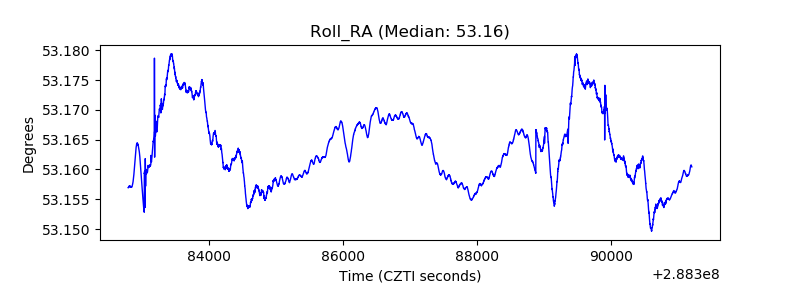 |
| Veto Counter | 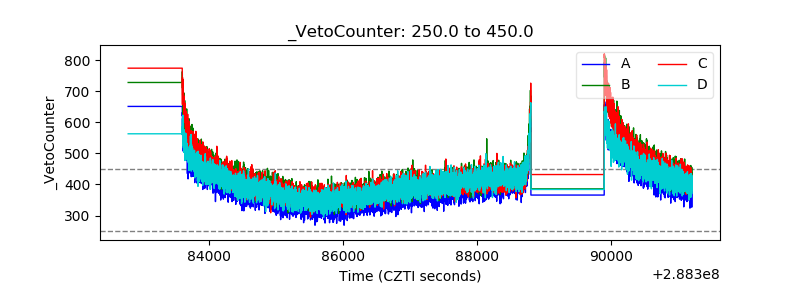 |