| Param | Original file | Final file |
|---|---|---|
| Filename | modeM0/AS1A06_006T01_9000002724_18380cztM0_level2.evt | modeM0/AS1A06_006T01_9000002724_18380cztM0_level2_quad_clean.evt |
| Size (bytes) | 482,022,720 | 85,403,520 |
| Size | 459.7 MB | 81.4 MB |
| Events in quadrant A | 3,136,305 | 543,545 |
| Events in quadrant B | 3,341,253 | 554,662 |
| Events in quadrant C | 3,180,038 | 535,263 |
| Events in quadrant D | 4,512,112 | 512,119 |
| Mode M0 | |||
|---|---|---|---|
| Quadrant | BADHDUFLAG | Total packets | Discarded packets |
| A | 0 | 13230 | 2 |
| B | 0 | 13877 | 3 |
| C | 0 | 13282 | 2 |
| D | 0 | 17506 | 2 |
| Mode SS | |||
|---|---|---|---|
| Quadrant | BADHDUFLAG | Total packets | Discarded packets |
| A | 0 | 128 | 0 |
| B | 0 | 128 | 0 |
| C | 0 | 128 | 0 |
| D | 0 | 128 | 0 |
| Mode M9 | |||
|---|---|---|---|
| Quadrant | BADHDUFLAG | Total packets | Discarded packets |
| A | 0 | 19 | 0 |
| B | 0 | 20 | 0 |
| C | 0 | 20 | 0 |
| D | 0 | 20 | 0 |
| Quadrant | Total seconds | Saturated seconds | Saturation percentage |
|---|---|---|---|
| A | 6314 | 24 | 0.380108% |
| B | 6313 | 60 | 0.950420% |
| C | 6313 | 57 | 0.902899% |
| D | 6313 | 136 | 2.154285% |
Noise dominated data is calculated using 1-second bins in cleaned event files. If a bin has >2000 counts, and if more than 50% of those come from <1% of pixels, then it is considered to be noise-dominated and hence unusable.
| Quadrant | # 1 sec bins | Bins with >0 counts | Bins with >2000 counts | High rate bins dominated by noise | Noise dominated (total time) | Noise dominated (detector-on time) | Marked lightcurve |
|---|---|---|---|---|---|---|---|
| A | 7504 | 6315 | 4 | 4 | 0.05% | 0.06% | 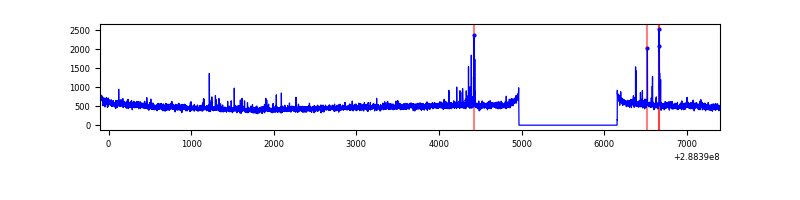 |
| B | 7503 | 6314 | 23 | 23 | 0.31% | 0.36% | 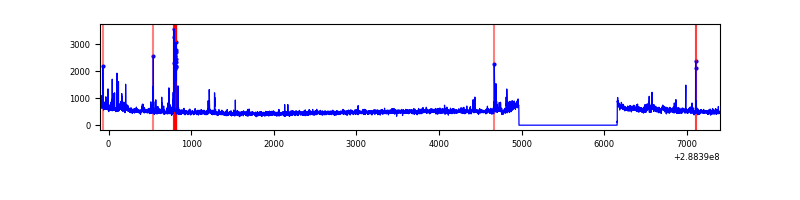 |
| C | 7503 | 6314 | 5 | 5 | 0.07% | 0.08% | 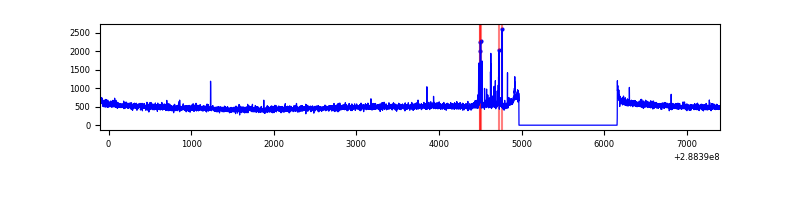 |
| D | 7503 | 6314 | 164 | 164 | 2.19% | 2.60% | 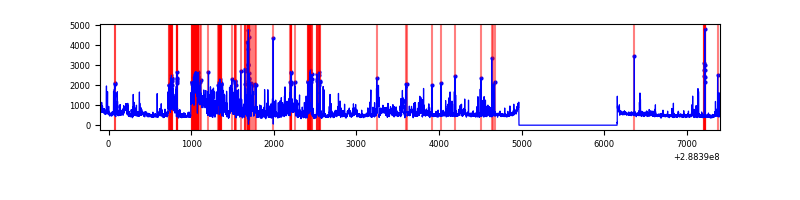 |
Top three noisy pixels from each quadrant. If the there are fewer than three noisy pixels in the level2.evt file, extra rows are filled as -1
| Pixel properties | Quadrant properties | ||||||
|---|---|---|---|---|---|---|---|
| Quadrant | DetID | PixID | Counts | Sigma | Mean | Median | Sigma |
| A | 15 | 174 | 35436 | 218.45 | 790 | 775 | 158.7 |
| A | 4 | 2 | 32430 | 199.51 | 790 | 775 | 158.7 |
| A | 8 | 34 | 16458 | 98.84 | 790 | 775 | 158.7 |
| B | 15 | 222 | 59401 | 388.76 | 798 | 781 | 150.8 |
| B | 4 | 216 | 36488 | 236.8 | 798 | 781 | 150.8 |
| B | 0 | 244 | 36079 | 234.09 | 798 | 781 | 150.8 |
| C | 14 | 238 | 118717 | 659.63 | 762 | 766 | 178.8 |
| C | 0 | 207 | 53289 | 293.73 | 762 | 766 | 178.8 |
| C | 3 | 233 | 31215 | 170.28 | 762 | 766 | 178.8 |
| D | 1 | 52 | 1437162 | 7667.68 | 759 | 735 | 187.3 |
| D | 14 | 34 | 111208 | 589.71 | 759 | 735 | 187.3 |
| D | 7 | 38 | 34928 | 182.52 | 759 | 735 | 187.3 |
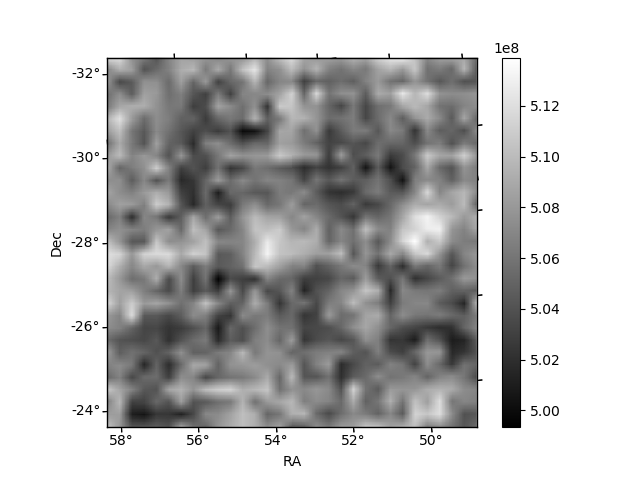
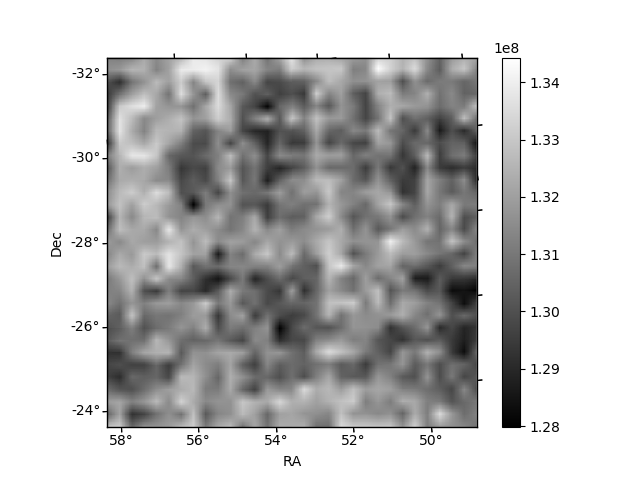
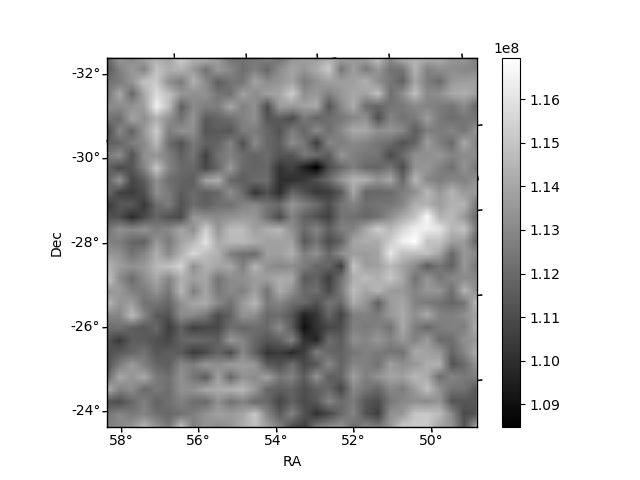
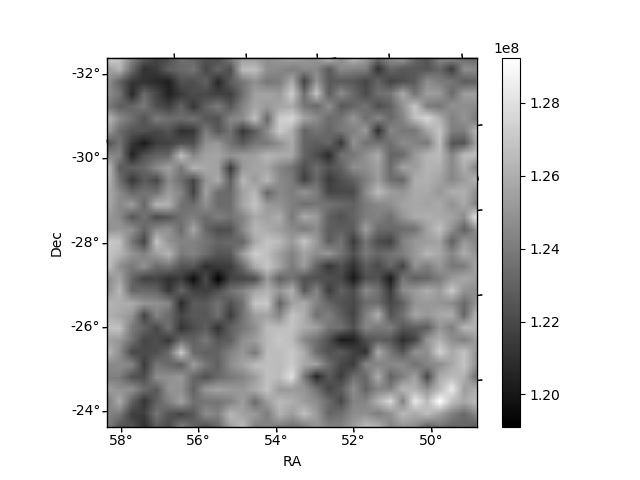
Histogram calculated using DETX and DETY for each event in the final _common_clean file
| Quadrant A | 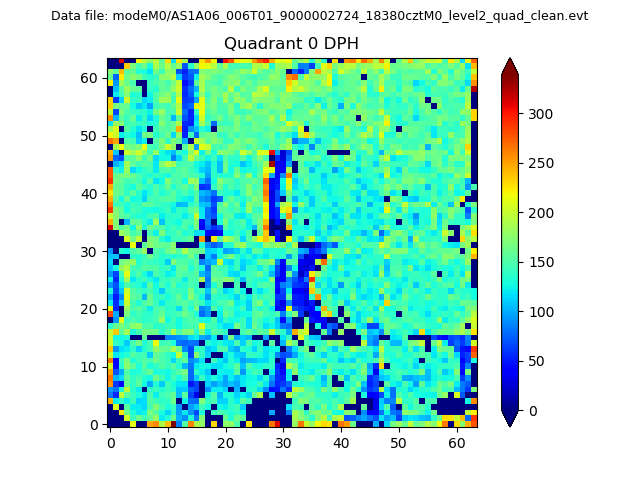 |
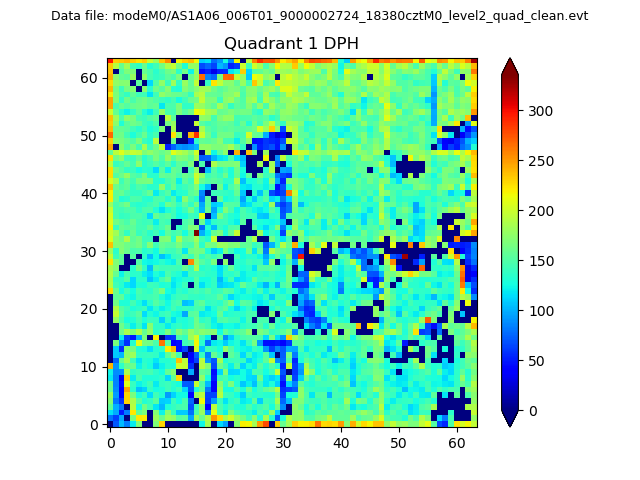 |
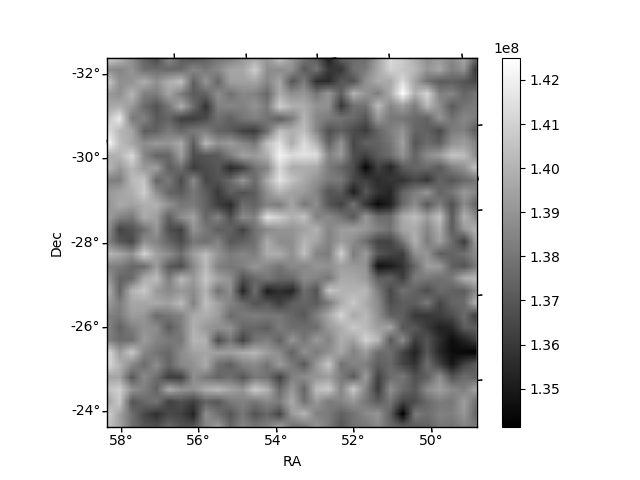
Quadrant B |
|---|---|---|---|
| Quadrant D | 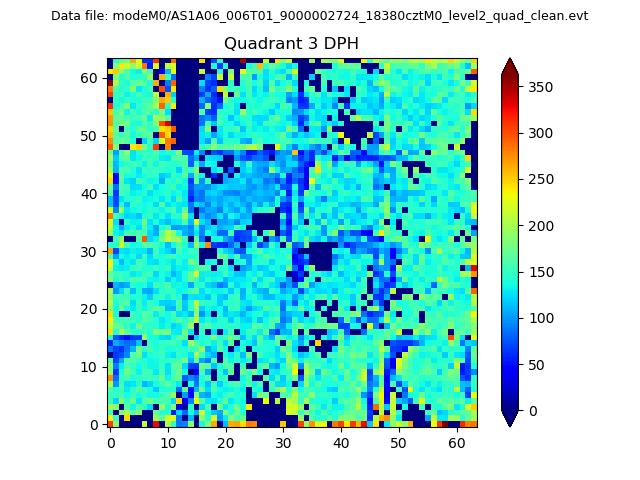 |
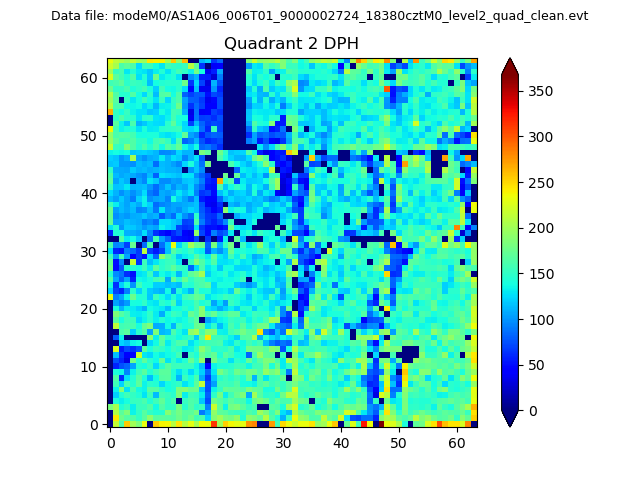 |
Quadrant C |
| Plot type | Count rate plots | Images |
|---|---|---|
| Comparison with Poisson distribution Blue bars denote a histogram of data divided into 1 sec bins. Red curve is a Poisson curve with rate = median count rate of data. |
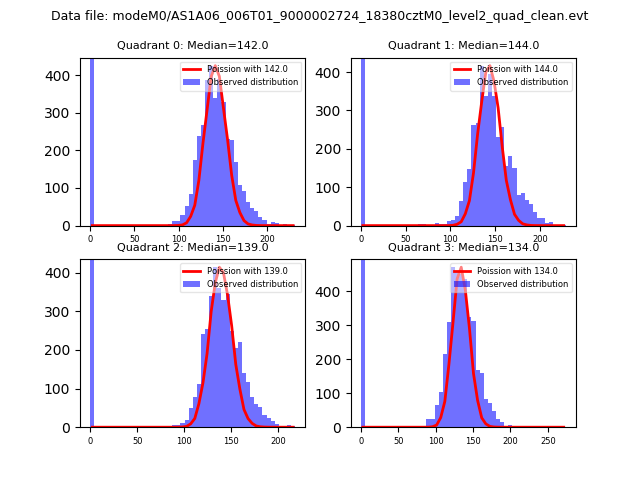 |
 |
| Quadrant-wise count rates Data is divided into 100 sec bins |
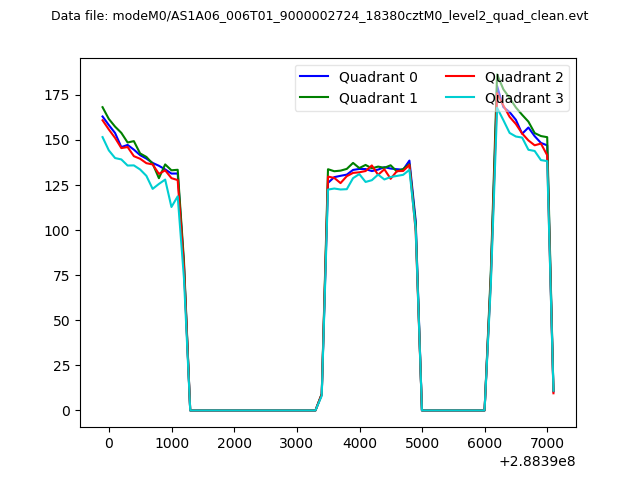 |
|
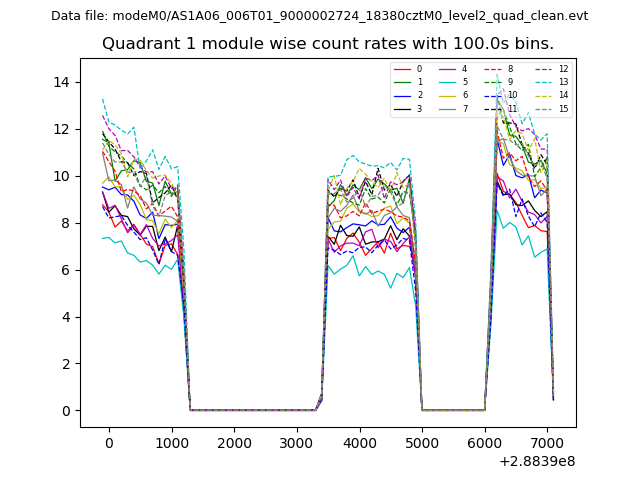
| Module-wise count rates for Quadrant A Data is divided into 100 sec bins |
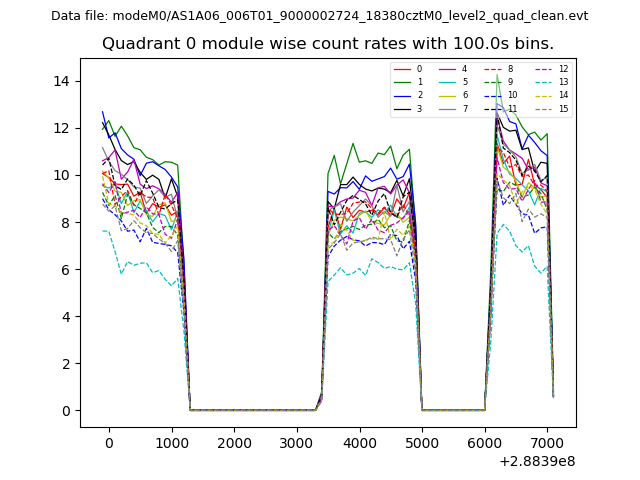 |
 |
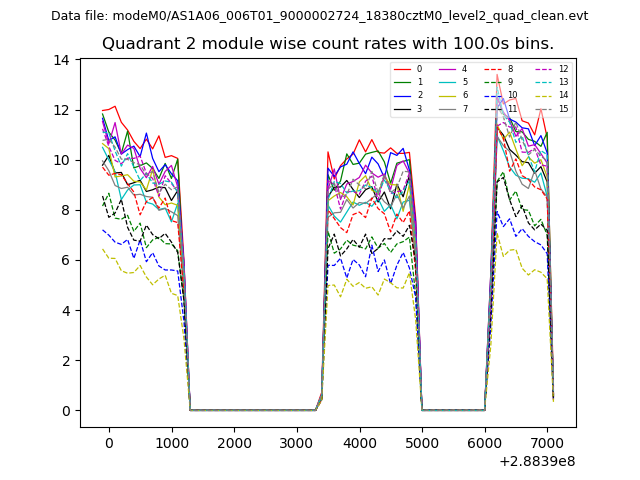
| Module-wise count rates for Quadrant B Data is divided into 100 sec bins |
 |
 |
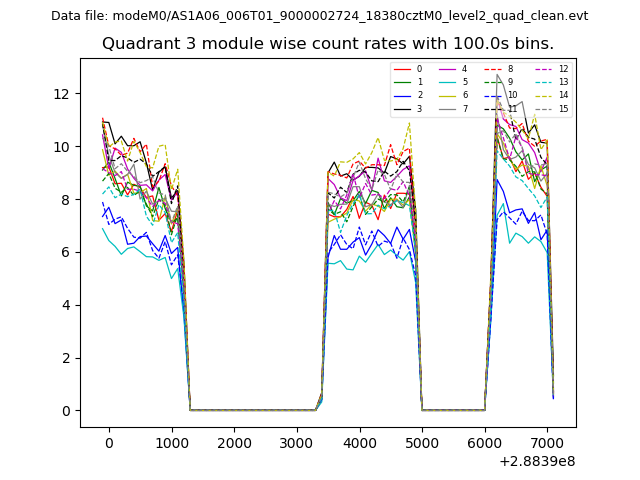
| Module-wise count rates for Quadrant C Data is divided into 100 sec bins |
 |
 |
| Module-wise count rates for Quadrant D Data is divided into 100 sec bins |
 |
 |
| Parameter | Plot |
|---|---|
| CZT HV Monitor | 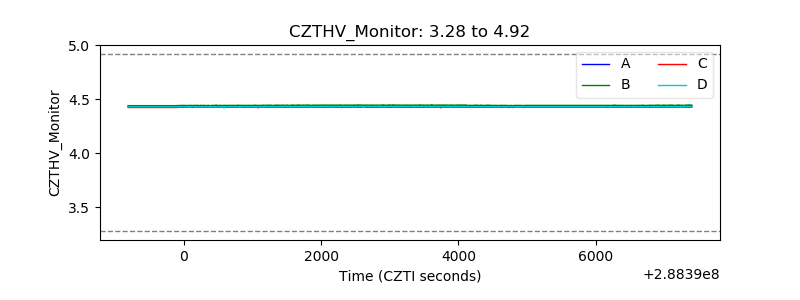 |
| D_VDD | 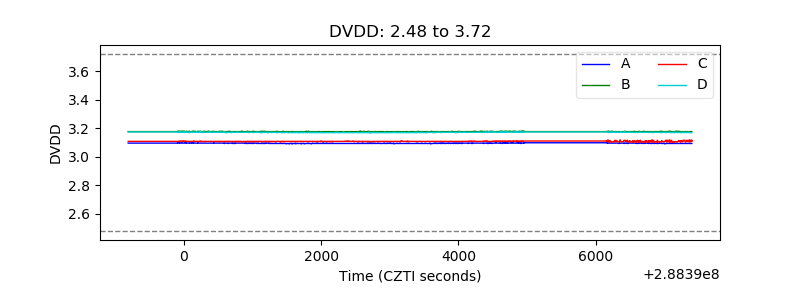 |
| Temperature 1 | 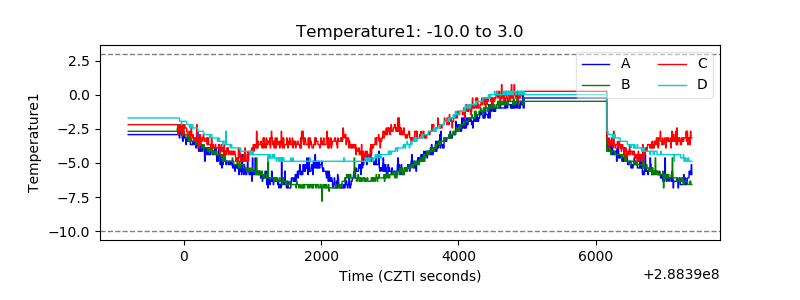 |
| Veto HV Monitor |  |
| Veto LLD | 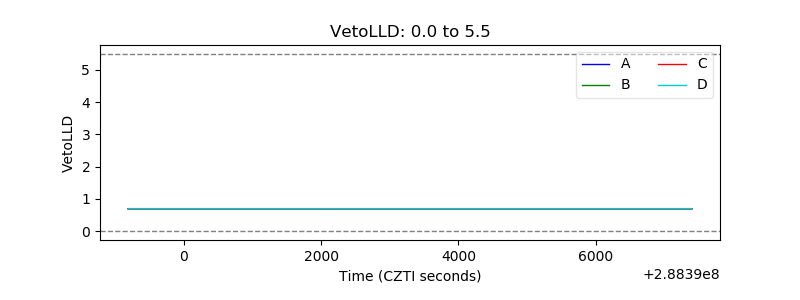 |
| Alpha Counter | 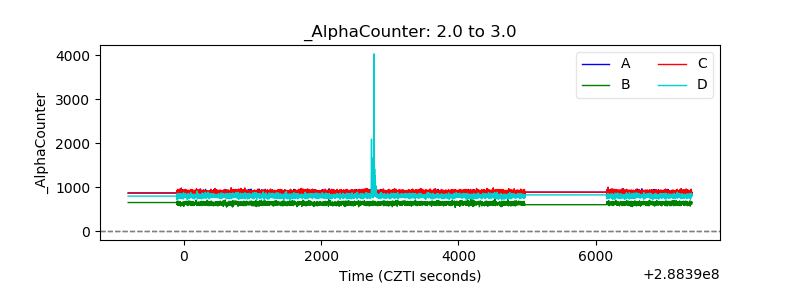 |
| _CPM_Rate | 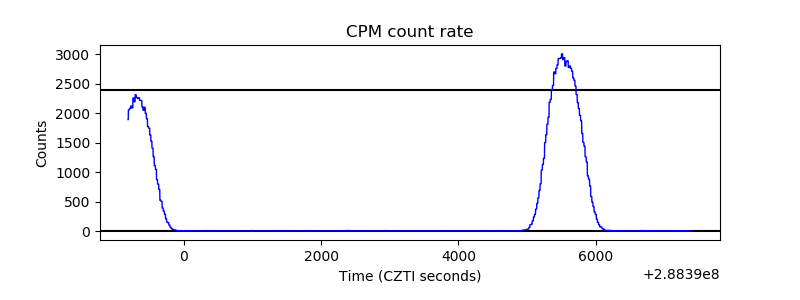 |
| CZT Counter | 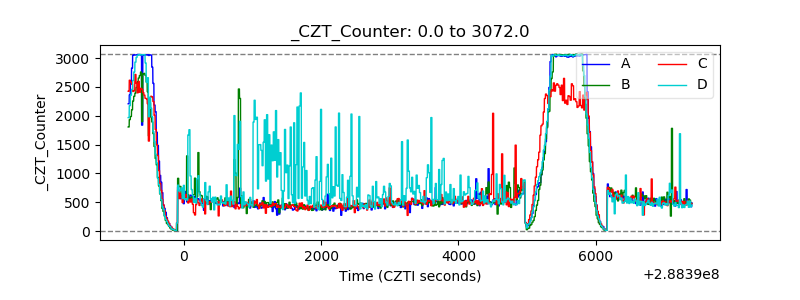 |
| +2.5 Volts monitor | 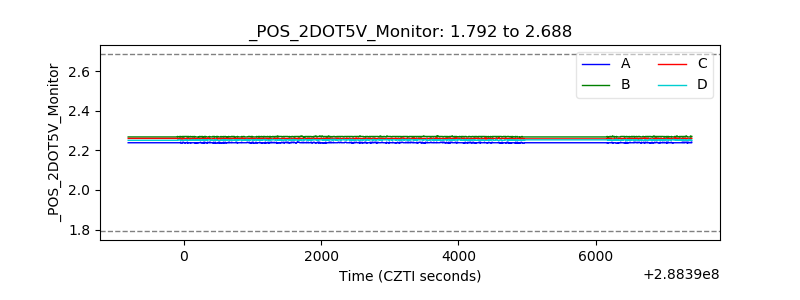 |
| +5 Volts monitor |  |
| _ROLL_ROT | 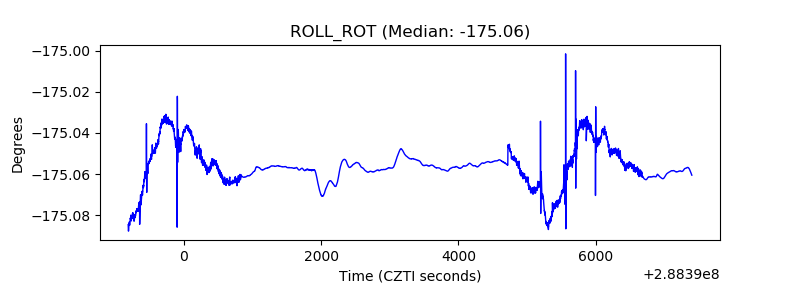 |
| _Roll_DEC | 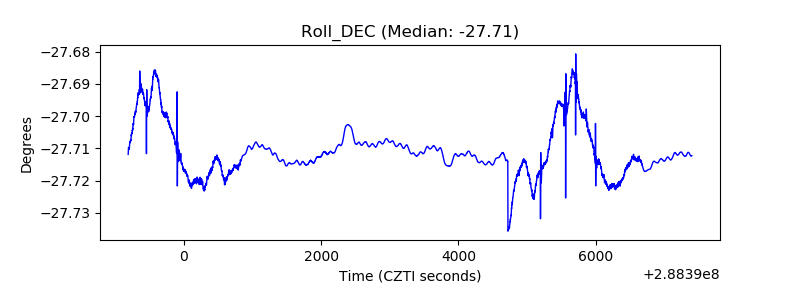 |
| _Roll_RA | 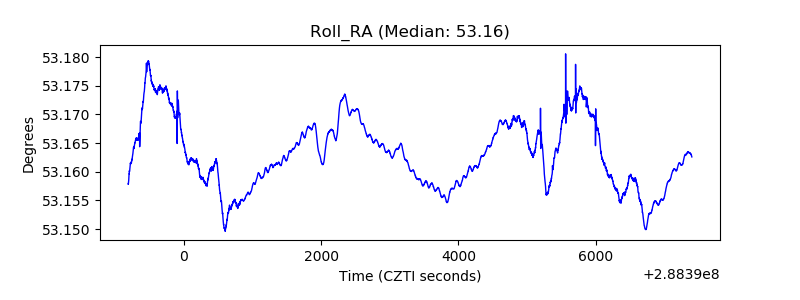 |
| Veto Counter | 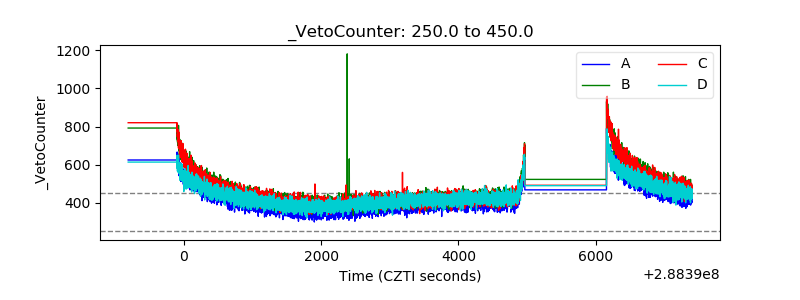 |