| Param | Original file | Final file |
|---|---|---|
| Filename | modeM0/AS1A06_006T01_9000002724_18381cztM0_level2.evt | modeM0/AS1A06_006T01_9000002724_18381cztM0_level2_quad_clean.evt |
| Size (bytes) | 497,419,200 | 79,243,200 |
| Size | 474.4 MB | 75.6 MB |
| Events in quadrant A | 3,398,689 | 492,891 |
| Events in quadrant B | 3,457,533 | 507,639 |
| Events in quadrant C | 3,562,250 | 478,916 |
| Events in quadrant D | 4,201,645 | 463,664 |
| Mode M0 | |||
|---|---|---|---|
| Quadrant | BADHDUFLAG | Total packets | Discarded packets |
| A | 0 | 14030 | 2 |
| B | 0 | 14159 | 2 |
| C | 0 | 14352 | 2 |
| D | 0 | 16622 | 2 |
| Mode SS | |||
|---|---|---|---|
| Quadrant | BADHDUFLAG | Total packets | Discarded packets |
| A | 0 | 134 | 0 |
| B | 0 | 134 | 0 |
| C | 0 | 134 | 0 |
| D | 0 | 134 | 0 |
| Mode M9 | |||
|---|---|---|---|
| Quadrant | BADHDUFLAG | Total packets | Discarded packets |
| A | 0 | 18 | 0 |
| B | 0 | 19 | 0 |
| C | 0 | 19 | 0 |
| D | 0 | 19 | 0 |
| Quadrant | Total seconds | Saturated seconds | Saturation percentage |
|---|---|---|---|
| A | 6542 | 21 | 0.321003% |
| B | 6542 | 29 | 0.443290% |
| C | 6542 | 139 | 2.124732% |
| D | 6542 | 217 | 3.317028% |
Noise dominated data is calculated using 1-second bins in cleaned event files. If a bin has >2000 counts, and if more than 50% of those come from <1% of pixels, then it is considered to be noise-dominated and hence unusable.
| Quadrant | # 1 sec bins | Bins with >0 counts | Bins with >2000 counts | High rate bins dominated by noise | Noise dominated (total time) | Noise dominated (detector-on time) | Marked lightcurve |
|---|---|---|---|---|---|---|---|
| A | 7832 | 6543 | 4 | 4 | 0.05% | 0.06% | 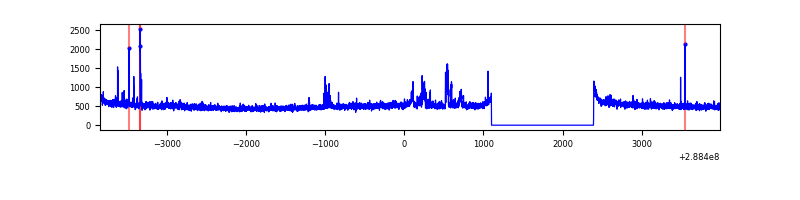 |
| B | 7832 | 6543 | 5 | 5 | 0.06% | 0.08% | 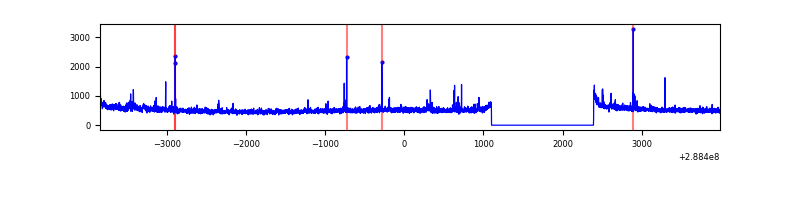 |
| C | 7832 | 6543 | 56 | 56 | 0.72% | 0.86% | 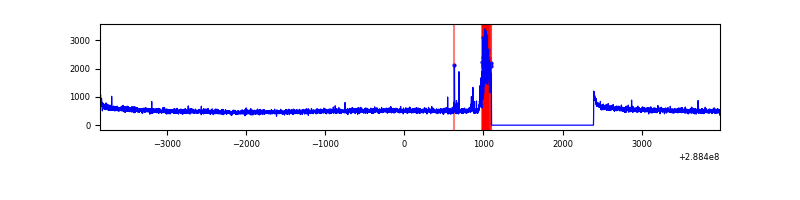 |
| D | 7832 | 6543 | 157 | 157 | 2.00% | 2.40% | 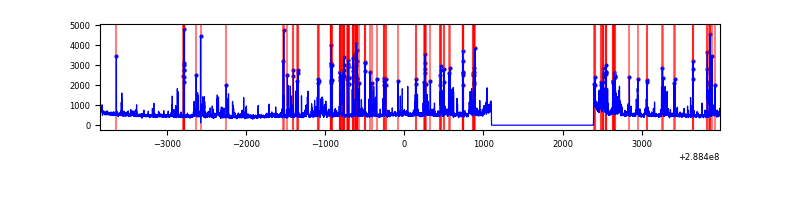 |
Top three noisy pixels from each quadrant. If the there are fewer than three noisy pixels in the level2.evt file, extra rows are filled as -1
| Pixel properties | Quadrant properties | ||||||
|---|---|---|---|---|---|---|---|
| Quadrant | DetID | PixID | Counts | Sigma | Mean | Median | Sigma |
| A | 15 | 174 | 112810 | 658.76 | 848 | 832 | 170.0 |
| A | 4 | 2 | 16390 | 91.53 | 848 | 832 | 170.0 |
| A | 8 | 34 | 10527 | 57.04 | 848 | 832 | 170.0 |
| B | 0 | 197 | 24776 | 147.04 | 860 | 840 | 162.8 |
| B | 4 | 173 | 22033 | 130.19 | 860 | 840 | 162.8 |
| B | 12 | 111 | 18253 | 106.97 | 860 | 840 | 162.8 |
| C | 0 | 207 | 235833 | 1246.54 | 814 | 822 | 188.5 |
| C | 14 | 238 | 127496 | 671.9 | 814 | 822 | 188.5 |
| C | 3 | 233 | 11334 | 55.76 | 814 | 822 | 188.5 |
| D | 1 | 52 | 933987 | 4755.05 | 811 | 791 | 196.3 |
| D | 10 | 70 | 64050 | 322.33 | 811 | 791 | 196.3 |
| D | 14 | 34 | 43409 | 217.16 | 811 | 791 | 196.3 |
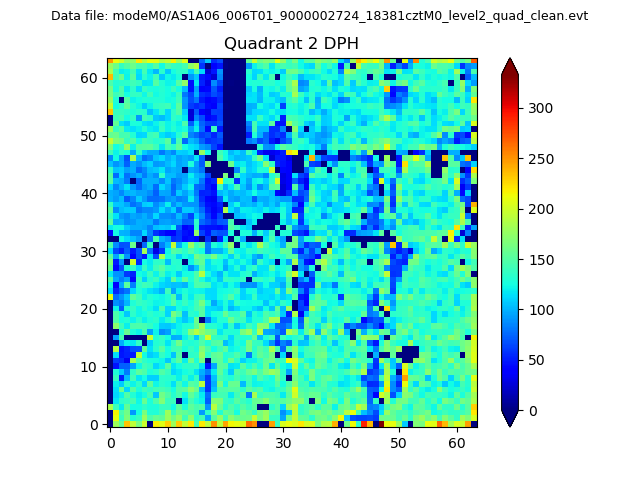
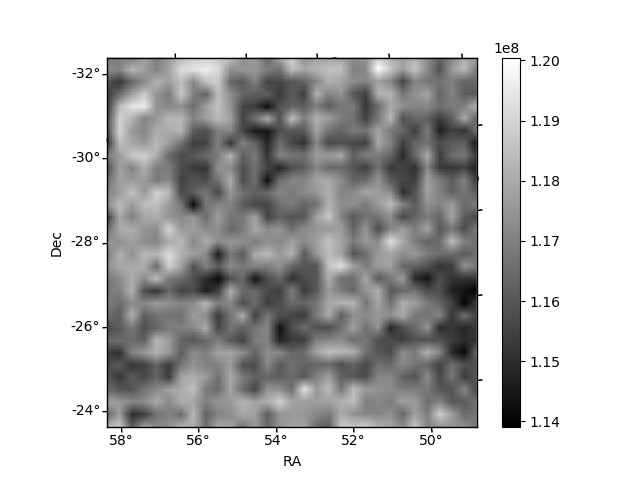
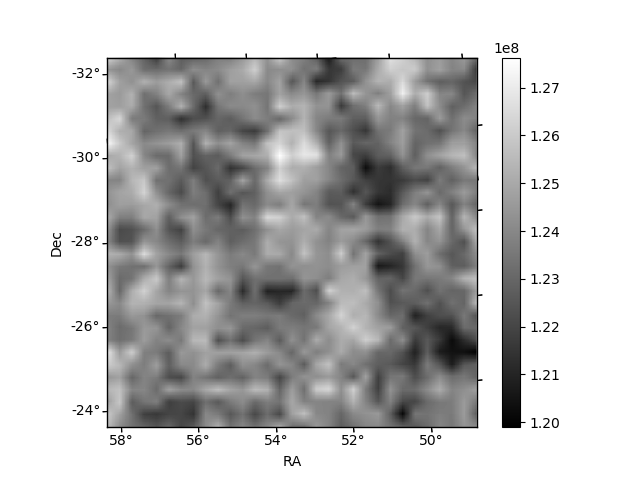
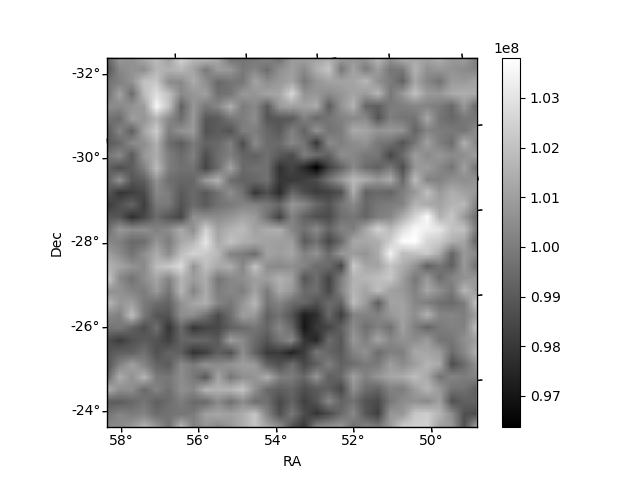
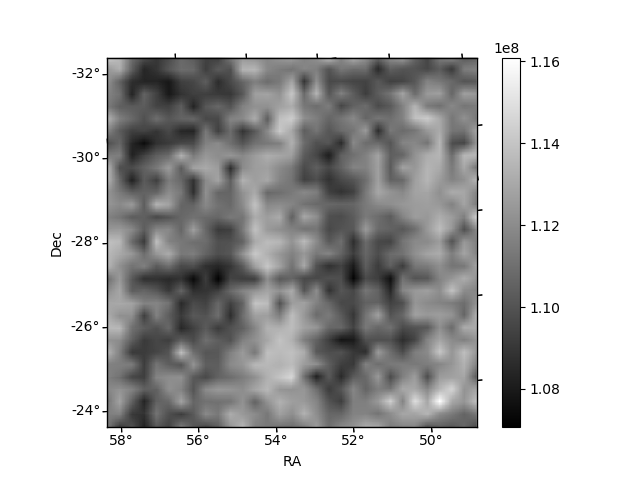
Histogram calculated using DETX and DETY for each event in the final _common_clean file
| Quadrant A | 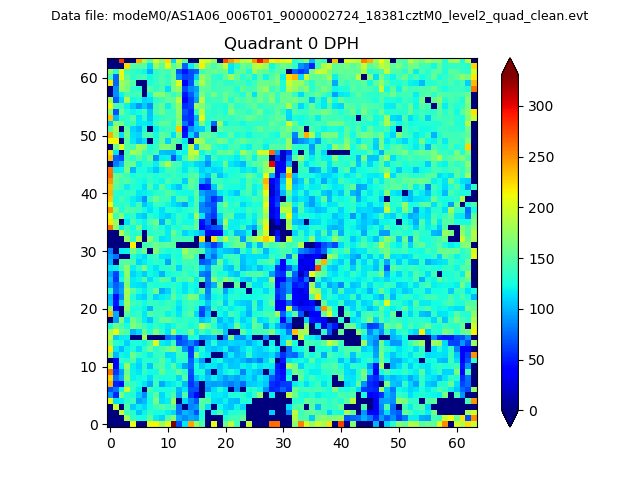 |
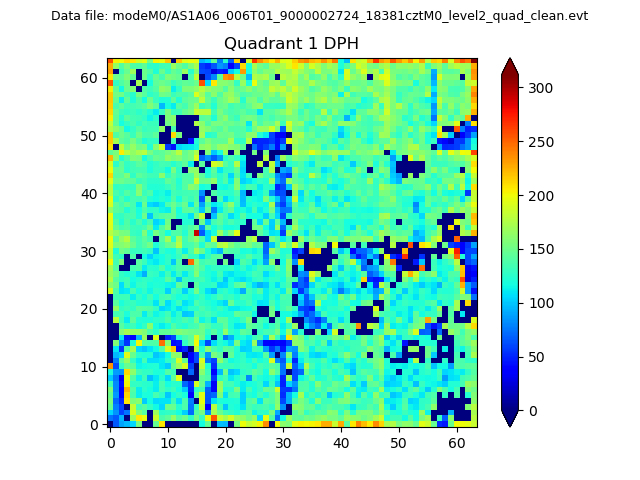 |
Quadrant B |
|---|---|---|---|
| Quadrant D | 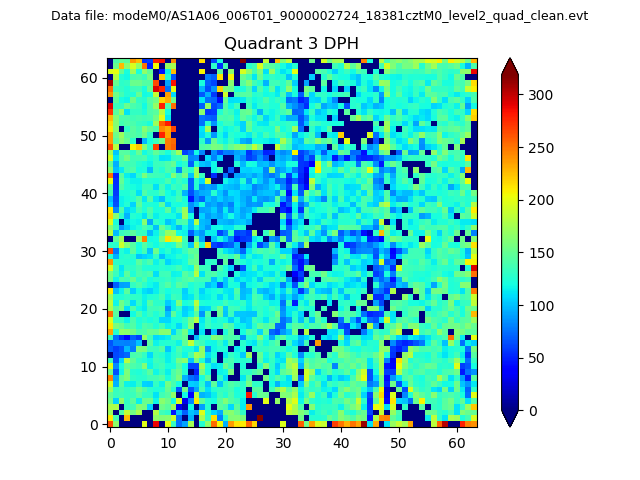 |
 |
Quadrant C |
| Plot type | Count rate plots | Images |
|---|---|---|
| Comparison with Poisson distribution Blue bars denote a histogram of data divided into 1 sec bins. Red curve is a Poisson curve with rate = median count rate of data. |
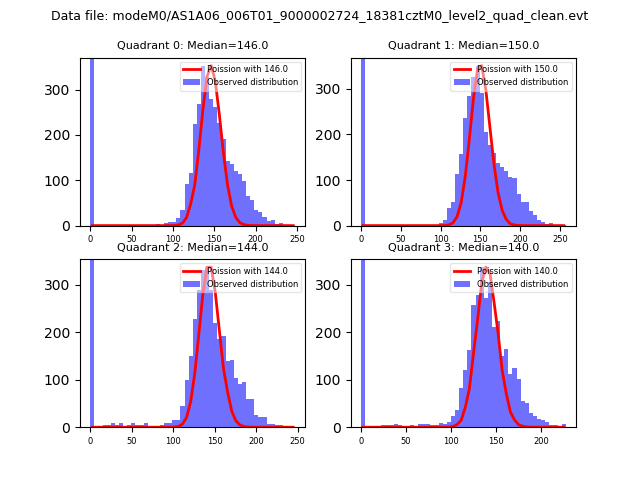 |
 |
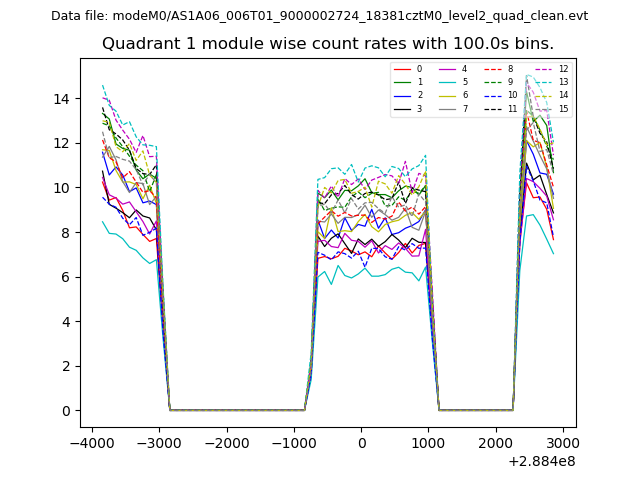
| Quadrant-wise count rates Data is divided into 100 sec bins |
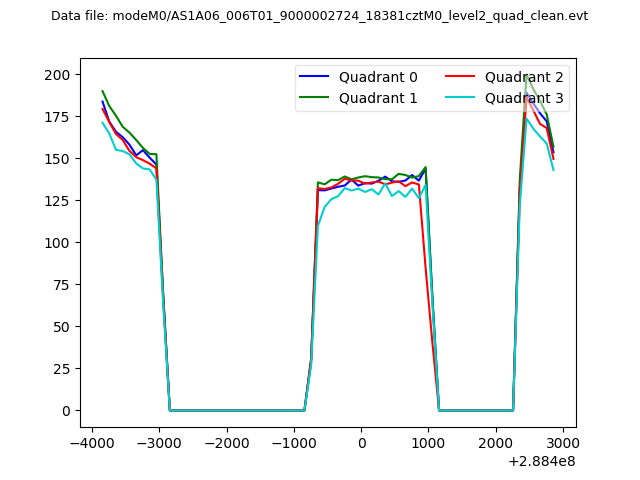 |
|
| Module-wise count rates for Quadrant A Data is divided into 100 sec bins |
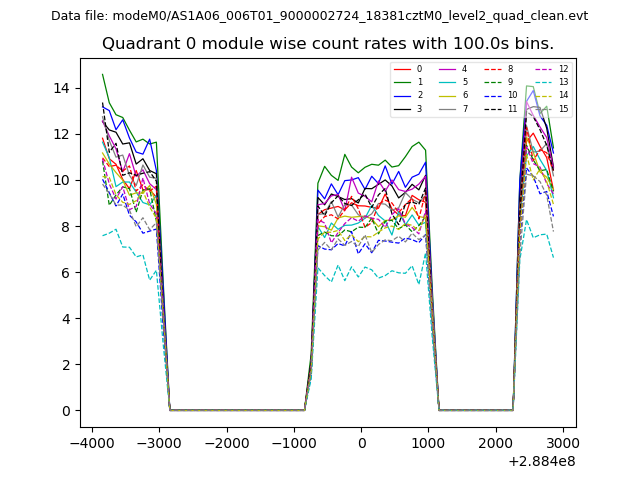 |
 |
| Module-wise count rates for Quadrant B Data is divided into 100 sec bins |
 |
 |
| Module-wise count rates for Quadrant C Data is divided into 100 sec bins |
 |
 |
| Module-wise count rates for Quadrant D Data is divided into 100 sec bins |
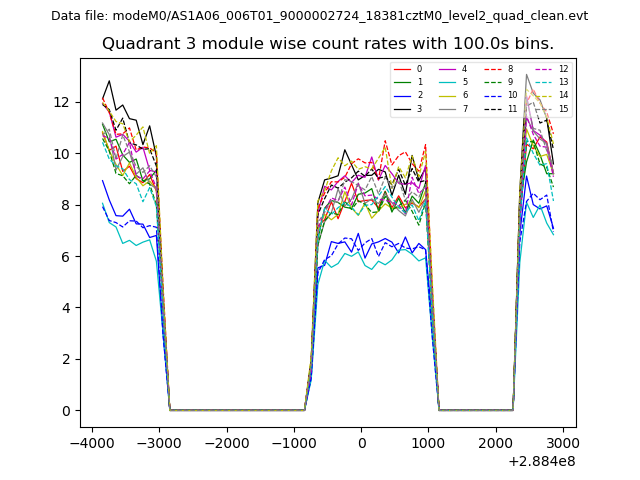 |
 |
| Parameter | Plot |
|---|---|
| CZT HV Monitor | 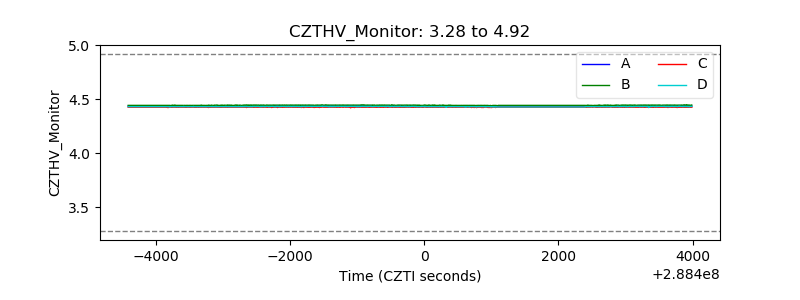 |
| D_VDD | 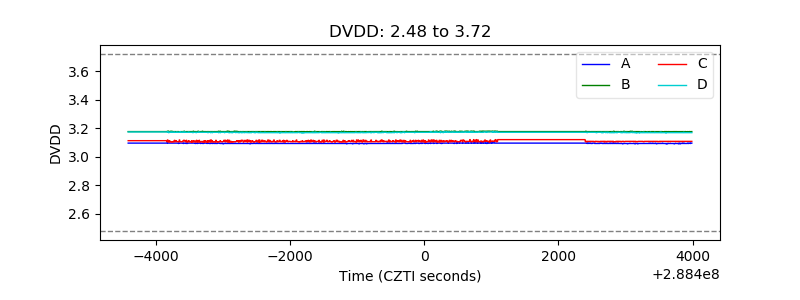 |
| Temperature 1 | 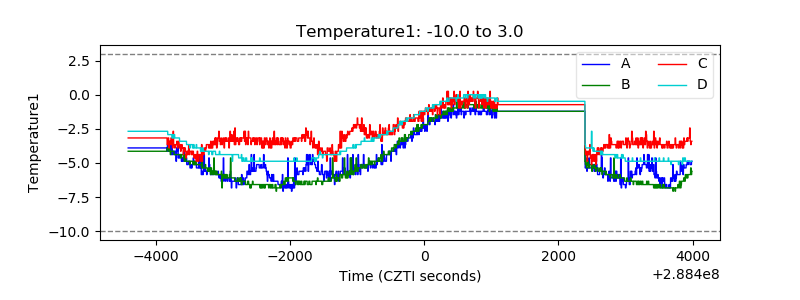 |
| Veto HV Monitor | 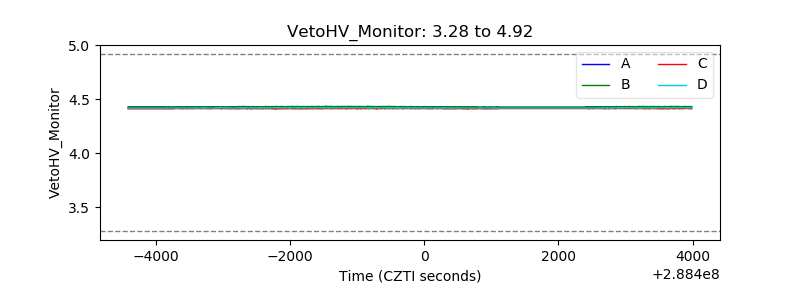 |
| Veto LLD | 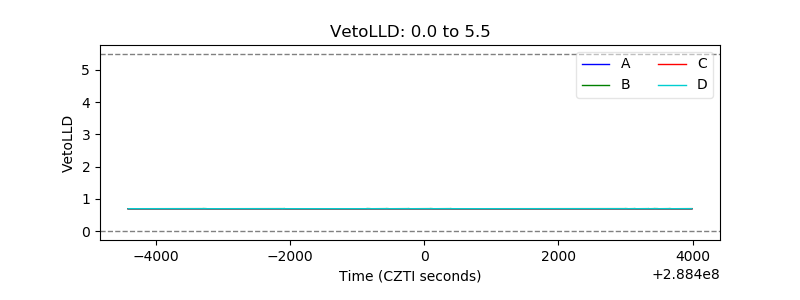 |
| Alpha Counter | 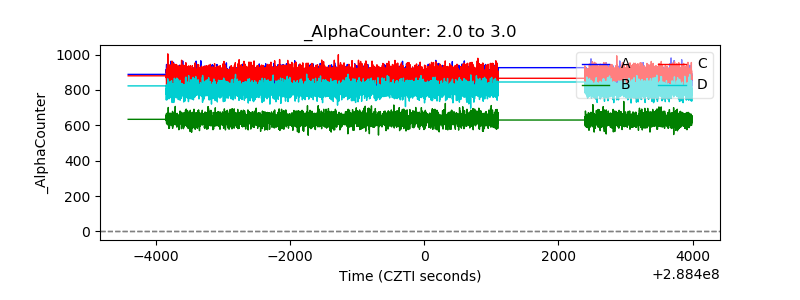 |
| _CPM_Rate | 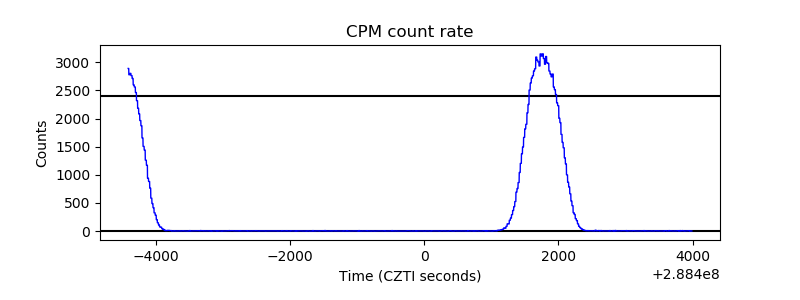 |
| CZT Counter |  |
| +2.5 Volts monitor |  |
| +5 Volts monitor | 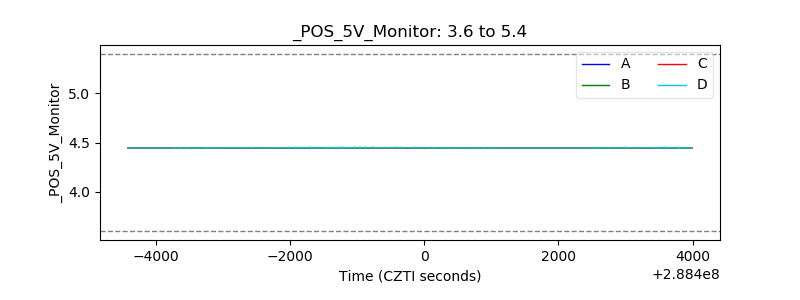 |
| _ROLL_ROT | 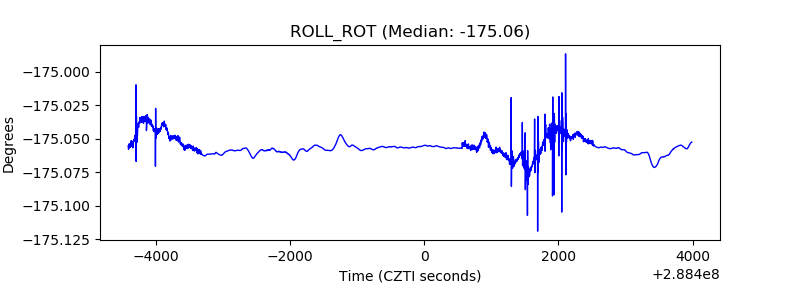 |
| _Roll_DEC | 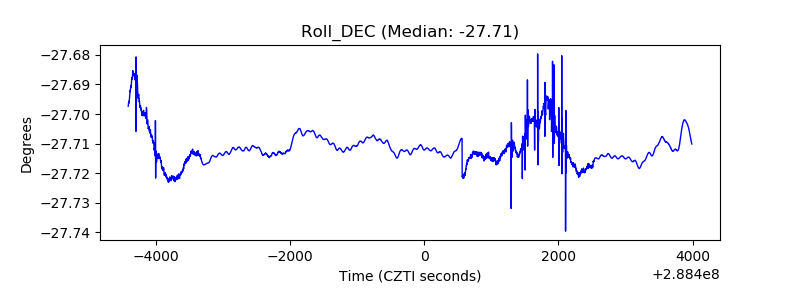 |
| _Roll_RA | 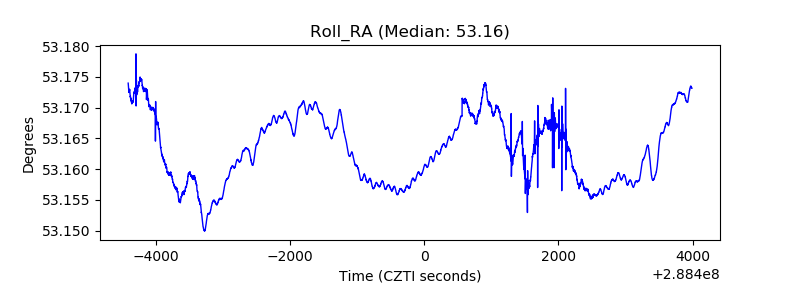 |
| Veto Counter | 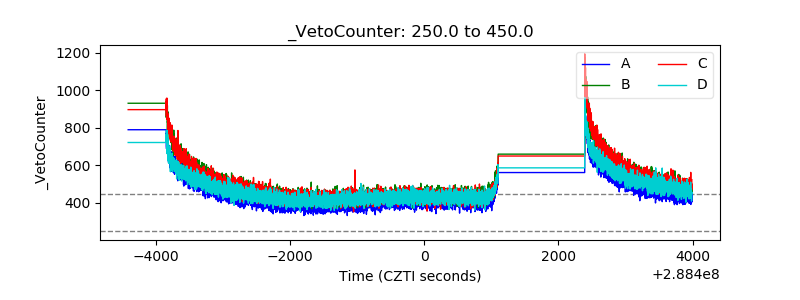 |