| Param | Original file | Final file |
|---|---|---|
| Filename | modeM0/AS1A06_006T01_9000002724_18382cztM0_level2.evt | modeM0/AS1A06_006T01_9000002724_18382cztM0_level2_quad_clean.evt |
| Size (bytes) | 504,204,480 | 71,101,440 |
| Size | 480.8 MB | 67.8 MB |
| Events in quadrant A | 3,378,561 | 430,897 |
| Events in quadrant B | 3,493,082 | 443,445 |
| Events in quadrant C | 3,473,365 | 425,514 |
| Events in quadrant D | 4,490,911 | 406,446 |
| Mode M0 | |||
|---|---|---|---|
| Quadrant | BADHDUFLAG | Total packets | Discarded packets |
| A | 0 | 13711 | 2 |
| B | 0 | 14137 | 2 |
| C | 0 | 13959 | 2 |
| D | 0 | 17452 | 2 |
| Mode SS | |||
|---|---|---|---|
| Quadrant | BADHDUFLAG | Total packets | Discarded packets |
| A | 0 | 130 | 0 |
| B | 0 | 130 | 0 |
| C | 0 | 130 | 0 |
| D | 0 | 130 | 0 |
| Mode M9 | |||
|---|---|---|---|
| Quadrant | BADHDUFLAG | Total packets | Discarded packets |
| A | 0 | 16 | 0 |
| B | 0 | 17 | 0 |
| C | 0 | 17 | 0 |
| D | 0 | 17 | 0 |
| Quadrant | Total seconds | Saturated seconds | Saturation percentage |
|---|---|---|---|
| A | 6399 | 50 | 0.781372% |
| B | 6399 | 59 | 0.922019% |
| C | 6399 | 95 | 1.484607% |
| D | 6399 | 196 | 3.062979% |
Noise dominated data is calculated using 1-second bins in cleaned event files. If a bin has >2000 counts, and if more than 50% of those come from <1% of pixels, then it is considered to be noise-dominated and hence unusable.
| Quadrant | # 1 sec bins | Bins with >0 counts | Bins with >2000 counts | High rate bins dominated by noise | Noise dominated (total time) | Noise dominated (detector-on time) | Marked lightcurve |
|---|---|---|---|---|---|---|---|
| A | 7714 | 6400 | 17 | 17 | 0.22% | 0.27% | 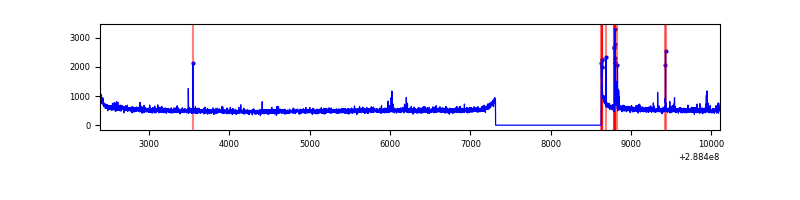 |
| B | 7714 | 6400 | 2 | 2 | 0.03% | 0.03% | 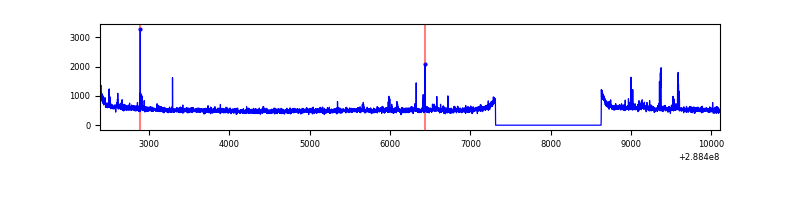 |
| C | 7714 | 6400 | 2 | 2 | 0.03% | 0.03% | 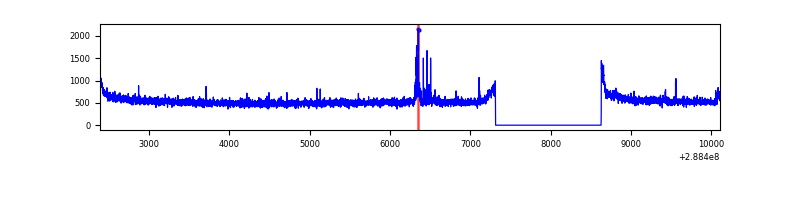 |
| D | 7714 | 6400 | 147 | 147 | 1.91% | 2.30% | 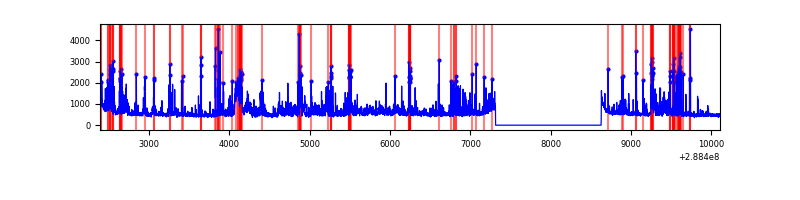 |
Top three noisy pixels from each quadrant. If the there are fewer than three noisy pixels in the level2.evt file, extra rows are filled as -1
| Pixel properties | Quadrant properties | ||||||
|---|---|---|---|---|---|---|---|
| Quadrant | DetID | PixID | Counts | Sigma | Mean | Median | Sigma |
| A | 4 | 2 | 56969 | 329.77 | 857 | 843 | 170.2 |
| A | 0 | 8 | 16622 | 92.71 | 857 | 843 | 170.2 |
| A | 15 | 174 | 8073 | 42.48 | 857 | 843 | 170.2 |
| B | 3 | 64 | 56323 | 339.5 | 870 | 851 | 163.4 |
| B | 12 | 111 | 18389 | 107.34 | 870 | 851 | 163.4 |
| B | 11 | 111 | 15139 | 87.44 | 870 | 851 | 163.4 |
| C | 14 | 238 | 130656 | 675.63 | 833 | 842 | 192.1 |
| C | 0 | 207 | 52808 | 270.46 | 833 | 842 | 192.1 |
| C | 3 | 233 | 45401 | 231.91 | 833 | 842 | 192.1 |
| D | 1 | 52 | 869033 | 4340.74 | 827 | 807 | 200.0 |
| D | 10 | 70 | 268501 | 1338.35 | 827 | 807 | 200.0 |
| D | 14 | 34 | 95628 | 474.06 | 827 | 807 | 200.0 |
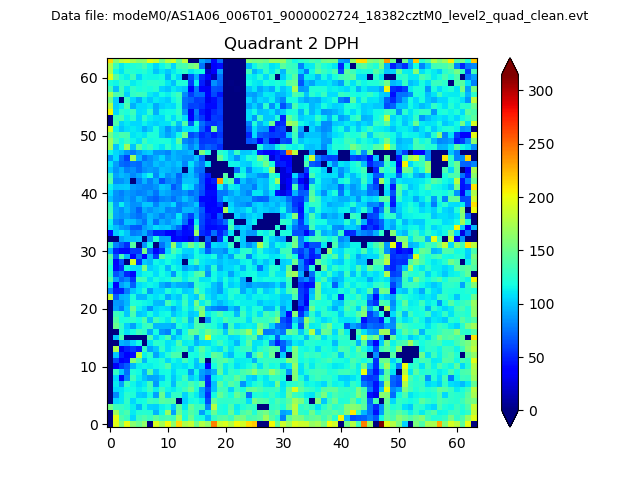
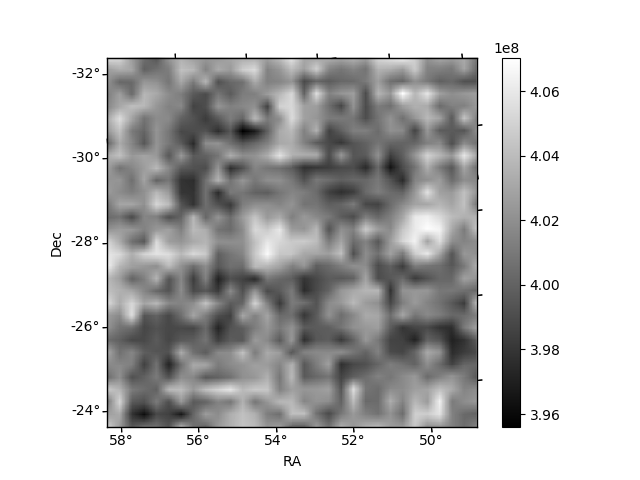
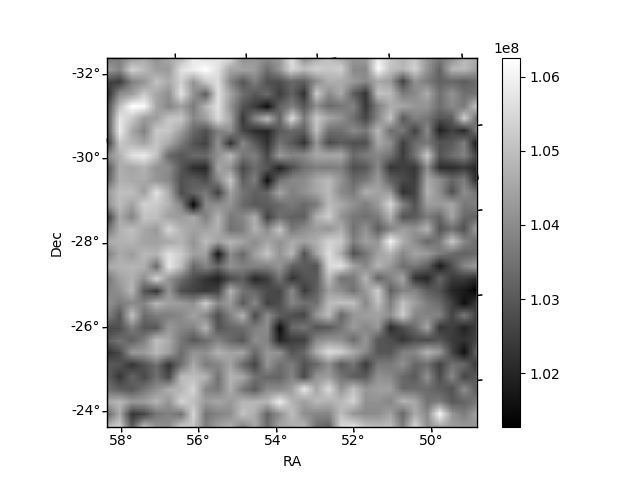
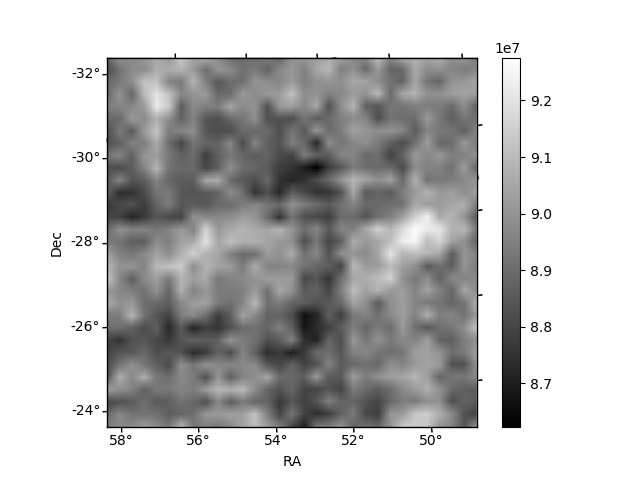
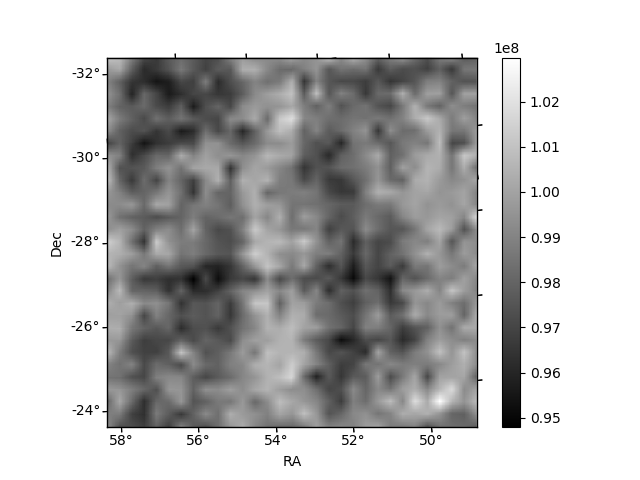
Histogram calculated using DETX and DETY for each event in the final _common_clean file
| Quadrant A | 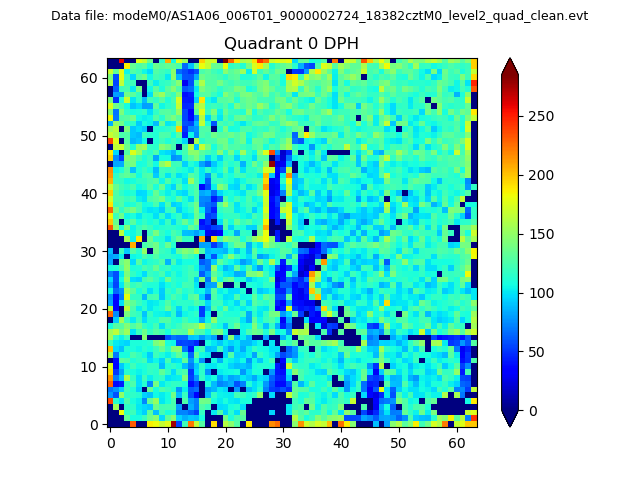 |
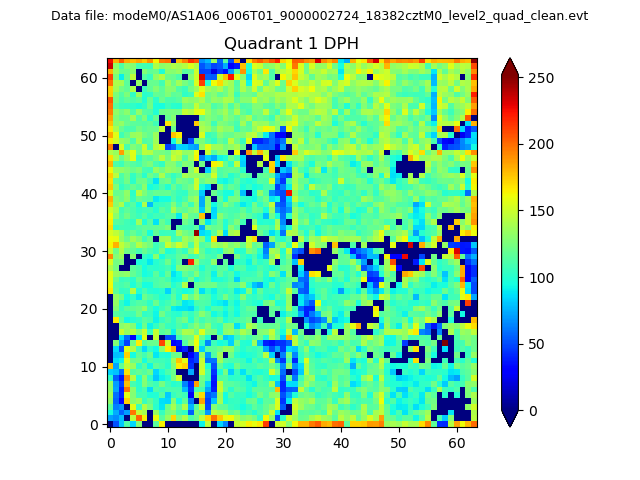 |
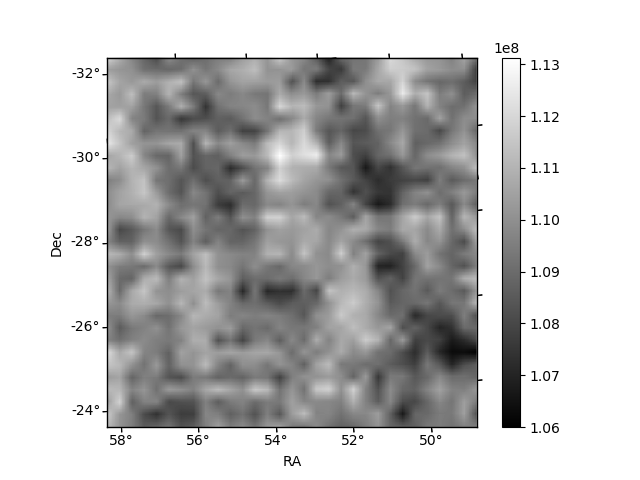
Quadrant B |
|---|---|---|---|
| Quadrant D | 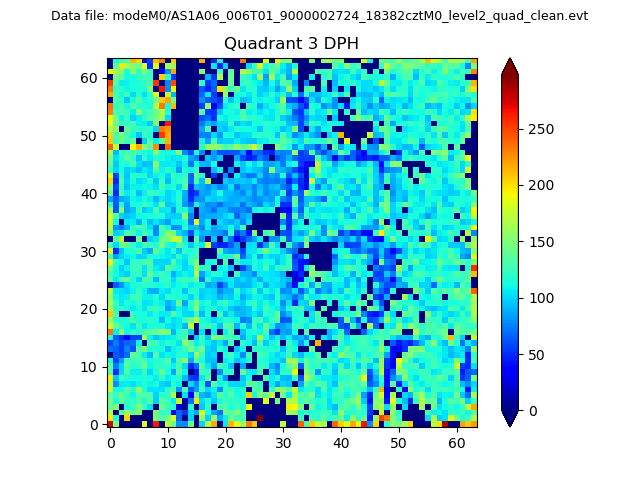 |
 |
Quadrant C |
| Plot type | Count rate plots | Images |
|---|---|---|
| Comparison with Poisson distribution Blue bars denote a histogram of data divided into 1 sec bins. Red curve is a Poisson curve with rate = median count rate of data. |
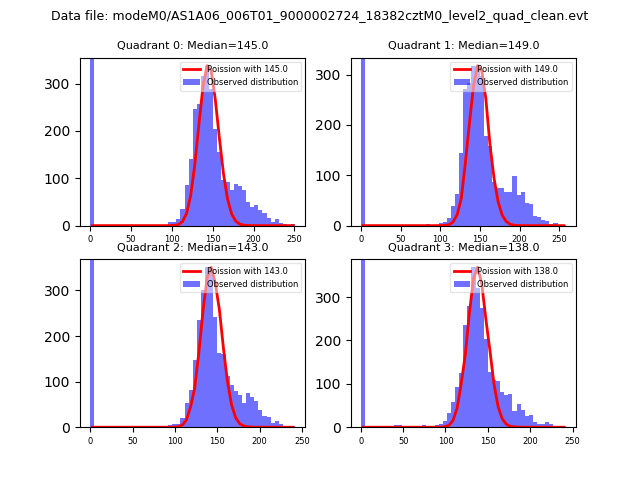 |
 |
| Quadrant-wise count rates Data is divided into 100 sec bins |
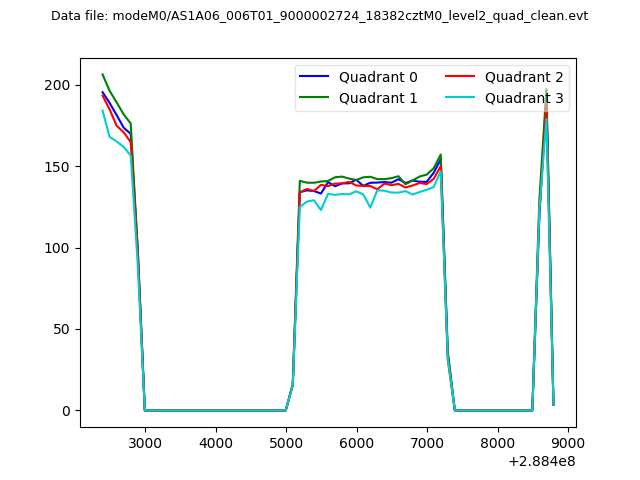 |
|
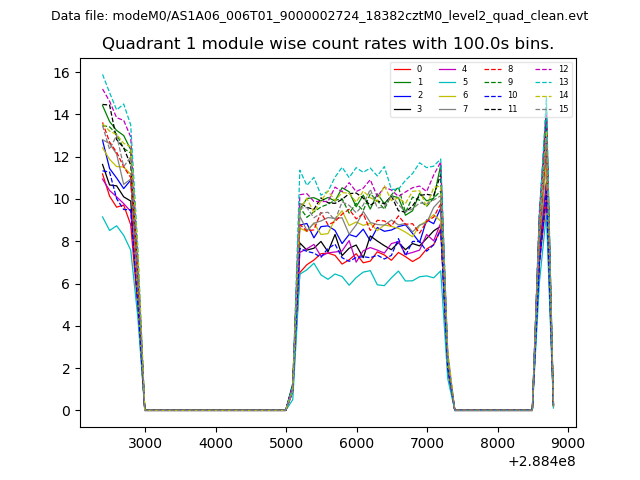
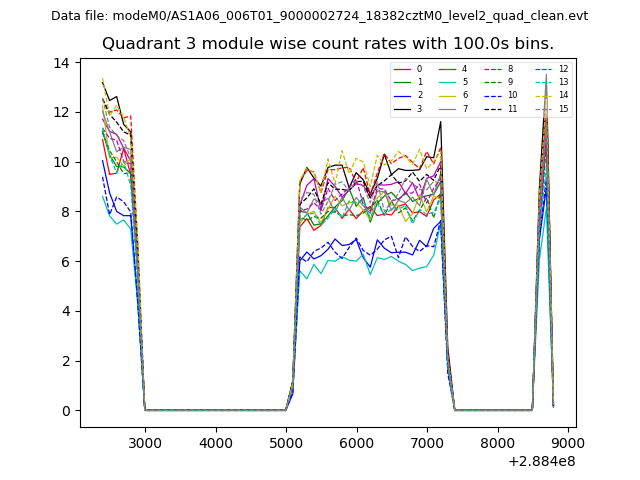
| Module-wise count rates for Quadrant A Data is divided into 100 sec bins |
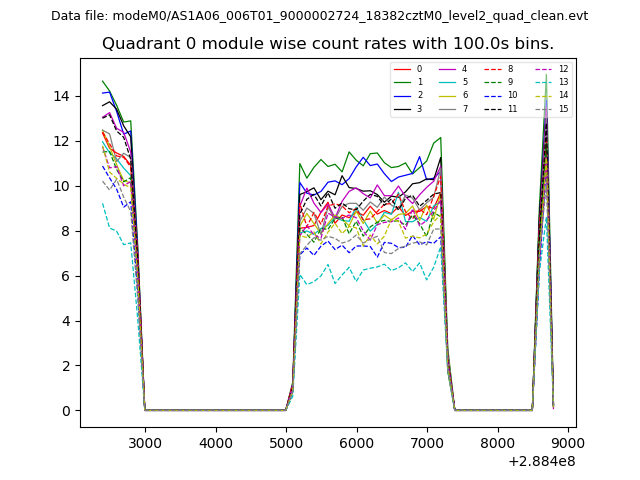 |
 |
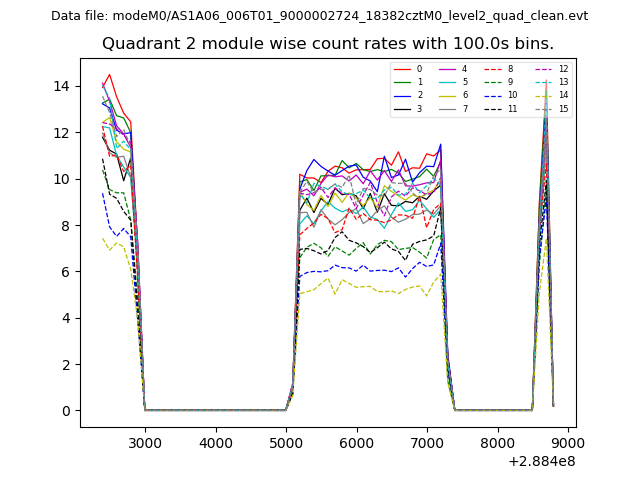
| Module-wise count rates for Quadrant B Data is divided into 100 sec bins |
 |
 |
| Module-wise count rates for Quadrant C Data is divided into 100 sec bins |
 |
 |
| Module-wise count rates for Quadrant D Data is divided into 100 sec bins |
 |
 |
| Parameter | Plot |
|---|---|
| CZT HV Monitor | 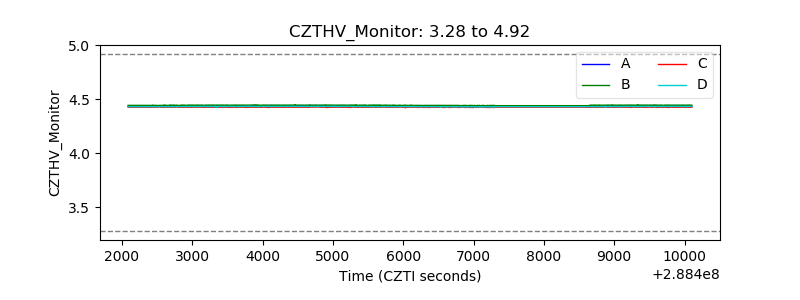 |
| D_VDD | 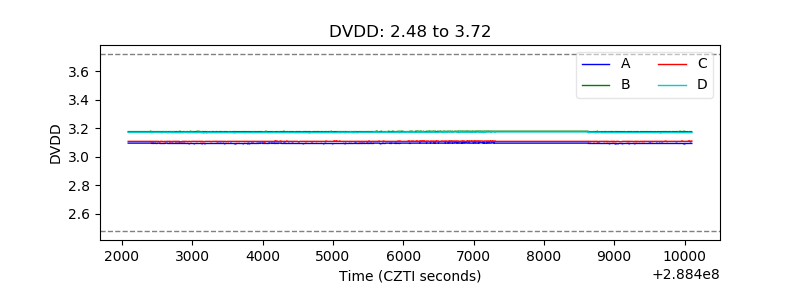 |
| Temperature 1 | 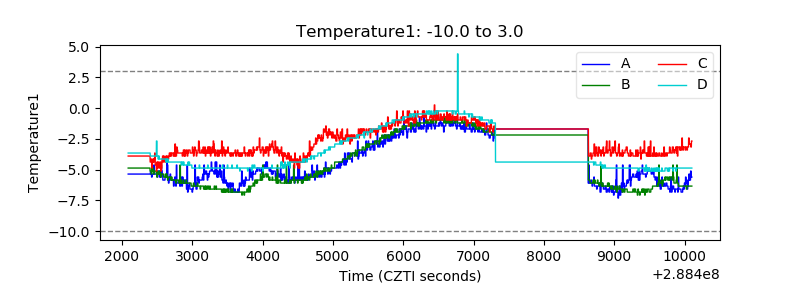 |
| Veto HV Monitor | 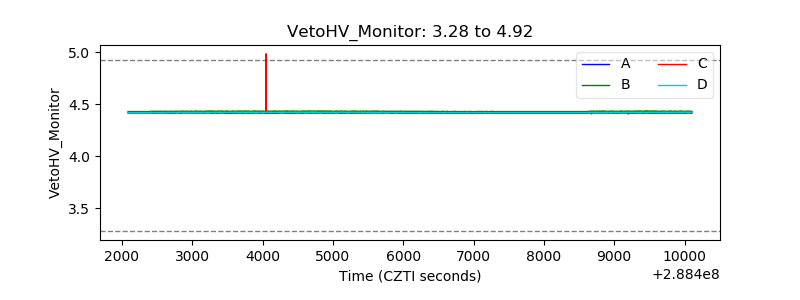 |
| Veto LLD | 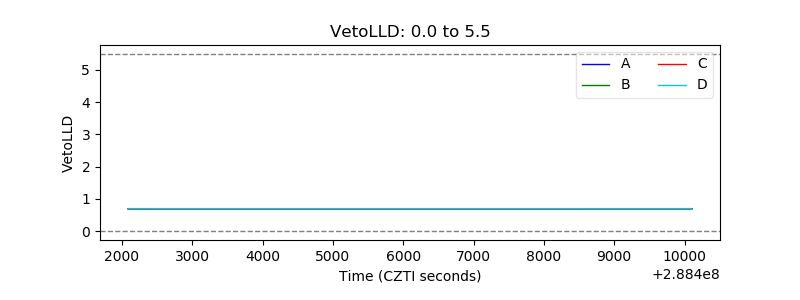 |
| Alpha Counter | 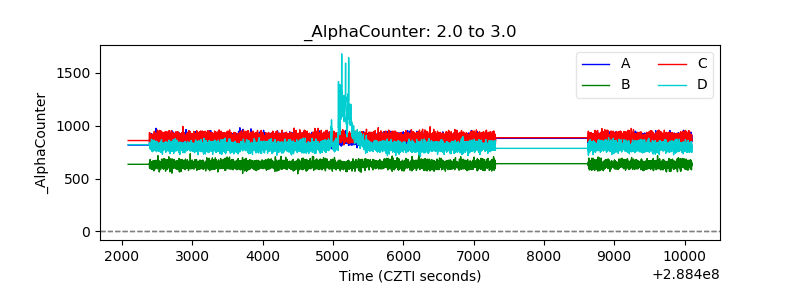 |
| _CPM_Rate | 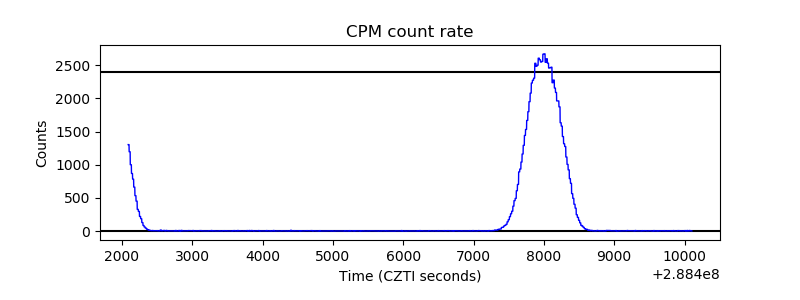 |
| CZT Counter | 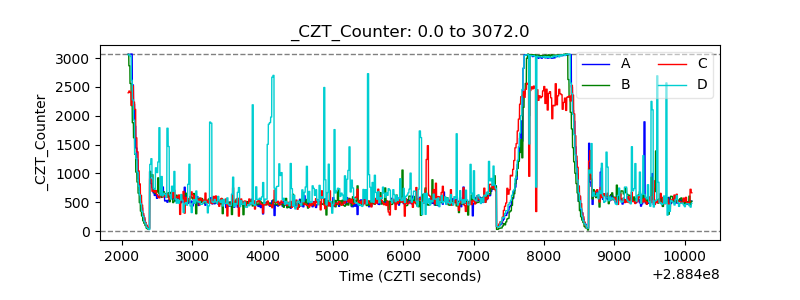 |
| +2.5 Volts monitor |  |
| +5 Volts monitor |  |
| _ROLL_ROT | 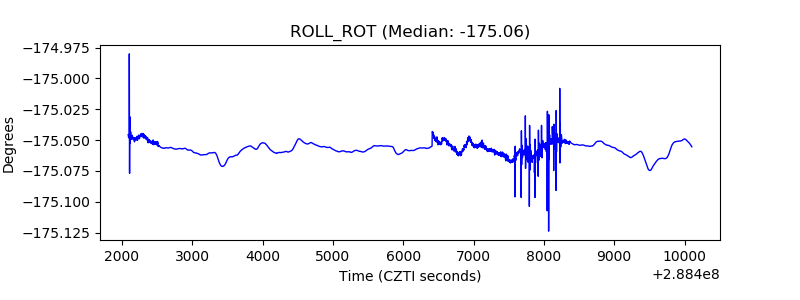 |
| _Roll_DEC | 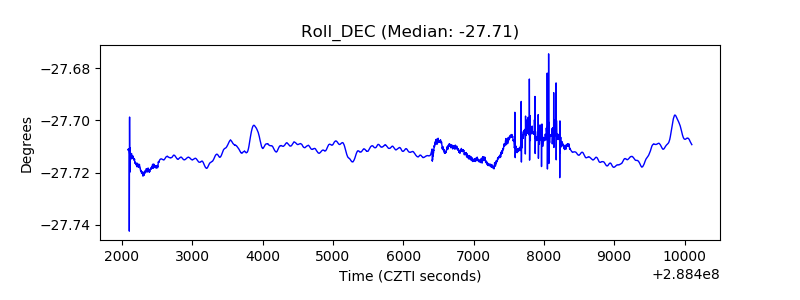 |
| _Roll_RA | 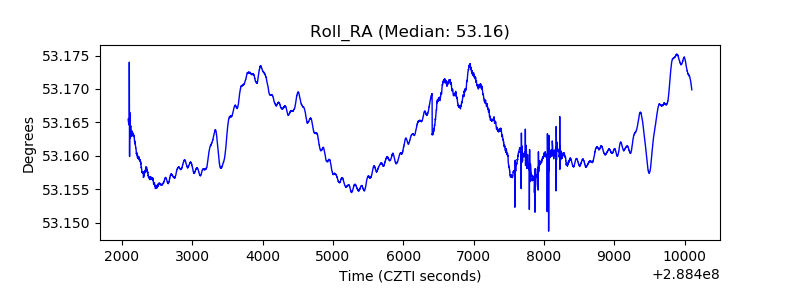 |
| Veto Counter | 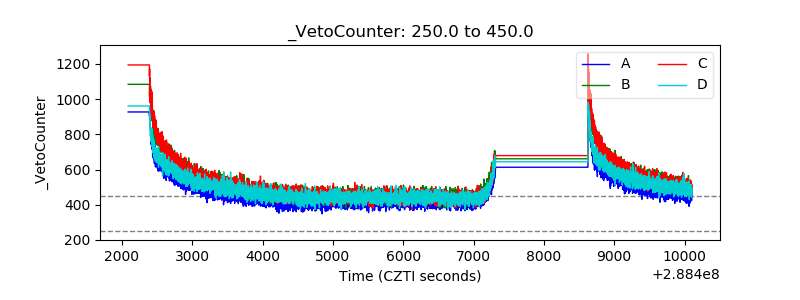 |