| Param | Original file | Final file |
|---|---|---|
| Filename | modeM0/AS1A06_006T01_9000002724_18383cztM0_level2.evt | modeM0/AS1A06_006T01_9000002724_18383cztM0_level2_quad_clean.evt |
| Size (bytes) | 425,787,840 | 59,587,200 |
| Size | 406.1 MB | 56.8 MB |
| Events in quadrant A | 2,963,169 | 355,042 |
| Events in quadrant B | 3,063,777 | 360,455 |
| Events in quadrant C | 3,124,046 | 350,094 |
| Events in quadrant D | 3,356,848 | 339,827 |
| Mode M0 | |||
|---|---|---|---|
| Quadrant | BADHDUFLAG | Total packets | Discarded packets |
| A | 0 | 11993 | 1 |
| B | 0 | 12281 | 1 |
| C | 0 | 12435 | 1 |
| D | 0 | 13506 | 1 |
| Mode SS | |||
|---|---|---|---|
| Quadrant | BADHDUFLAG | Total packets | Discarded packets |
| A | 0 | 114 | 0 |
| B | 0 | 114 | 0 |
| C | 0 | 114 | 0 |
| D | 0 | 114 | 0 |
| Mode M9 | |||
|---|---|---|---|
| Quadrant | BADHDUFLAG | Total packets | Discarded packets |
| A | 0 | 14 | 0 |
| B | 0 | 14 | 0 |
| C | 0 | 14 | 0 |
| D | 0 | 14 | 0 |
| Quadrant | Total seconds | Saturated seconds | Saturation percentage |
|---|---|---|---|
| A | 5705 | 21 | 0.368098% |
| B | 5706 | 43 | 0.753593% |
| C | 5706 | 79 | 1.384508% |
| D | 5706 | 93 | 1.629863% |
Noise dominated data is calculated using 1-second bins in cleaned event files. If a bin has >2000 counts, and if more than 50% of those come from <1% of pixels, then it is considered to be noise-dominated and hence unusable.
| Quadrant | # 1 sec bins | Bins with >0 counts | Bins with >2000 counts | High rate bins dominated by noise | Noise dominated (total time) | Noise dominated (detector-on time) | Marked lightcurve |
|---|---|---|---|---|---|---|---|
| A | 7055 | 5706 | 3 | 3 | 0.04% | 0.05% | 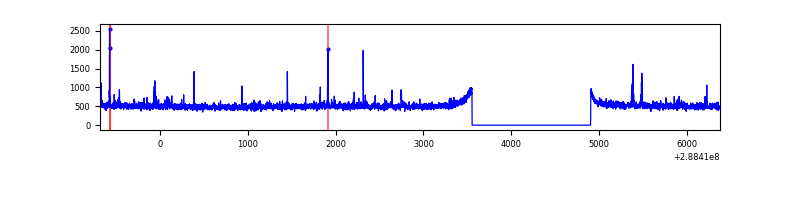 |
| B | 7056 | 5707 | 6 | 6 | 0.09% | 0.11% | 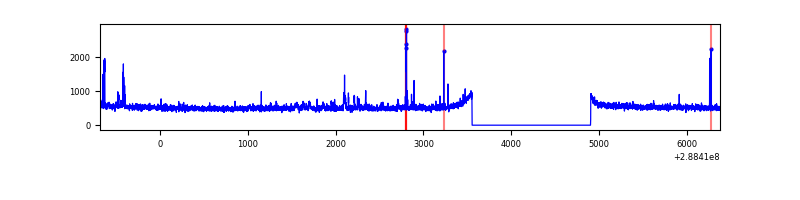 |
| C | 7056 | 5707 | 8 | 8 | 0.11% | 0.14% | 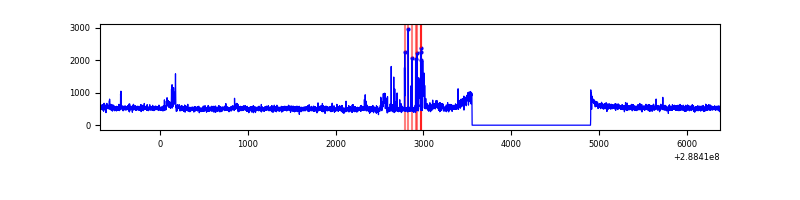 |
| D | 7056 | 5707 | 57 | 57 | 0.81% | 1.00% | 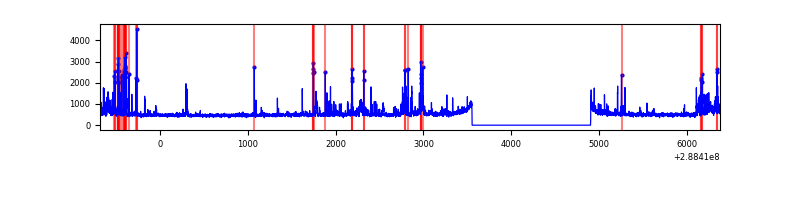 |
Top three noisy pixels from each quadrant. If the there are fewer than three noisy pixels in the level2.evt file, extra rows are filled as -1
| Pixel properties | Quadrant properties | ||||||
|---|---|---|---|---|---|---|---|
| Quadrant | DetID | PixID | Counts | Sigma | Mean | Median | Sigma |
| A | 4 | 2 | 47150 | 310.54 | 750 | 737 | 149.5 |
| A | 0 | 8 | 17092 | 109.43 | 750 | 737 | 149.5 |
| A | 15 | 174 | 12565 | 79.14 | 750 | 737 | 149.5 |
| B | 3 | 64 | 75697 | 526.47 | 756 | 738 | 142.4 |
| B | 10 | 245 | 16353 | 109.67 | 756 | 738 | 142.4 |
| B | 12 | 111 | 16032 | 107.42 | 756 | 738 | 142.4 |
| C | 3 | 233 | 153502 | 908.69 | 726 | 734 | 168.1 |
| C | 14 | 238 | 115507 | 682.69 | 726 | 734 | 168.1 |
| C | 0 | 207 | 25259 | 145.88 | 726 | 734 | 168.1 |
| D | 1 | 52 | 253210 | 1441.57 | 727 | 707 | 175.2 |
| D | 14 | 34 | 162862 | 925.76 | 727 | 707 | 175.2 |
| D | 2 | 33 | 77180 | 436.59 | 727 | 707 | 175.2 |
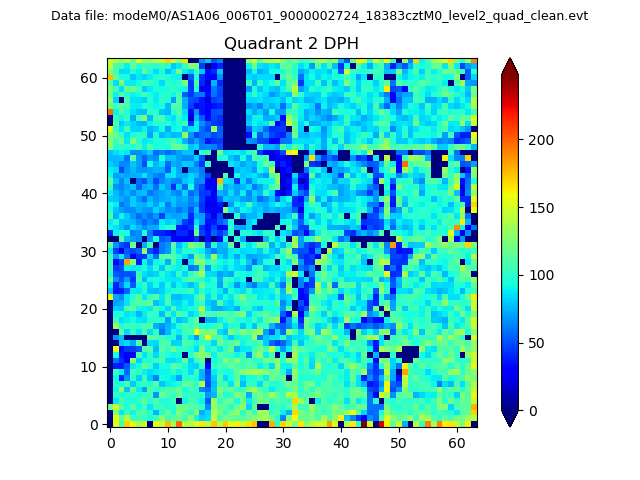
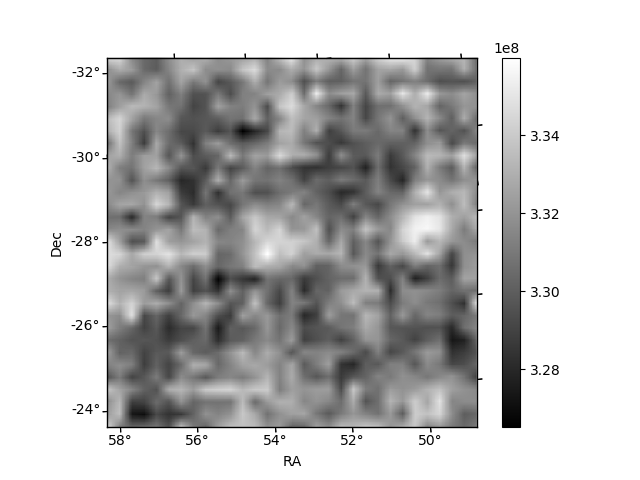
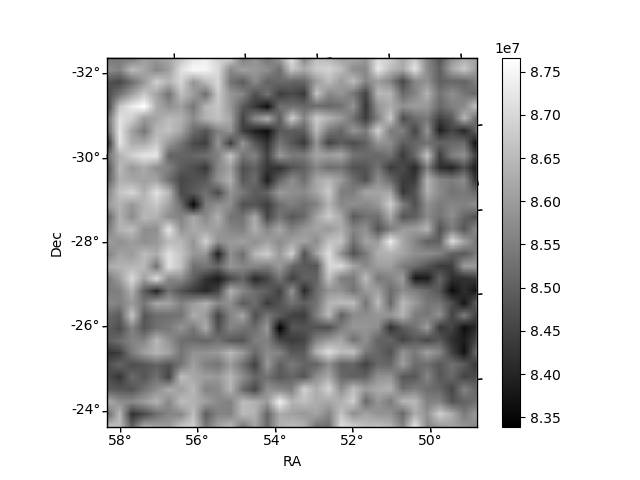
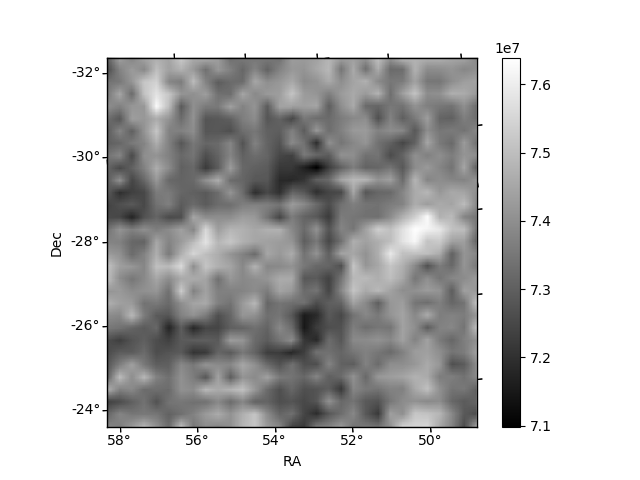
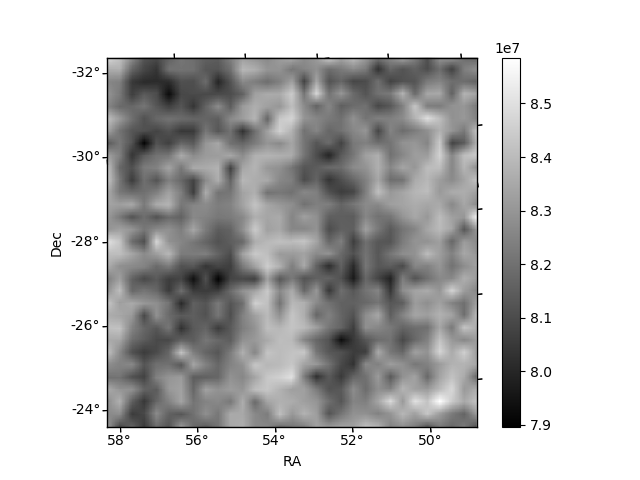
Histogram calculated using DETX and DETY for each event in the final _common_clean file
| Quadrant A | 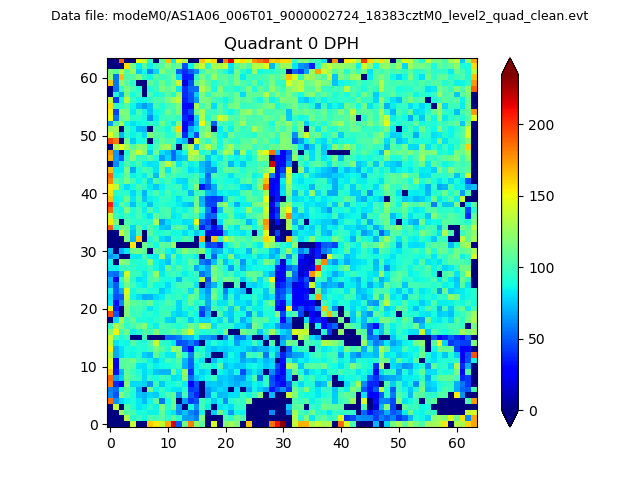 |
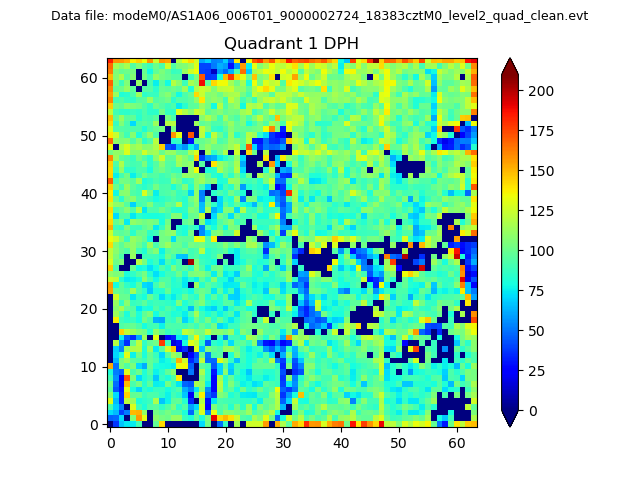 |
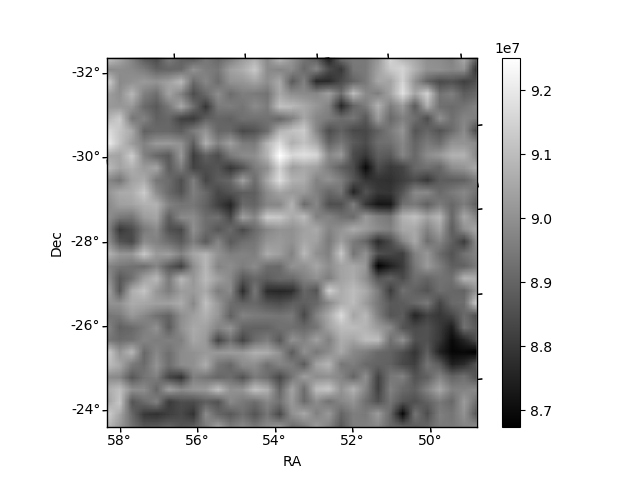
Quadrant B |
|---|---|---|---|
| Quadrant D | 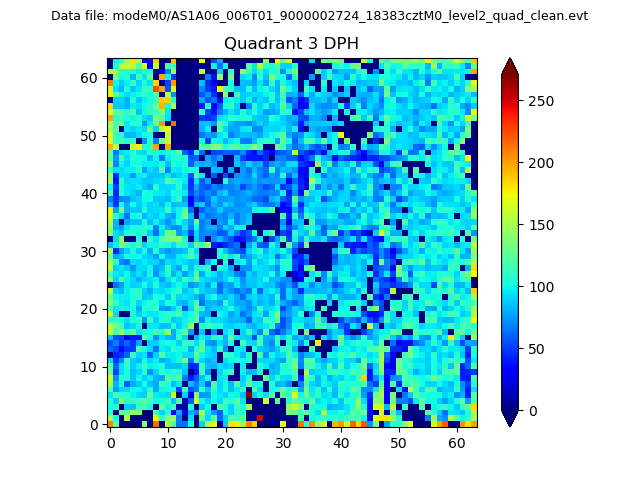 |
 |
Quadrant C |
| Plot type | Count rate plots | Images |
|---|---|---|
| Comparison with Poisson distribution Blue bars denote a histogram of data divided into 1 sec bins. Red curve is a Poisson curve with rate = median count rate of data. |
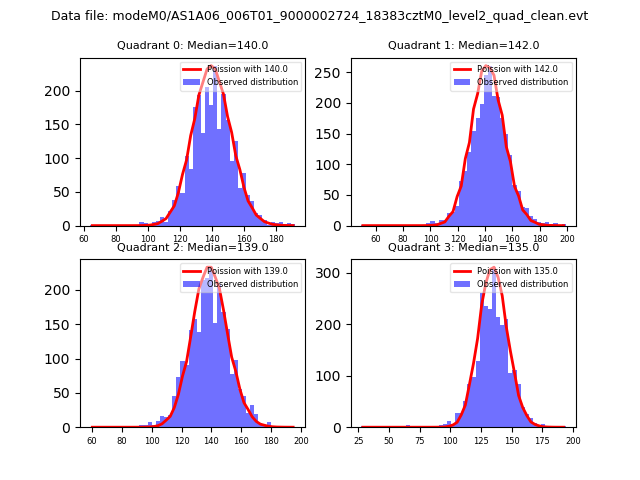 |
 |
| Quadrant-wise count rates Data is divided into 100 sec bins |
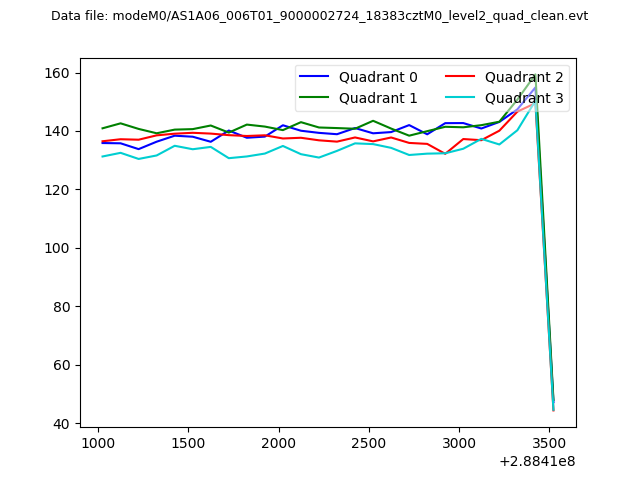 |
|
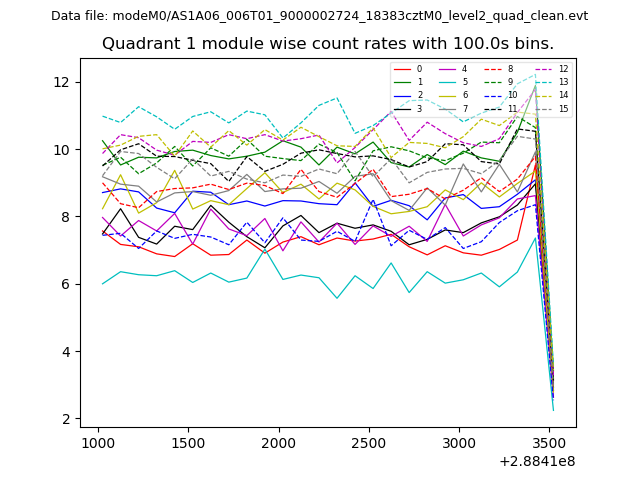
| Module-wise count rates for Quadrant A Data is divided into 100 sec bins |
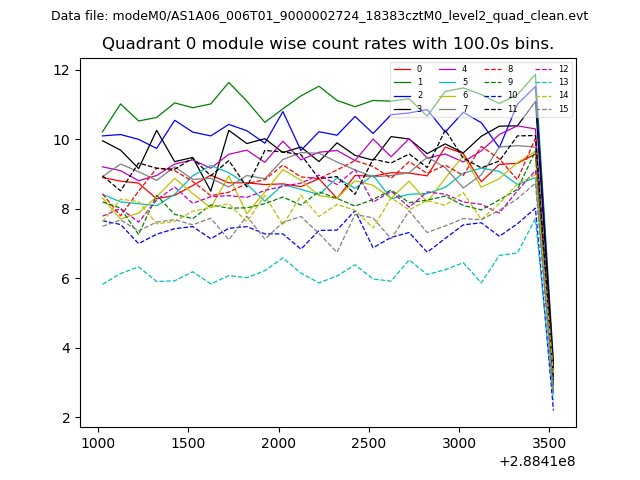 |
 |
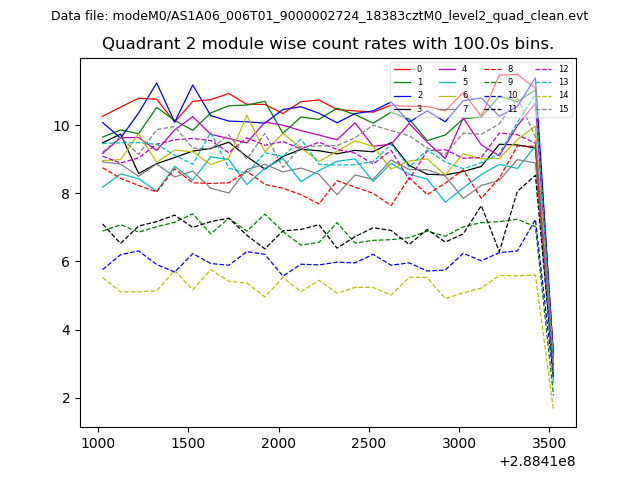
| Module-wise count rates for Quadrant B Data is divided into 100 sec bins |
 |
 |
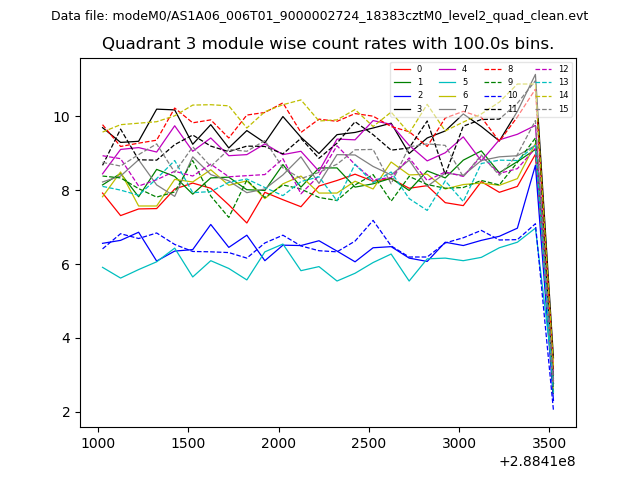
| Module-wise count rates for Quadrant C Data is divided into 100 sec bins |
 |
 |
| Module-wise count rates for Quadrant D Data is divided into 100 sec bins |
 |
 |
| Parameter | Plot |
|---|---|
| CZT HV Monitor | 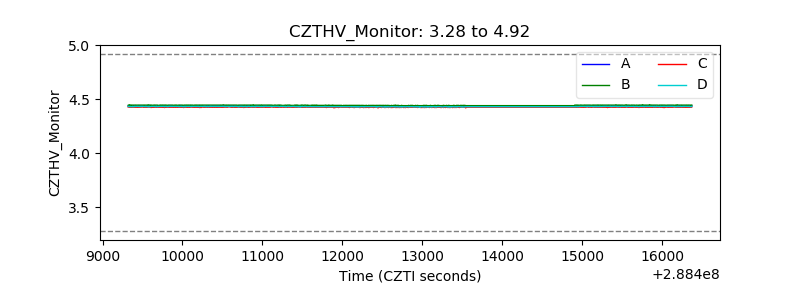 |
| D_VDD | 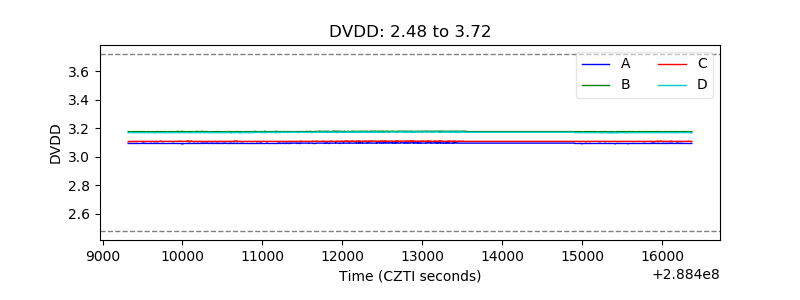 |
| Temperature 1 |  |
| Veto HV Monitor | 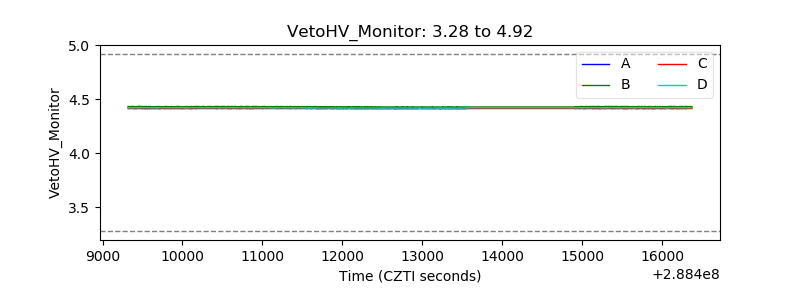 |
| Veto LLD |  |
| Alpha Counter | 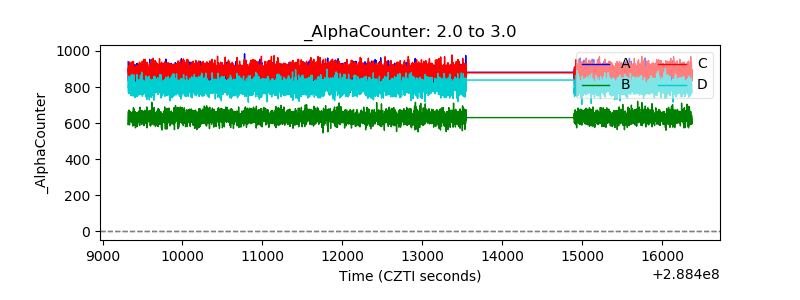 |
| _CPM_Rate | 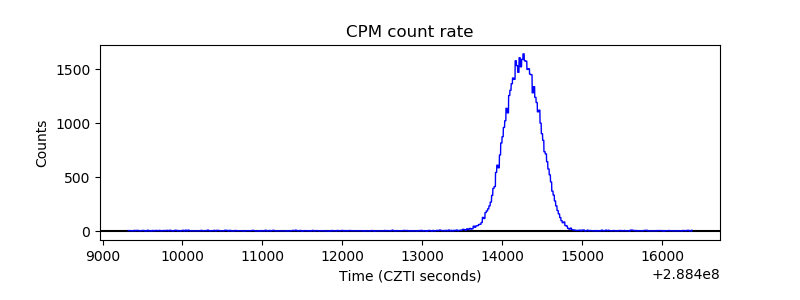 |
| CZT Counter | 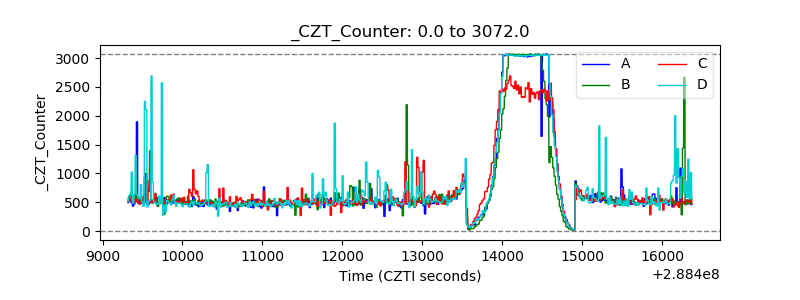 |
| +2.5 Volts monitor | 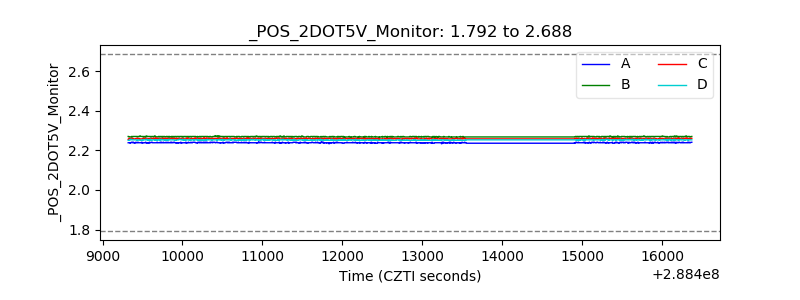 |
| +5 Volts monitor |  |
| _ROLL_ROT | 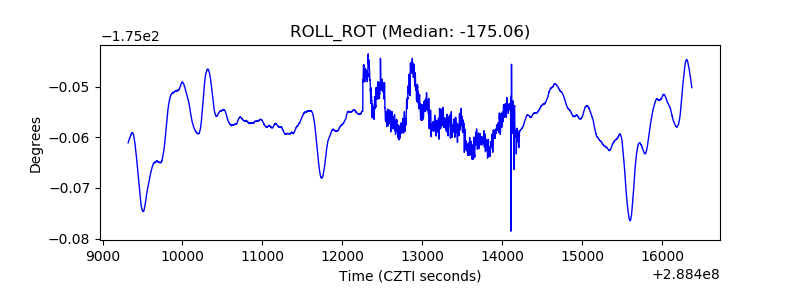 |
| _Roll_DEC | 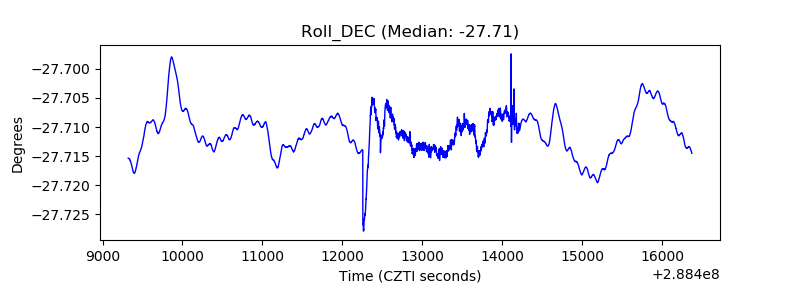 |
| _Roll_RA | 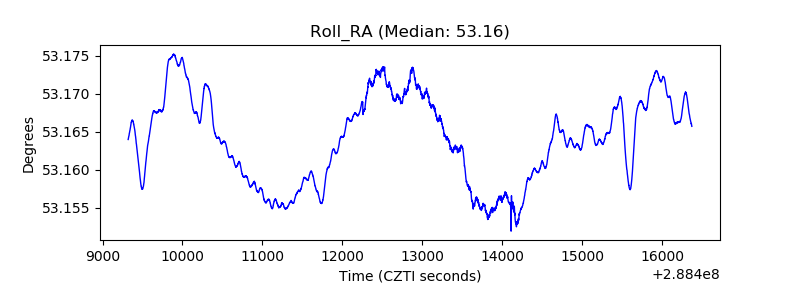 |
| Veto Counter | 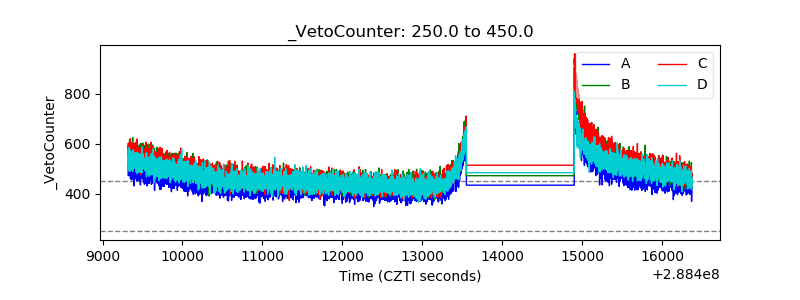 |