| Param | Original file | Final file |
|---|---|---|
| Filename | modeM0/AS1A06_006T01_9000002724_18385cztM0_level2.evt | modeM0/AS1A06_006T01_9000002724_18385cztM0_level2_quad_clean.evt |
| Size (bytes) | 508,204,800 | 79,945,920 |
| Size | 484.7 MB | 76.2 MB |
| Events in quadrant A | 3,361,367 | 493,075 |
| Events in quadrant B | 3,469,969 | 499,840 |
| Events in quadrant C | 3,599,098 | 485,709 |
| Events in quadrant D | 4,502,477 | 471,886 |
| Mode M0 | |||
|---|---|---|---|
| Quadrant | BADHDUFLAG | Total packets | Discarded packets |
| A | 0 | 14123 | 2 |
| B | 0 | 14315 | 2 |
| C | 0 | 14766 | 2 |
| D | 0 | 17708 | 2 |
| Mode SS | |||
|---|---|---|---|
| Quadrant | BADHDUFLAG | Total packets | Discarded packets |
| A | 0 | 136 | 0 |
| B | 0 | 136 | 0 |
| C | 0 | 136 | 0 |
| D | 0 | 136 | 0 |
| Mode M9 | |||
|---|---|---|---|
| Quadrant | BADHDUFLAG | Total packets | Discarded packets |
| A | 0 | 13 | 0 |
| B | 0 | 14 | 0 |
| C | 0 | 14 | 0 |
| D | 0 | 14 | 0 |
| Quadrant | Total seconds | Saturated seconds | Saturation percentage |
|---|---|---|---|
| A | 6751 | 134 | 1.984891% |
| B | 6751 | 138 | 2.044142% |
| C | 6750 | 180 | 2.666667% |
| D | 6750 | 313 | 4.637037% |
Noise dominated data is calculated using 1-second bins in cleaned event files. If a bin has >2000 counts, and if more than 50% of those come from <1% of pixels, then it is considered to be noise-dominated and hence unusable.
| Quadrant | # 1 sec bins | Bins with >0 counts | Bins with >2000 counts | High rate bins dominated by noise | Noise dominated (total time) | Noise dominated (detector-on time) | Marked lightcurve |
|---|---|---|---|---|---|---|---|
| A | 7611 | 6752 | 12 | 12 | 0.16% | 0.18% | 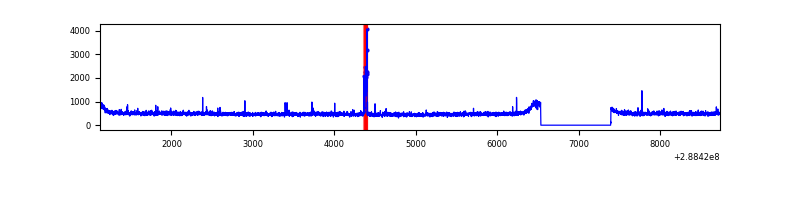 |
| B | 7611 | 6752 | 3 | 3 | 0.04% | 0.04% | 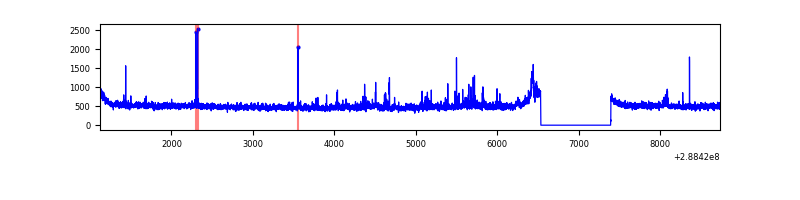 |
| C | 7610 | 6751 | 18 | 18 | 0.24% | 0.27% | 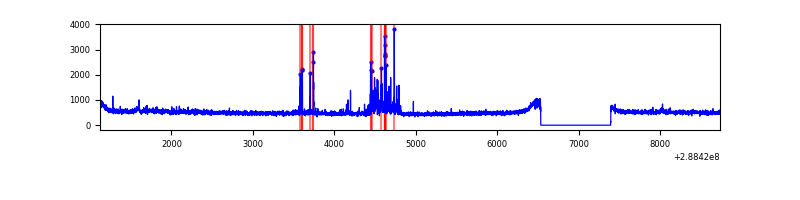 |
| D | 7610 | 6751 | 154 | 154 | 2.02% | 2.28% | 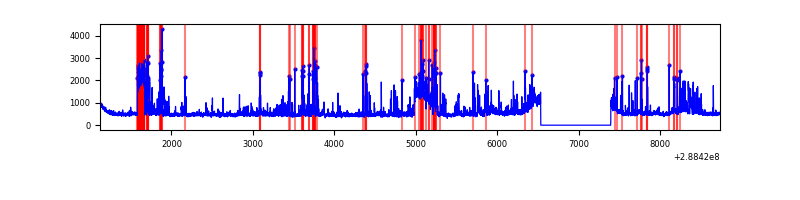 |
Top three noisy pixels from each quadrant. If the there are fewer than three noisy pixels in the level2.evt file, extra rows are filled as -1
| Pixel properties | Quadrant properties | ||||||
|---|---|---|---|---|---|---|---|
| Quadrant | DetID | PixID | Counts | Sigma | Mean | Median | Sigma |
| A | 15 | 174 | 65407 | 373.4 | 854 | 835 | 172.9 |
| A | 4 | 2 | 14211 | 77.35 | 854 | 835 | 172.9 |
| A | 0 | 226 | 7433 | 38.15 | 854 | 835 | 172.9 |
| B | 10 | 245 | 51787 | 312.65 | 854 | 833 | 163.0 |
| B | 3 | 64 | 31684 | 189.3 | 854 | 833 | 163.0 |
| B | 12 | 111 | 18914 | 110.94 | 854 | 833 | 163.0 |
| C | 0 | 207 | 209332 | 1090.31 | 821 | 826 | 191.2 |
| C | 14 | 238 | 126734 | 658.39 | 821 | 826 | 191.2 |
| C | 3 | 233 | 59061 | 304.52 | 821 | 826 | 191.2 |
| D | 1 | 52 | 1043238 | 5157.01 | 825 | 801 | 202.1 |
| D | 8 | 230 | 232019 | 1143.85 | 825 | 801 | 202.1 |
| D | 2 | 33 | 35395 | 171.14 | 825 | 801 | 202.1 |
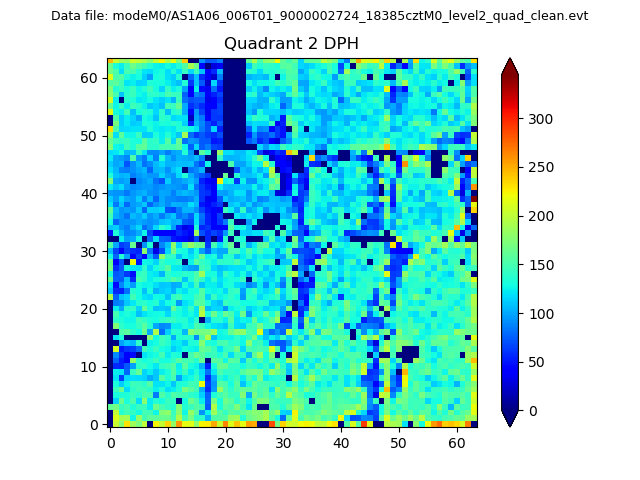
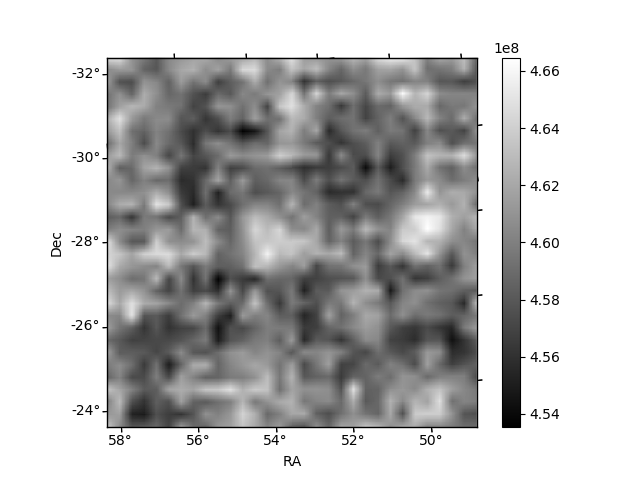
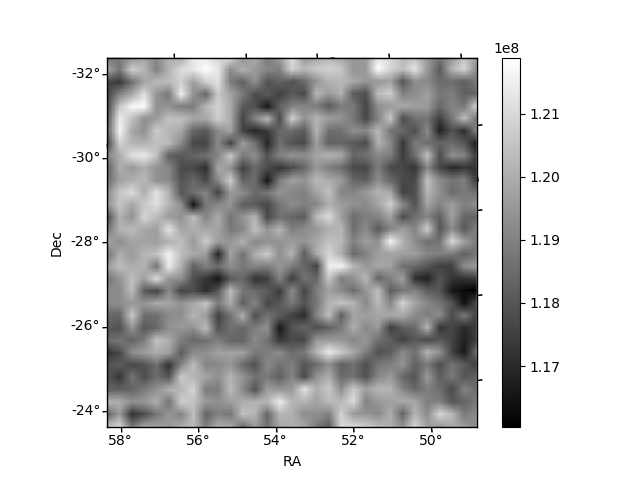
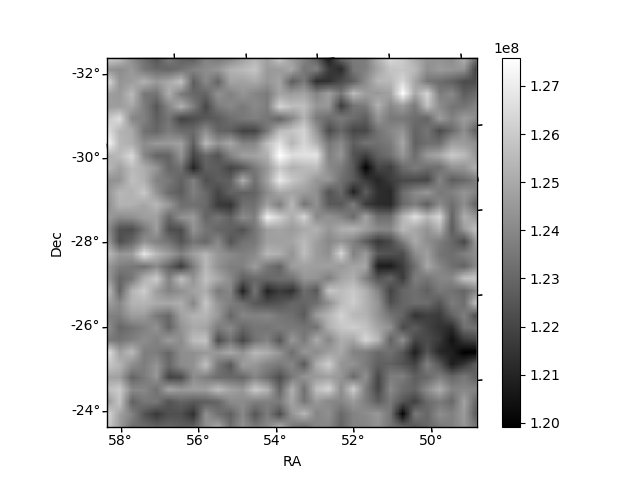
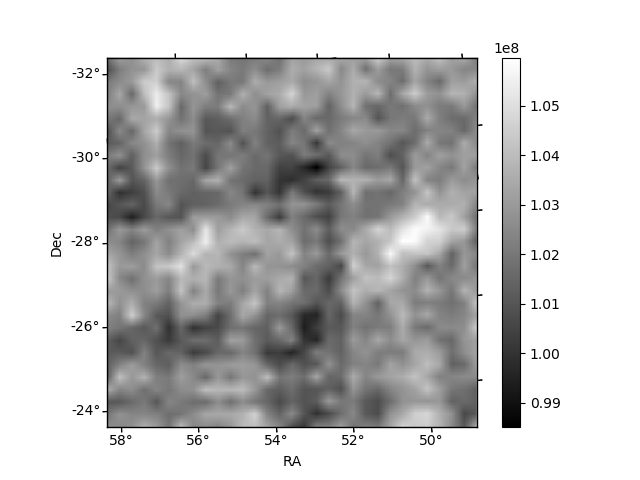
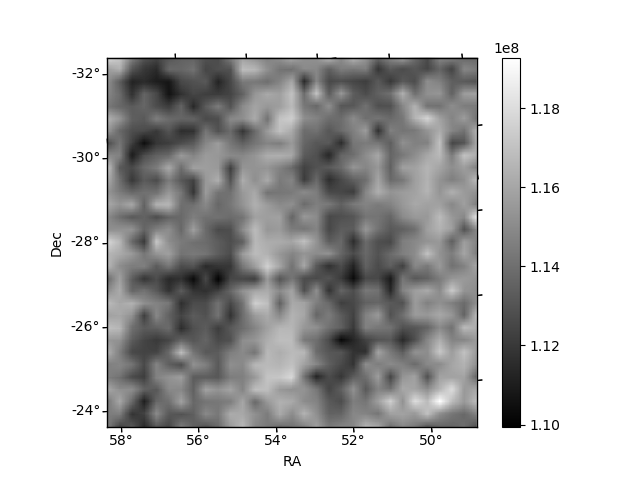
Histogram calculated using DETX and DETY for each event in the final _common_clean file
| Quadrant A | 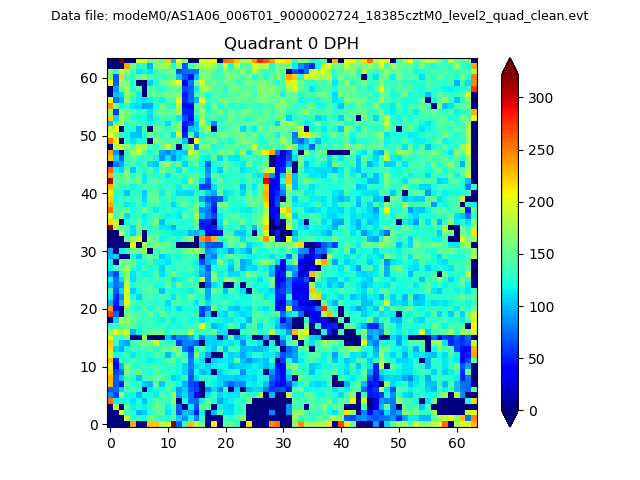 |
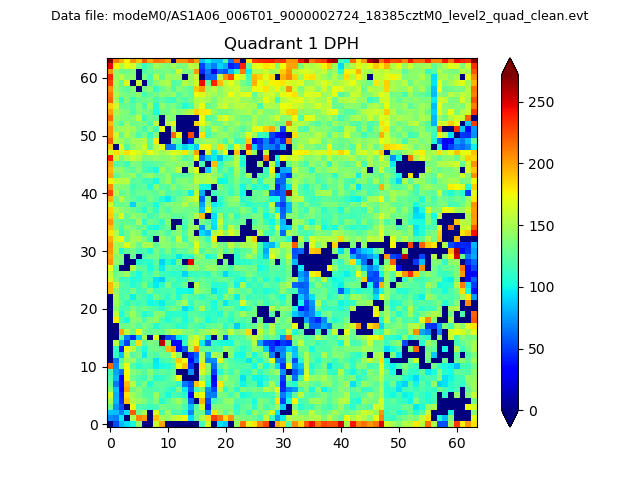 |
Quadrant B |
|---|---|---|---|
| Quadrant D | 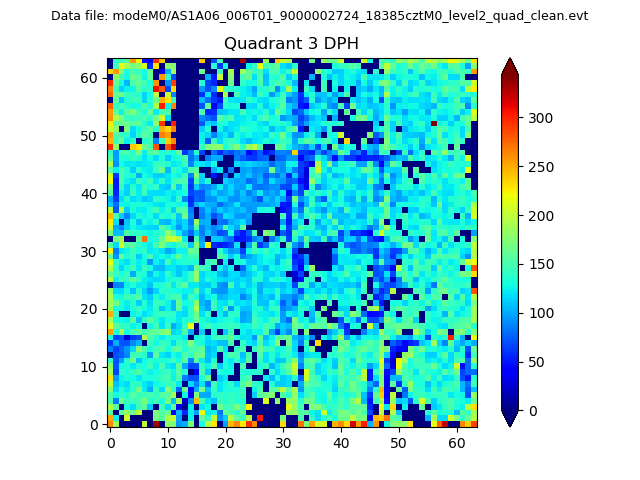 |
 |
Quadrant C |
| Plot type | Count rate plots | Images |
|---|---|---|
| Comparison with Poisson distribution Blue bars denote a histogram of data divided into 1 sec bins. Red curve is a Poisson curve with rate = median count rate of data. |
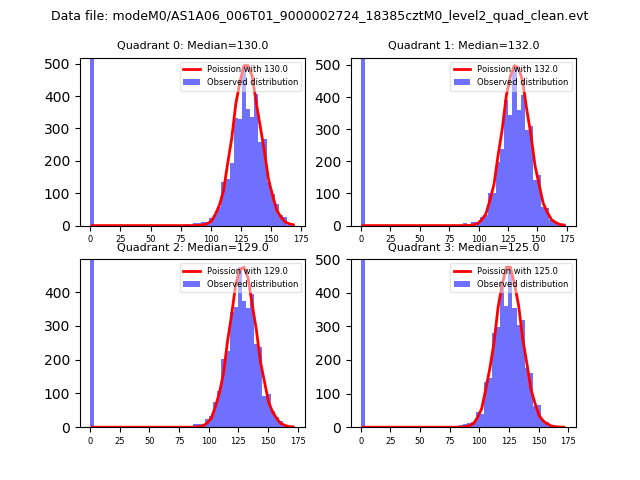 |
 |
| Quadrant-wise count rates Data is divided into 100 sec bins |
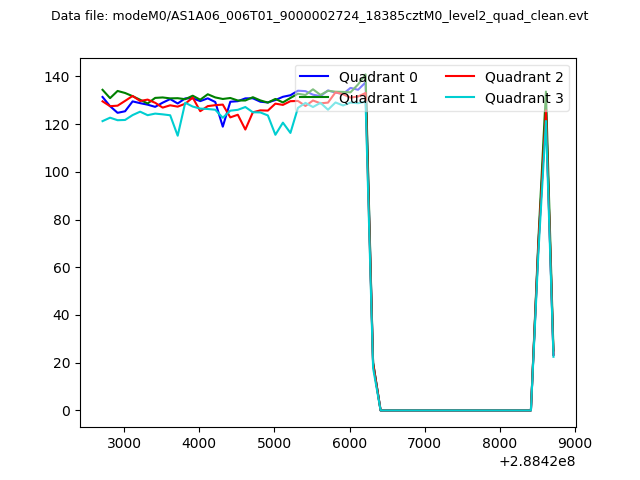 |
|
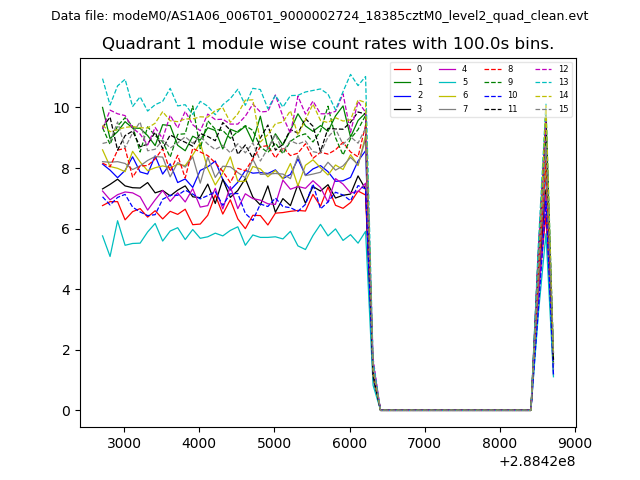
| Module-wise count rates for Quadrant A Data is divided into 100 sec bins |
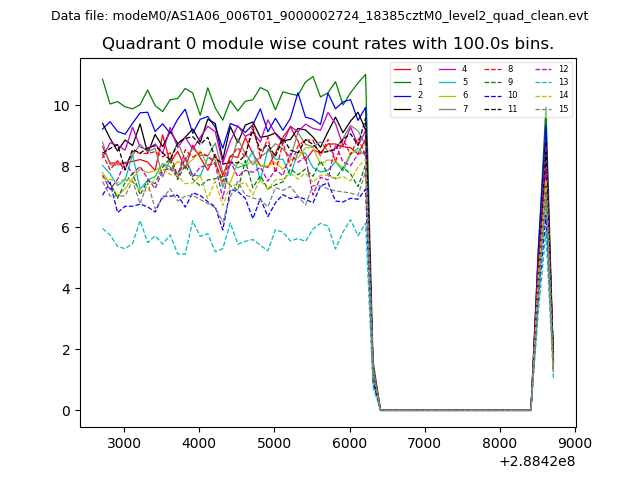 |
 |
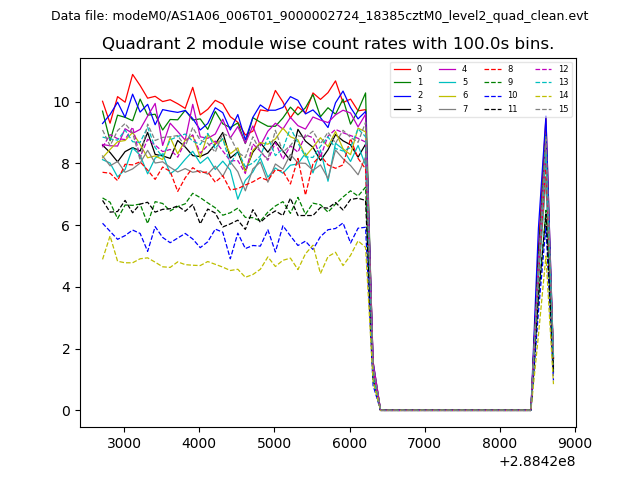
| Module-wise count rates for Quadrant B Data is divided into 100 sec bins |
 |
 |
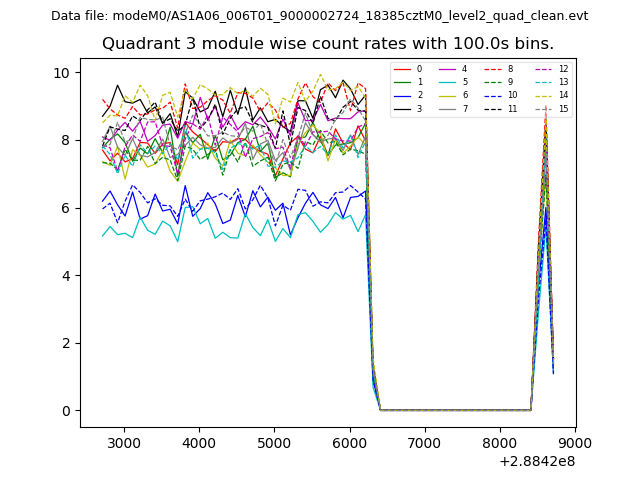
| Module-wise count rates for Quadrant C Data is divided into 100 sec bins |
 |
 |
| Module-wise count rates for Quadrant D Data is divided into 100 sec bins |
 |
 |
| Parameter | Plot |
|---|---|
| CZT HV Monitor | 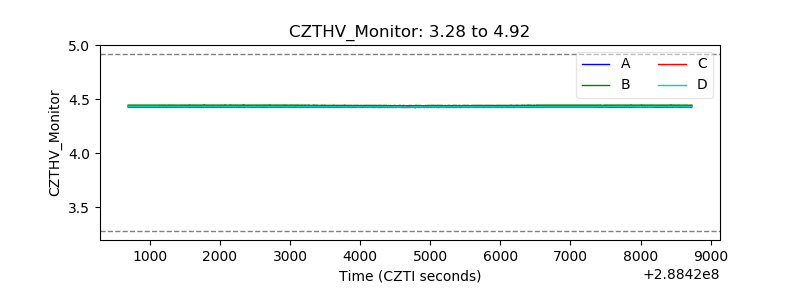 |
| D_VDD | 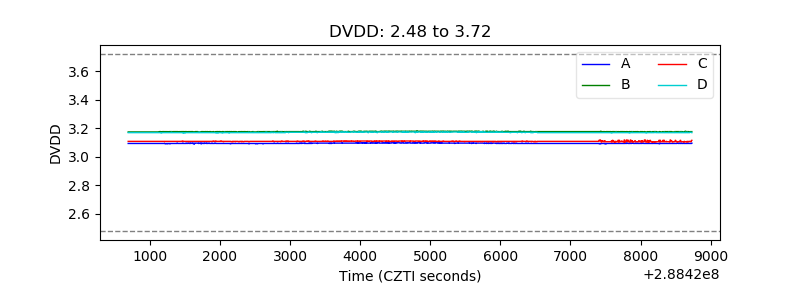 |
| Temperature 1 | 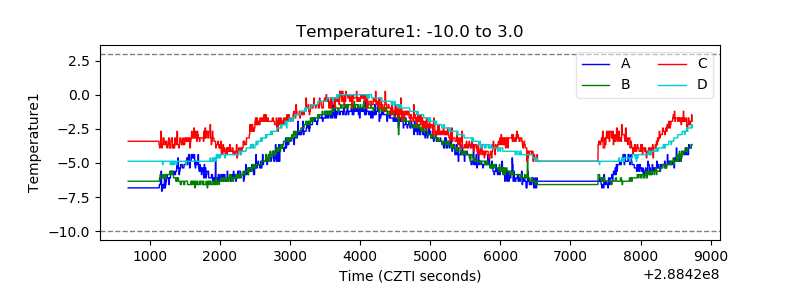 |
| Veto HV Monitor | 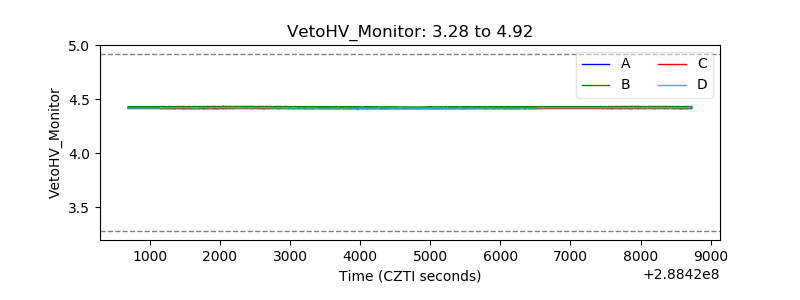 |
| Veto LLD | 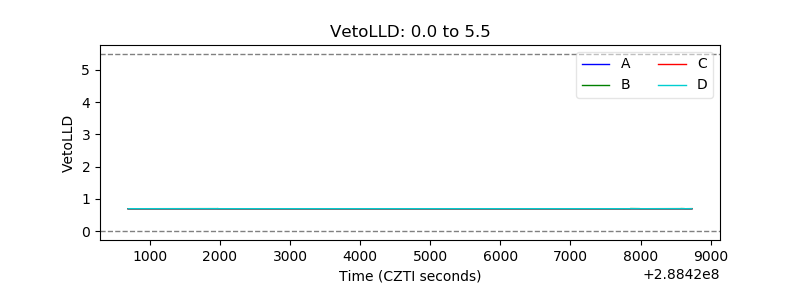 |
| Alpha Counter | 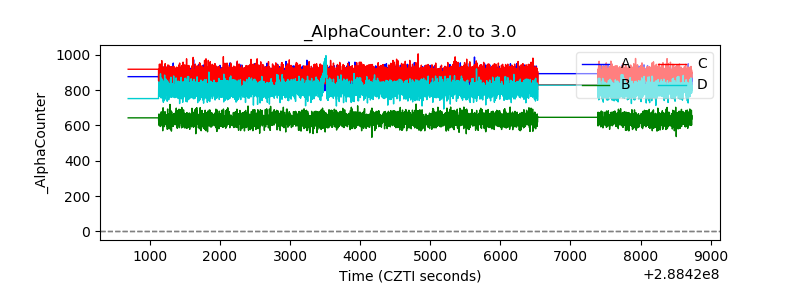 |
| _CPM_Rate | 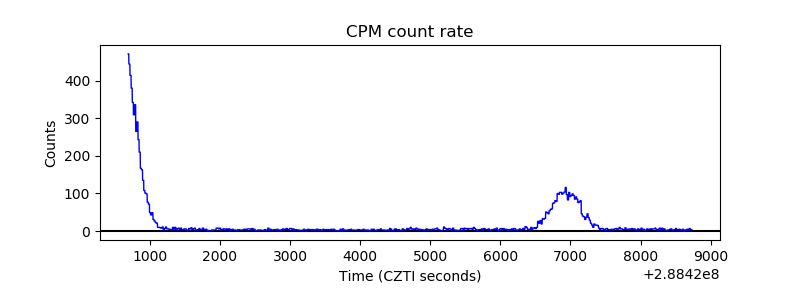 |
| CZT Counter | 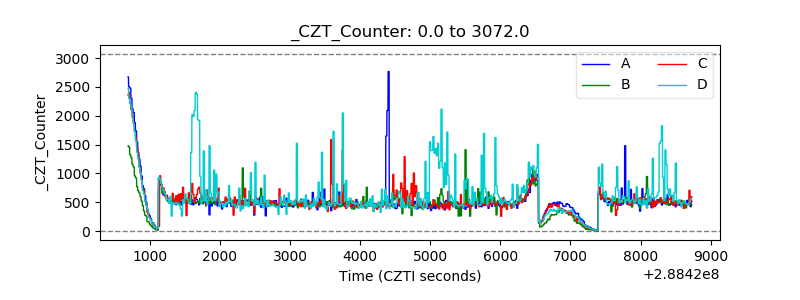 |
| +2.5 Volts monitor |  |
| +5 Volts monitor |  |
| _ROLL_ROT | 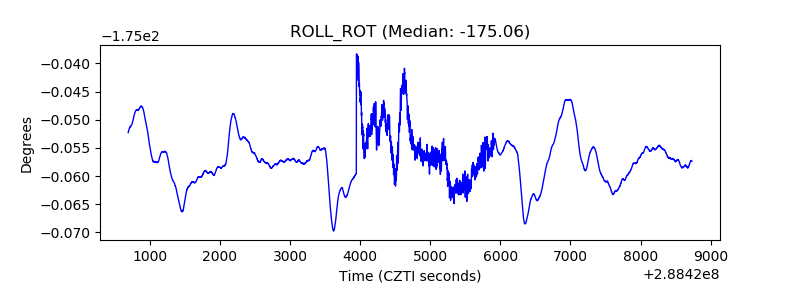 |
| _Roll_DEC | 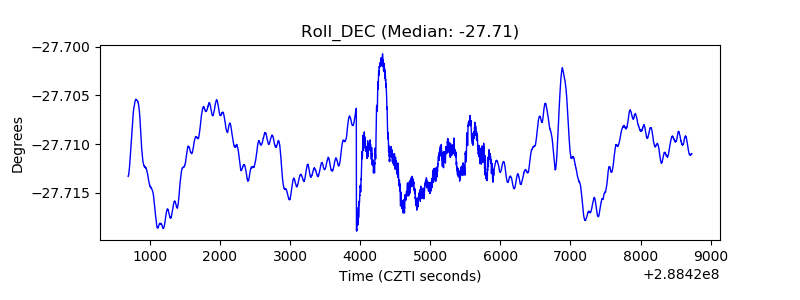 |
| _Roll_RA | 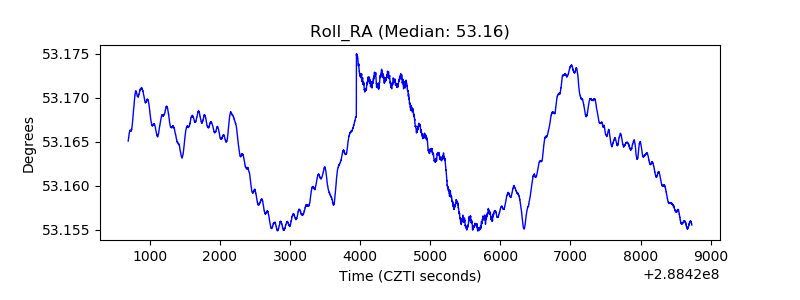 |
| Veto Counter | 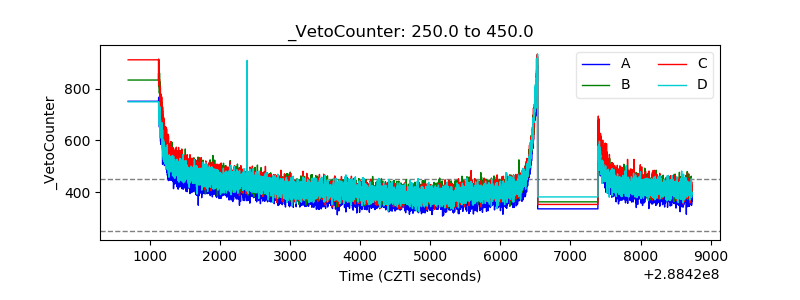 |