| Param | Original file | Final file |
|---|---|---|
| Filename | modeM0/AS1A06_006T01_9000002724_18387cztM0_level2.evt | modeM0/AS1A06_006T01_9000002724_18387cztM0_level2_quad_clean.evt |
| Size (bytes) | 604,278,720 | 94,717,440 |
| Size | 576.3 MB | 90.3 MB |
| Events in quadrant A | 3,765,338 | 592,459 |
| Events in quadrant B | 4,778,554 | 590,957 |
| Events in quadrant C | 4,147,590 | 578,337 |
| Events in quadrant D | 5,083,405 | 567,466 |
| Mode M0 | |||
|---|---|---|---|
| Quadrant | BADHDUFLAG | Total packets | Discarded packets |
| A | 0 | 16251 | 0 |
| B | 0 | 19120 | 0 |
| C | 0 | 17239 | 0 |
| D | 0 | 20058 | 0 |
| Mode SS | |||
|---|---|---|---|
| Quadrant | BADHDUFLAG | Total packets | Discarded packets |
| A | 0 | 160 | 0 |
| B | 0 | 160 | 0 |
| C | 0 | 160 | 0 |
| D | 0 | 160 | 0 |
| Mode M9 | |||
|---|---|---|---|
| Quadrant | BADHDUFLAG | Total packets | Discarded packets |
| A | 0 | 6 | 0 |
| B | 0 | 6 | 0 |
| C | 0 | 6 | 0 |
| D | 0 | 6 | 0 |
| Quadrant | Total seconds | Saturated seconds | Saturation percentage |
|---|---|---|---|
| A | 7756 | 281 | 3.623002% |
| B | 7756 | 426 | 5.492522% |
| C | 7756 | 410 | 5.286230% |
| D | 7756 | 392 | 5.054152% |
Noise dominated data is calculated using 1-second bins in cleaned event files. If a bin has >2000 counts, and if more than 50% of those come from <1% of pixels, then it is considered to be noise-dominated and hence unusable.
| Quadrant | # 1 sec bins | Bins with >0 counts | Bins with >2000 counts | High rate bins dominated by noise | Noise dominated (total time) | Noise dominated (detector-on time) | Marked lightcurve |
|---|---|---|---|---|---|---|---|
| A | 8341 | 7760 | 0 | 0 | 0.00% | 0.00% | 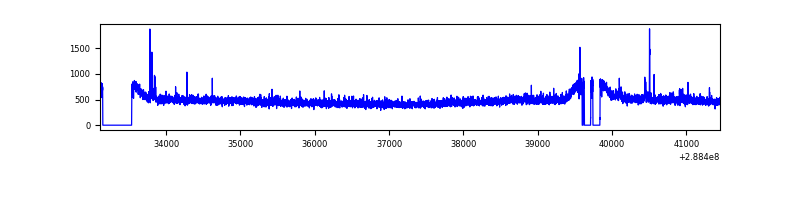 |
| B | 8341 | 7760 | 125 | 125 | 1.50% | 1.61% | 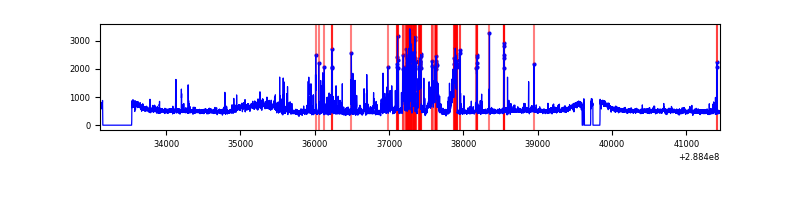 |
| C | 8341 | 7760 | 73 | 73 | 0.88% | 0.94% | 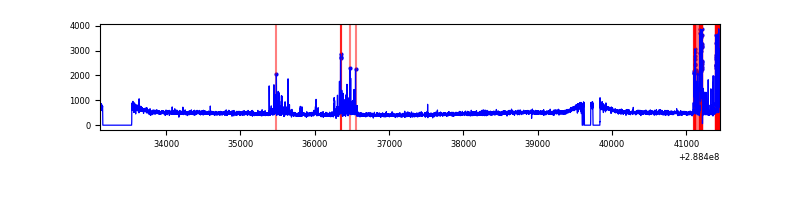 |
| D | 8341 | 7760 | 155 | 155 | 1.86% | 2.00% | 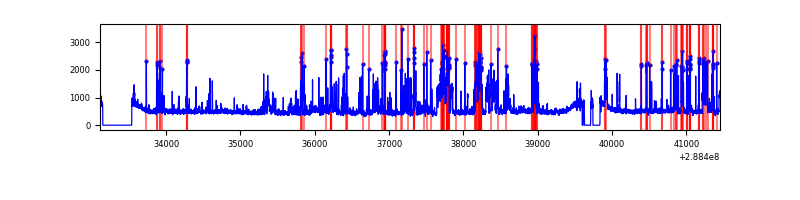 |
Top three noisy pixels from each quadrant. If the there are fewer than three noisy pixels in the level2.evt file, extra rows are filled as -1
| Pixel properties | Quadrant properties | ||||||
|---|---|---|---|---|---|---|---|
| Quadrant | DetID | PixID | Counts | Sigma | Mean | Median | Sigma |
| A | 4 | 2 | 32307 | 157.78 | 968 | 945 | 198.8 |
| A | 15 | 174 | 14365 | 67.52 | 968 | 945 | 198.8 |
| A | 0 | 226 | 8536 | 38.19 | 968 | 945 | 198.8 |
| B | 10 | 245 | 242808 | 1294.61 | 962 | 937 | 186.8 |
| B | 12 | 18 | 237816 | 1267.89 | 962 | 937 | 186.8 |
| B | 3 | 64 | 211894 | 1129.15 | 962 | 937 | 186.8 |
| C | 0 | 207 | 406458 | 1880.17 | 921 | 924 | 215.7 |
| C | 14 | 238 | 142559 | 656.66 | 921 | 924 | 215.7 |
| C | 13 | 61 | 6505 | 25.87 | 921 | 924 | 215.7 |
| D | 1 | 52 | 1379828 | 5970.18 | 941 | 911 | 231.0 |
| D | 7 | 238 | 43057 | 182.48 | 941 | 911 | 231.0 |
| D | 2 | 234 | 37316 | 157.62 | 941 | 911 | 231.0 |
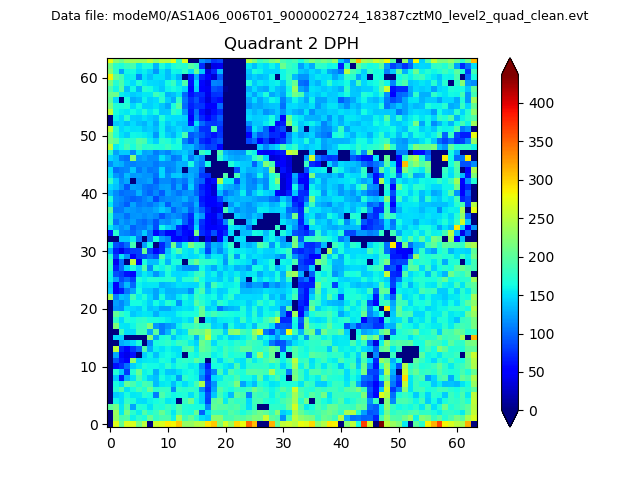
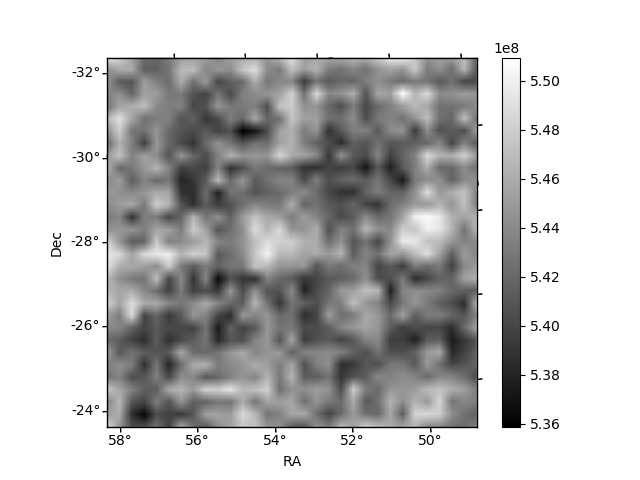
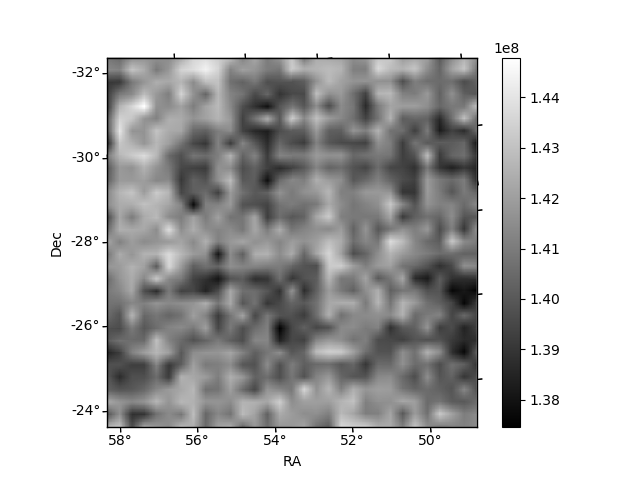
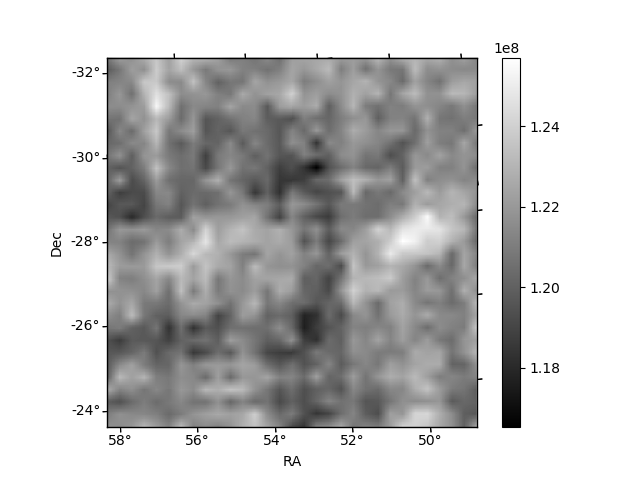
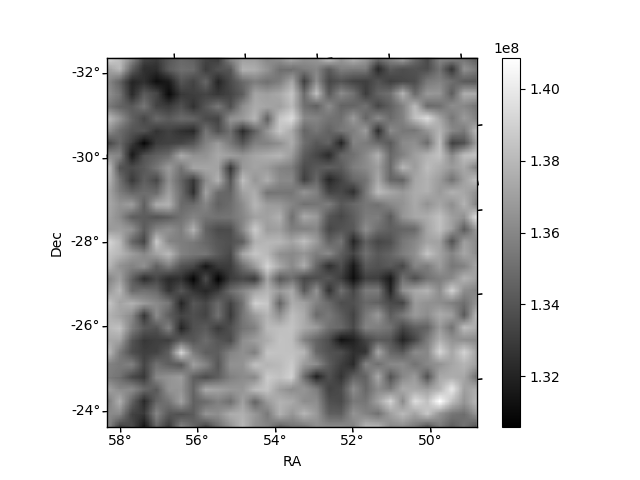
Histogram calculated using DETX and DETY for each event in the final _common_clean file
| Quadrant A | 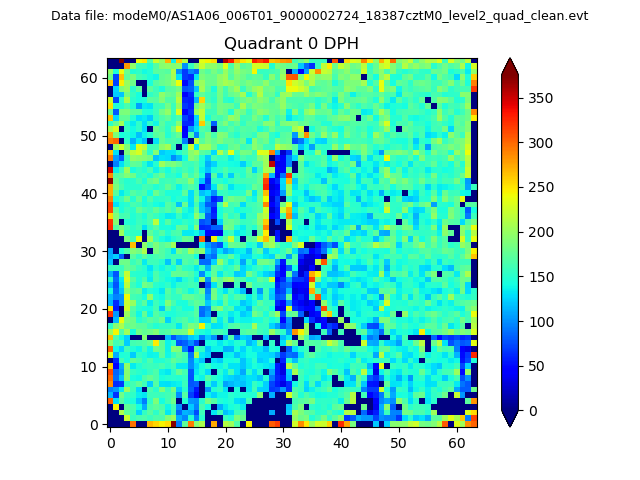 |
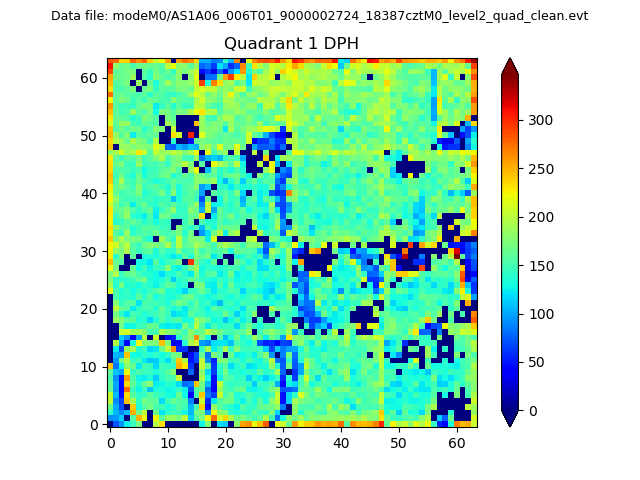 |
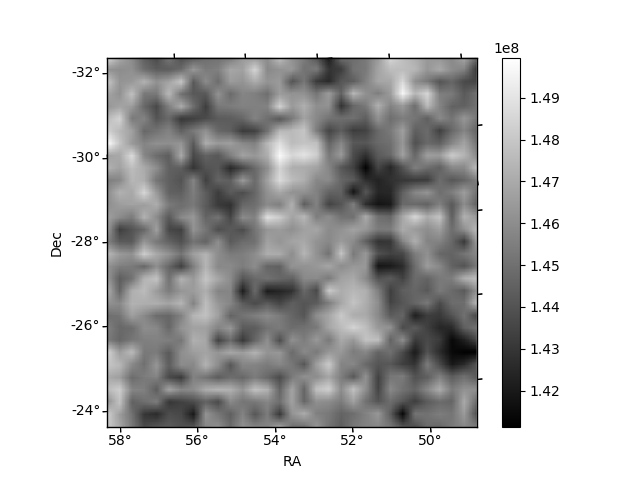
Quadrant B |
|---|---|---|---|
| Quadrant D | 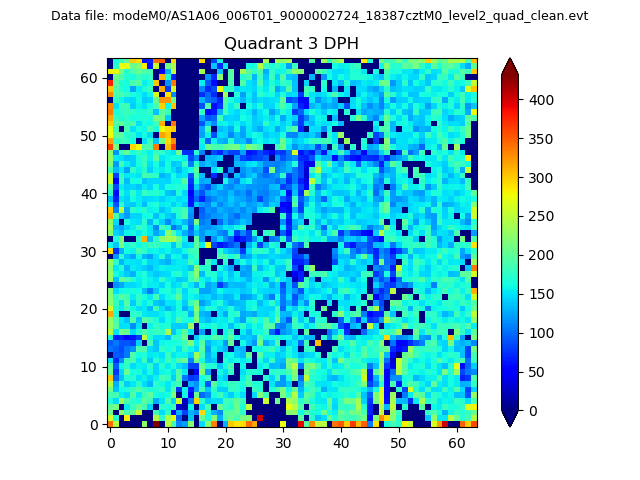 |
 |
Quadrant C |
| Plot type | Count rate plots | Images |
|---|---|---|
| Comparison with Poisson distribution Blue bars denote a histogram of data divided into 1 sec bins. Red curve is a Poisson curve with rate = median count rate of data. |
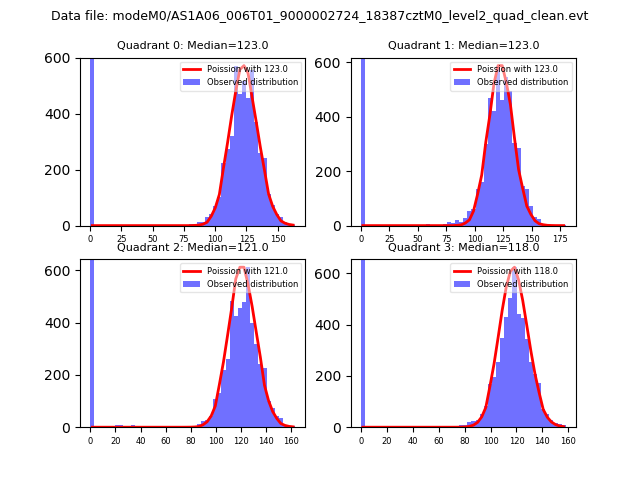 |
 |
| Quadrant-wise count rates Data is divided into 100 sec bins |
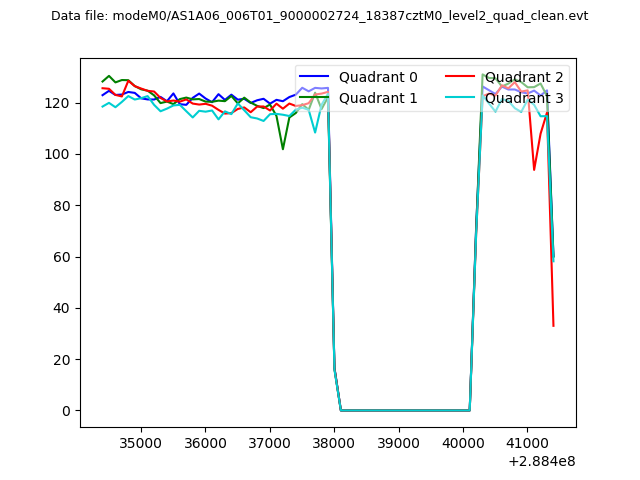 |
|
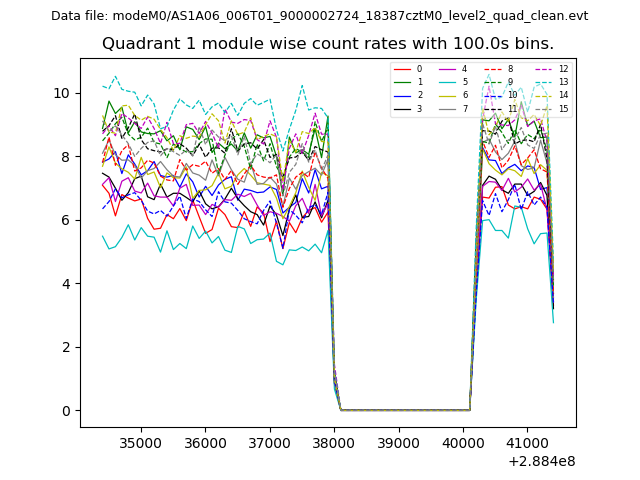
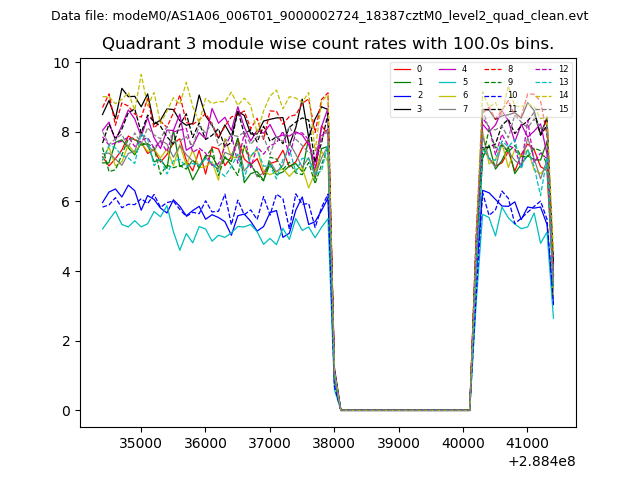
| Module-wise count rates for Quadrant A Data is divided into 100 sec bins |
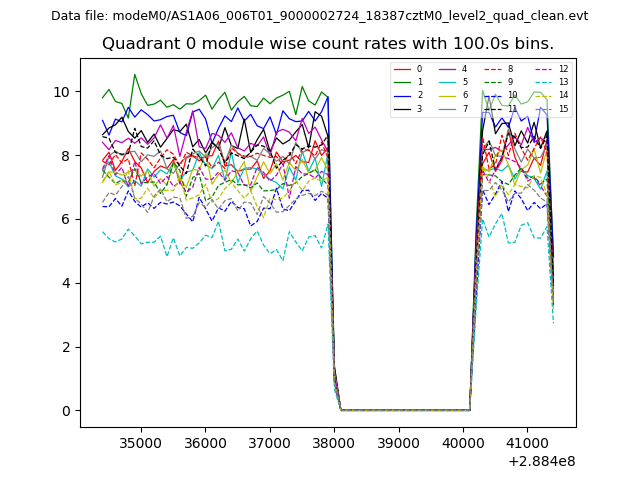 |
 |
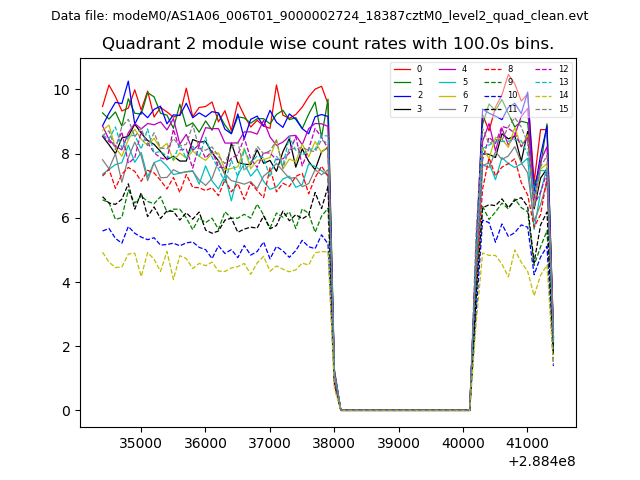
| Module-wise count rates for Quadrant B Data is divided into 100 sec bins |
 |
 |
| Module-wise count rates for Quadrant C Data is divided into 100 sec bins |
 |
 |
| Module-wise count rates for Quadrant D Data is divided into 100 sec bins |
 |
 |
| Parameter | Plot |
|---|---|
| CZT HV Monitor | 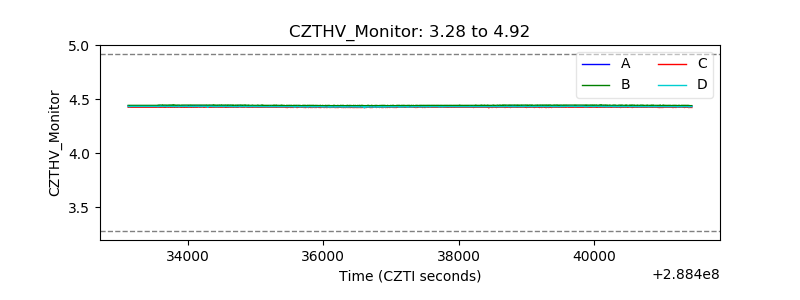 |
| D_VDD | 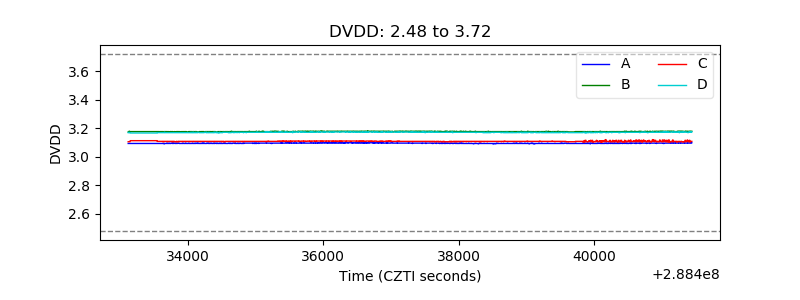 |
| Temperature 1 | 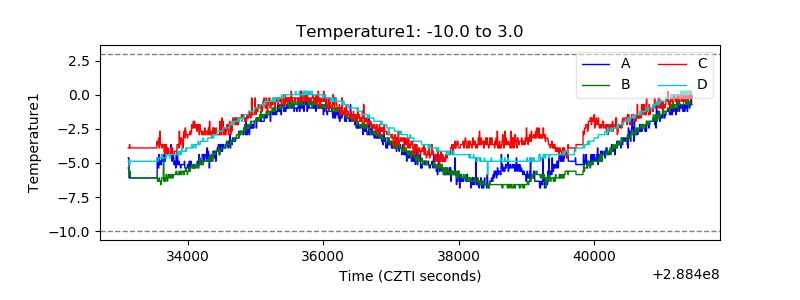 |
| Veto HV Monitor | 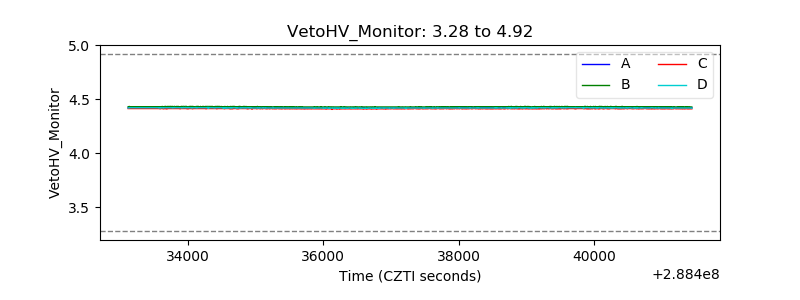 |
| Veto LLD | 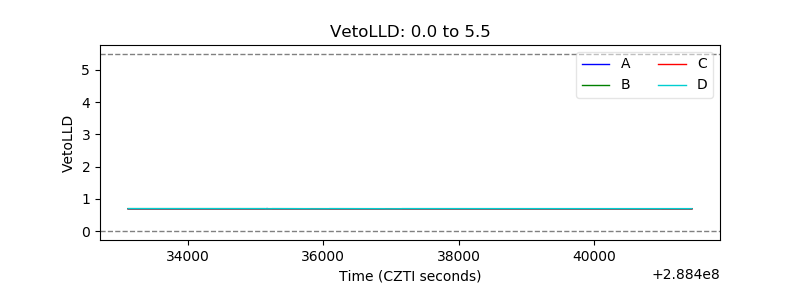 |
| Alpha Counter | 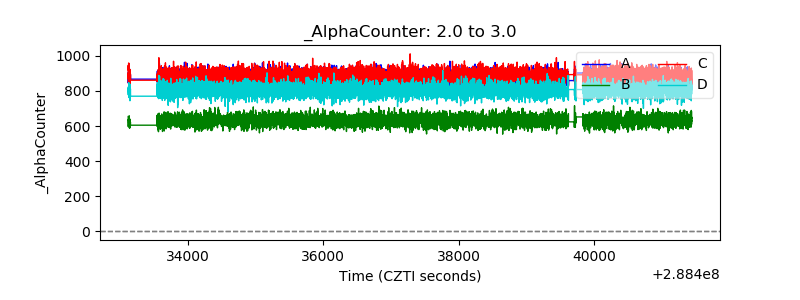 |
| _CPM_Rate | 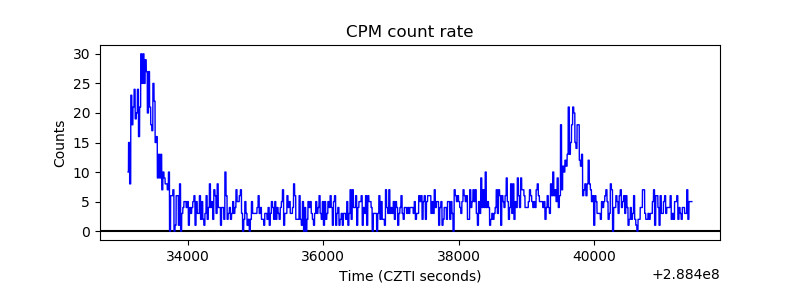 |
| CZT Counter | 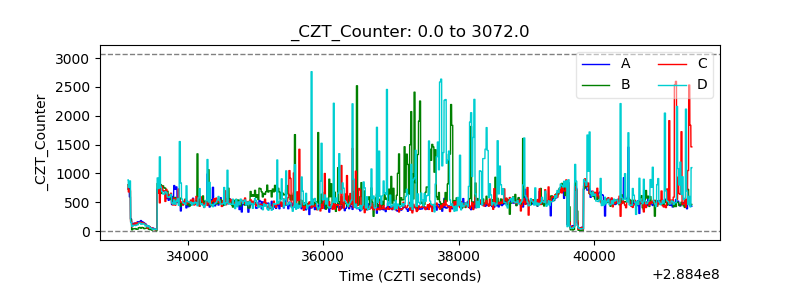 |
| +2.5 Volts monitor |  |
| +5 Volts monitor |  |
| _ROLL_ROT | 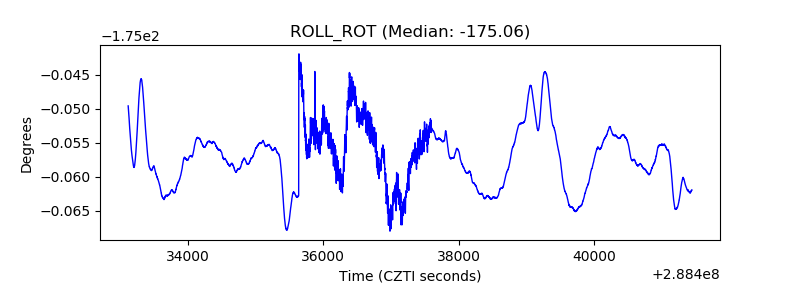 |
| _Roll_DEC | 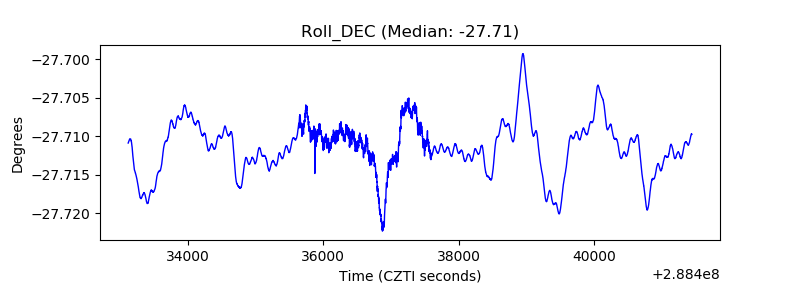 |
| _Roll_RA | 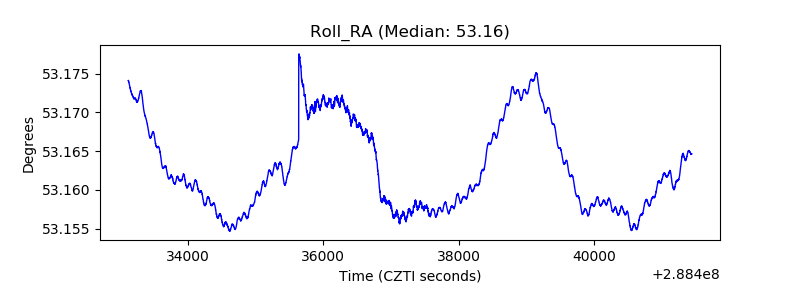 |
| Veto Counter |  |