| Param | Original file | Final file |
|---|---|---|
| Filename | modeM0/AS1A06_006T01_9000002724_18388cztM0_level2.evt | modeM0/AS1A06_006T01_9000002724_18388cztM0_level2_quad_clean.evt |
| Size (bytes) | 182,649,600 | 43,519,680 |
| Size | 174.2 MB | 41.5 MB |
| Events in quadrant A | 1,058,856 | 293,026 |
| Events in quadrant B | 1,200,171 | 293,411 |
| Events in quadrant C | 1,342,552 | 280,036 |
| Events in quadrant D | 1,763,505 | 277,142 |
| Mode M0 | |||
|---|---|---|---|
| Quadrant | BADHDUFLAG | Total packets | Discarded packets |
| A | 0 | 4859 | 0 |
| B | 0 | 5152 | 0 |
| C | 0 | 5733 | 0 |
| D | 0 | 6812 | 0 |
| Mode SS | |||
|---|---|---|---|
| Quadrant | BADHDUFLAG | Total packets | Discarded packets |
| A | 0 | 48 | 0 |
| B | 0 | 48 | 0 |
| C | 0 | 48 | 0 |
| D | 0 | 48 | 0 |
| Quadrant | Total seconds | Saturated seconds | Saturation percentage |
|---|---|---|---|
| A | 2419 | 0 | 0.000000% |
| B | 2420 | 3 | 0.123967% |
| C | 2420 | 100 | 4.132231% |
| D | 2420 | 109 | 4.504132% |
Noise dominated data is calculated using 1-second bins in cleaned event files. If a bin has >2000 counts, and if more than 50% of those come from <1% of pixels, then it is considered to be noise-dominated and hence unusable.
| Quadrant | # 1 sec bins | Bins with >0 counts | Bins with >2000 counts | High rate bins dominated by noise | Noise dominated (total time) | Noise dominated (detector-on time) | Marked lightcurve |
|---|---|---|---|---|---|---|---|
| A | 2419 | 2419 | 0 | 0 | 0.00% | 0.00% | 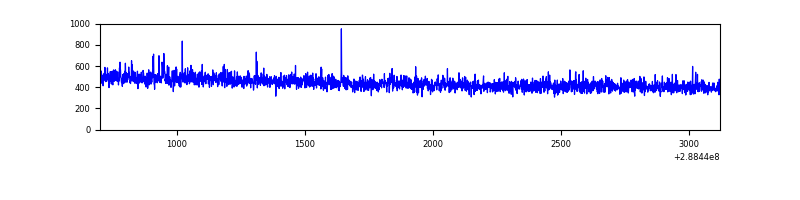 |
| B | 2420 | 2420 | 3 | 3 | 0.12% | 0.12% | 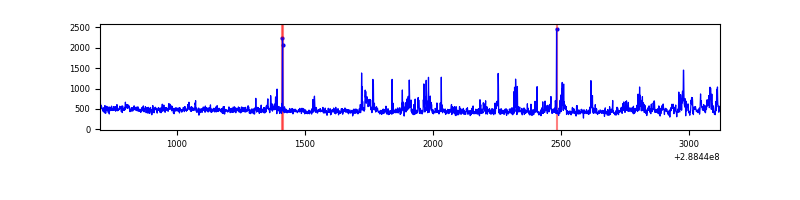 |
| C | 2420 | 2420 | 73 | 73 | 3.02% | 3.02% | 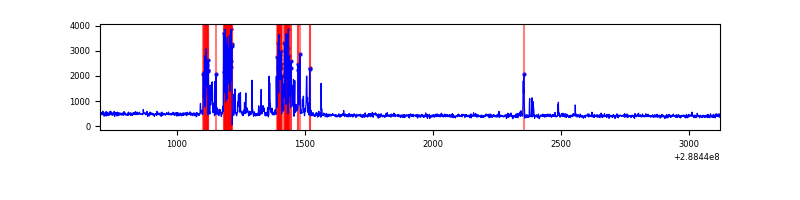 |
| D | 2420 | 2420 | 117 | 117 | 4.83% | 4.83% | 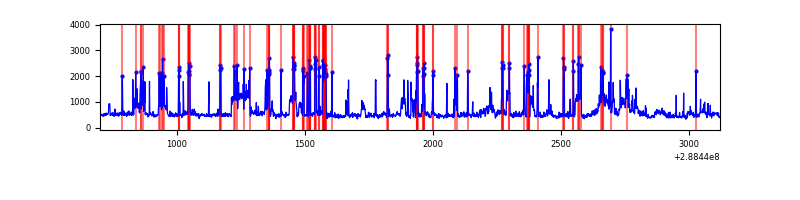 |
Top three noisy pixels from each quadrant. If the there are fewer than three noisy pixels in the level2.evt file, extra rows are filled as -1
| Pixel properties | Quadrant properties | ||||||
|---|---|---|---|---|---|---|---|
| Quadrant | DetID | PixID | Counts | Sigma | Mean | Median | Sigma |
| A | 4 | 2 | 3277 | 52.66 | 273 | 267 | 57.2 |
| A | 15 | 174 | 3258 | 52.33 | 273 | 267 | 57.2 |
| A | 0 | 226 | 2493 | 38.95 | 273 | 267 | 57.2 |
| B | 0 | 189 | 34072 | 624.56 | 269 | 263 | 54.1 |
| B | 7 | 220 | 32980 | 604.39 | 269 | 263 | 54.1 |
| B | 0 | 244 | 29383 | 537.94 | 269 | 263 | 54.1 |
| C | 0 | 207 | 320562 | 5353.62 | 250 | 251 | 59.8 |
| C | 14 | 238 | 38530 | 639.79 | 250 | 251 | 59.8 |
| C | 8 | 128 | 3069 | 47.1 | 250 | 251 | 59.8 |
| D | 1 | 52 | 679152 | 10383.62 | 260 | 252 | 65.4 |
| D | 8 | 230 | 32570 | 494.3 | 260 | 252 | 65.4 |
| D | 2 | 152 | 29499 | 447.33 | 260 | 252 | 65.4 |
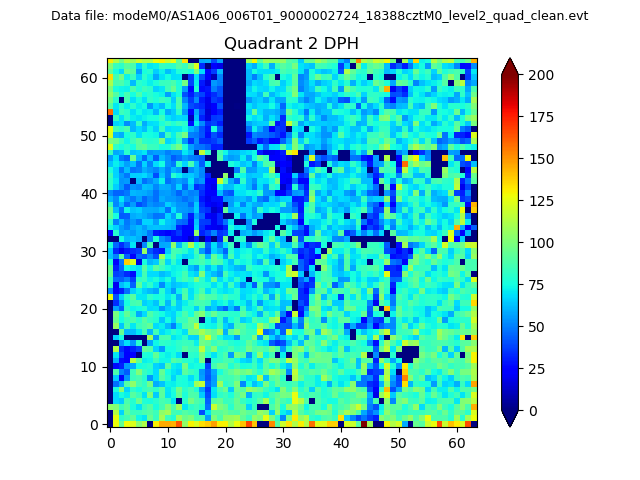
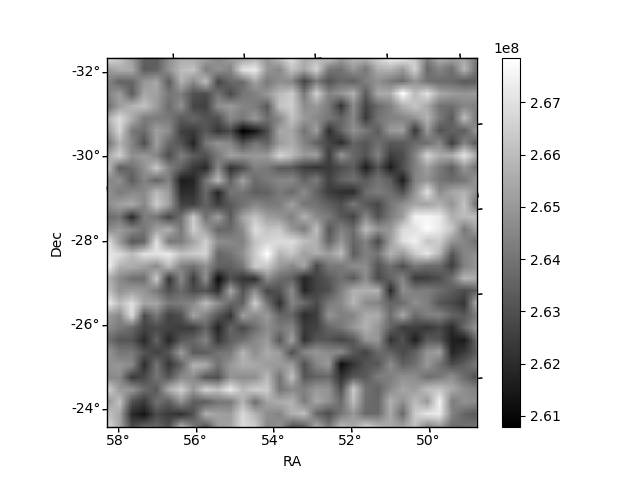
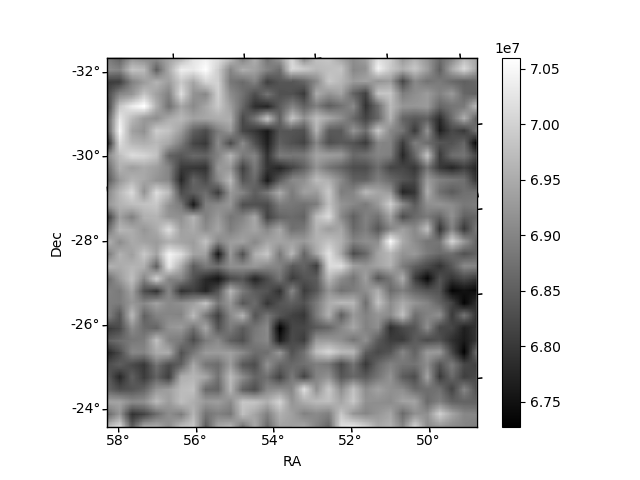
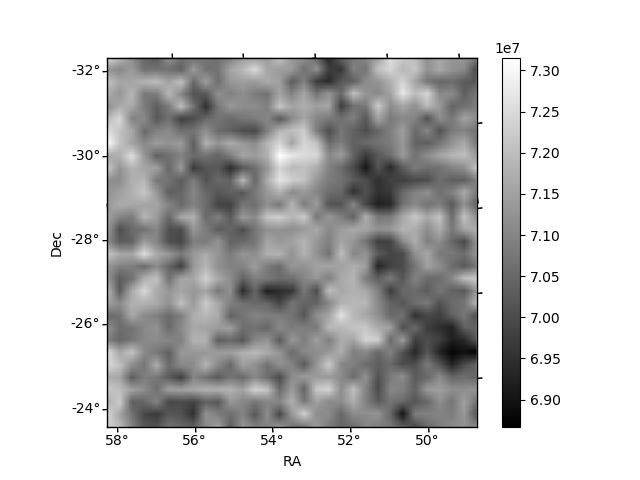
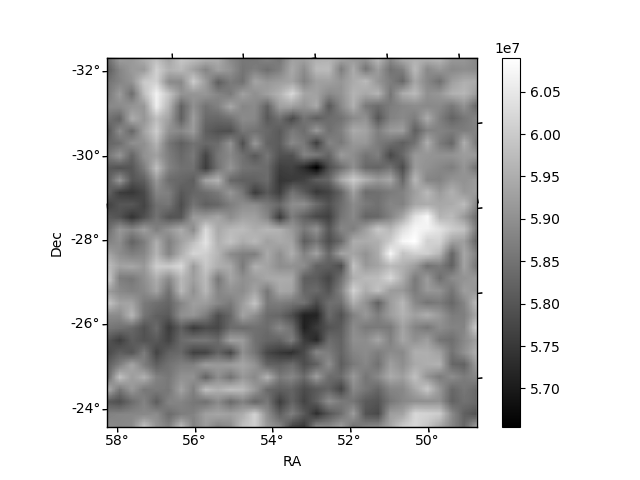
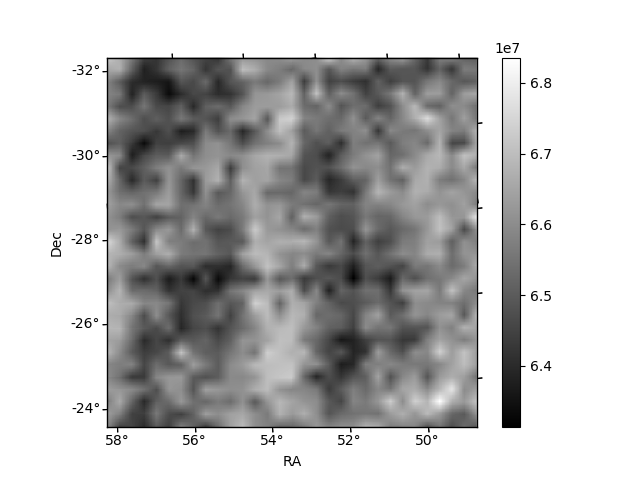
Histogram calculated using DETX and DETY for each event in the final _common_clean file
| Quadrant A | 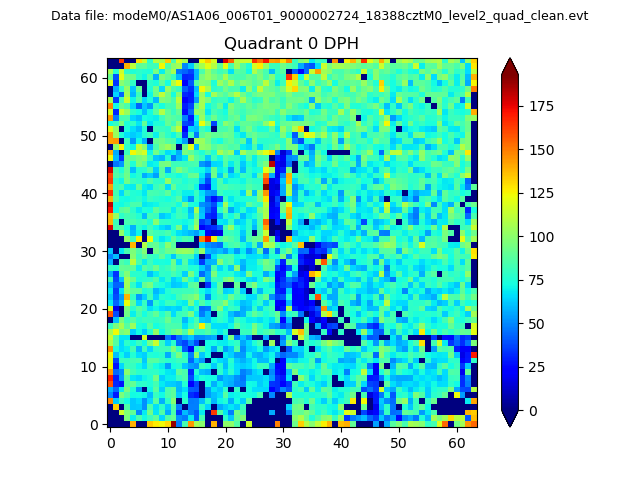 |
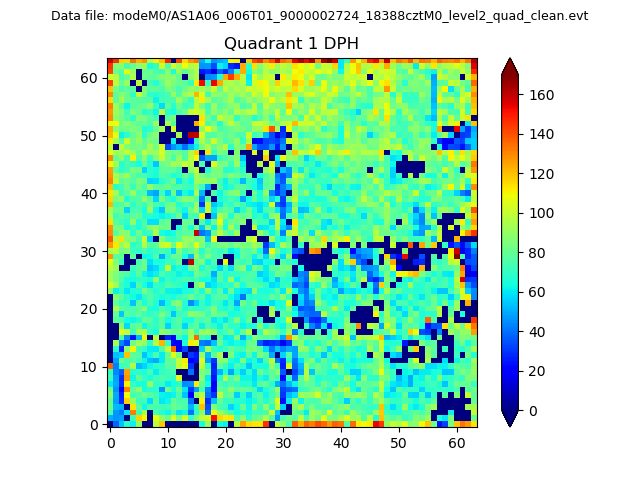 |
Quadrant B |
|---|---|---|---|
| Quadrant D | 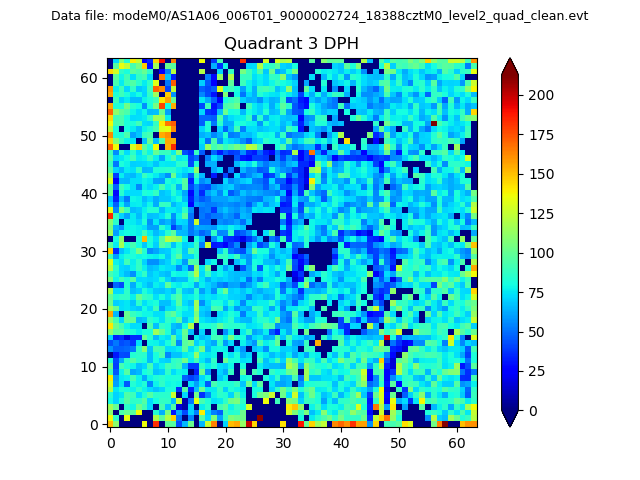 |
 |
Quadrant C |
| Plot type | Count rate plots | Images |
|---|---|---|
| Comparison with Poisson distribution Blue bars denote a histogram of data divided into 1 sec bins. Red curve is a Poisson curve with rate = median count rate of data. |
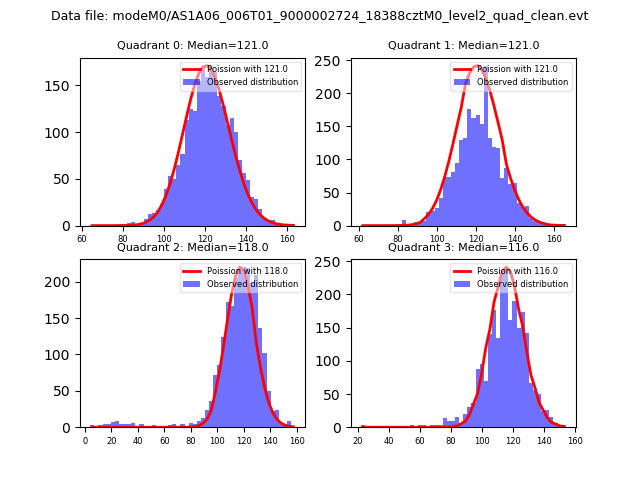 |
 |
| Quadrant-wise count rates Data is divided into 100 sec bins |
 |
|
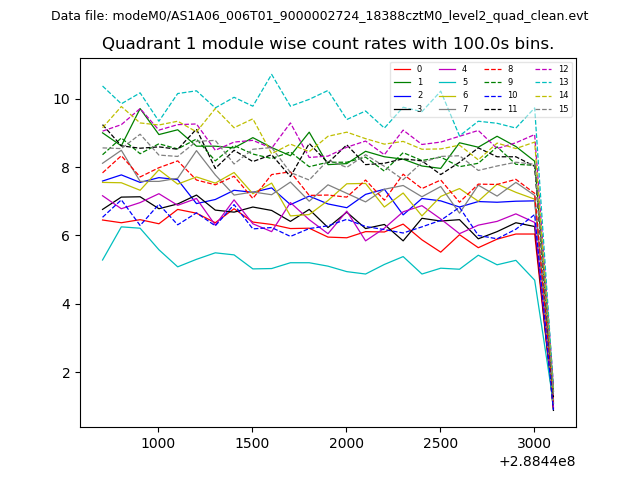
| Module-wise count rates for Quadrant A Data is divided into 100 sec bins |
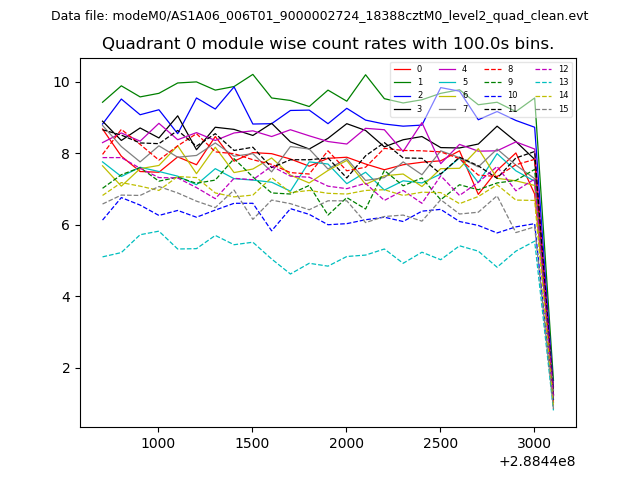 |
 |
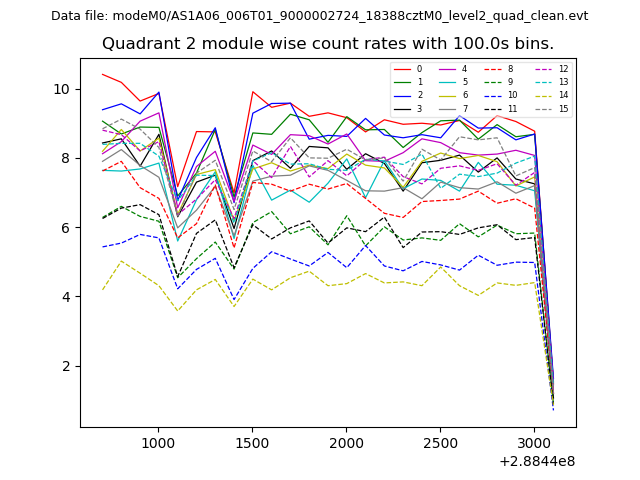
| Module-wise count rates for Quadrant B Data is divided into 100 sec bins |
 |
 |
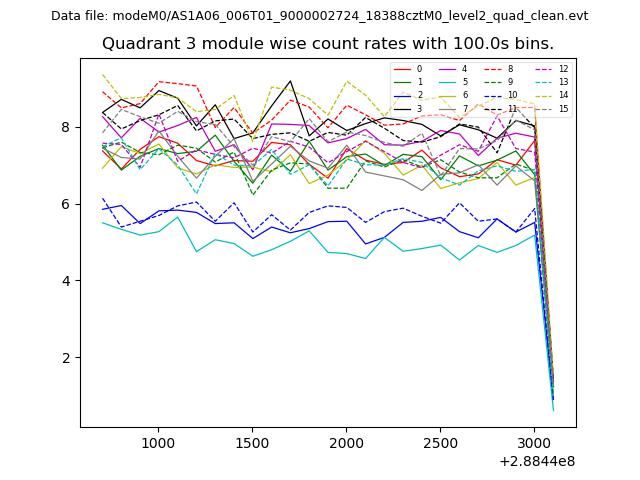
| Module-wise count rates for Quadrant C Data is divided into 100 sec bins |
 |
 |
| Module-wise count rates for Quadrant D Data is divided into 100 sec bins |
 |
 |
| Parameter | Plot |
|---|---|
| CZT HV Monitor | 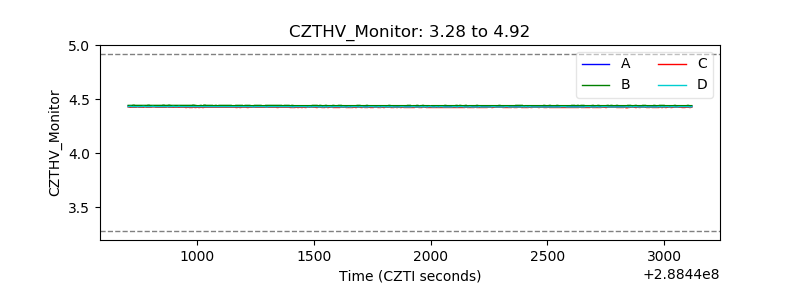 |
| D_VDD | 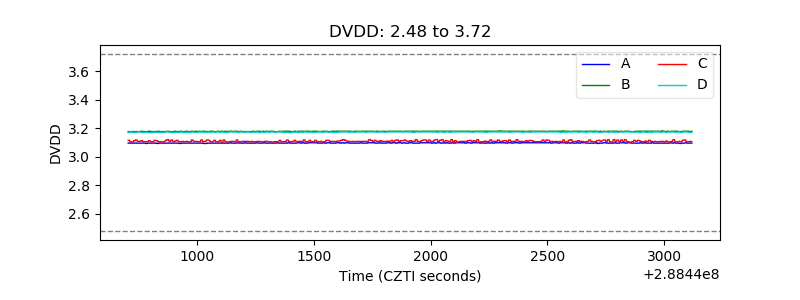 |
| Temperature 1 | 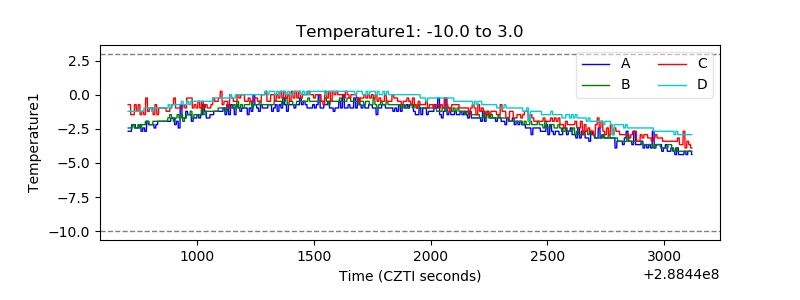 |
| Veto HV Monitor | 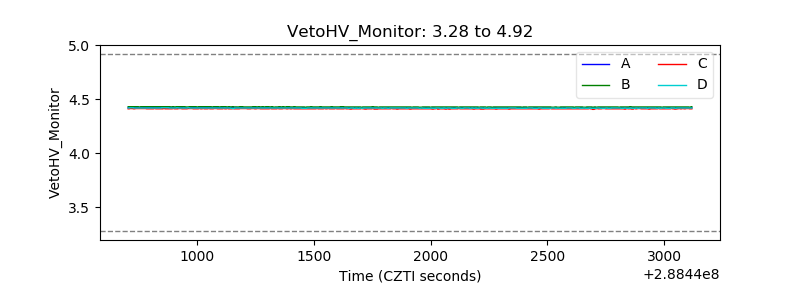 |
| Veto LLD | 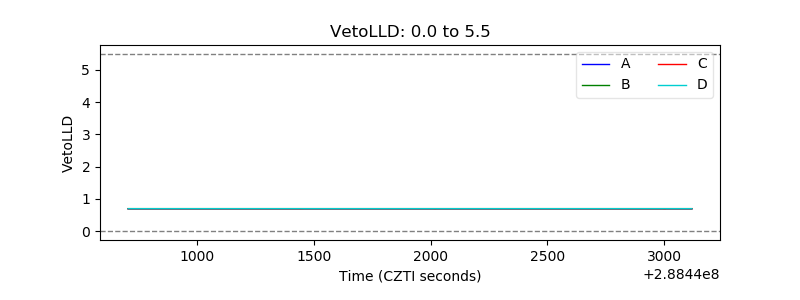 |
| Alpha Counter | 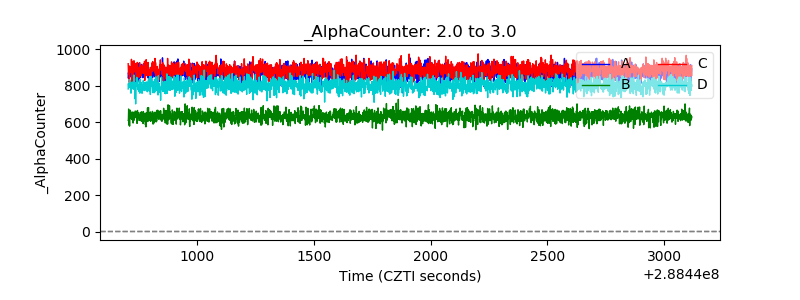 |
| _CPM_Rate | 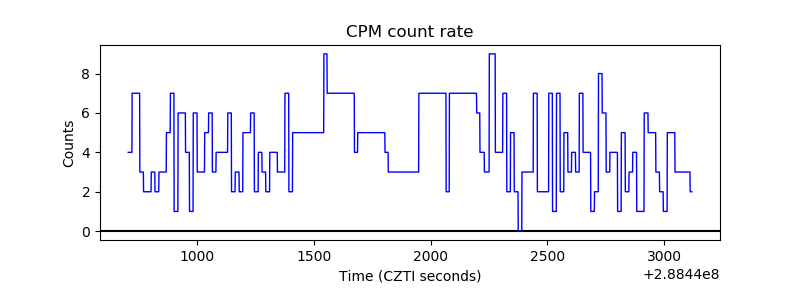 |
| CZT Counter | 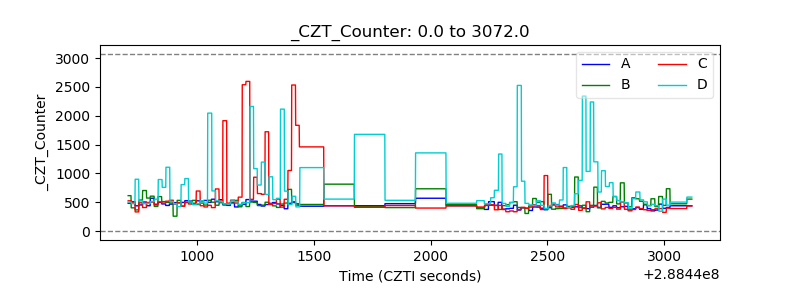 |
| +2.5 Volts monitor |  |
| +5 Volts monitor |  |
| _ROLL_ROT | 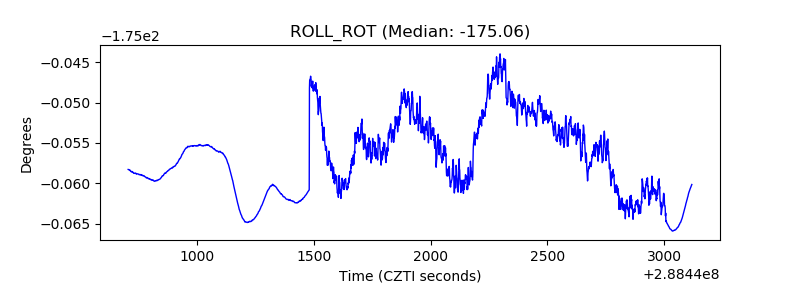 |
| _Roll_DEC | 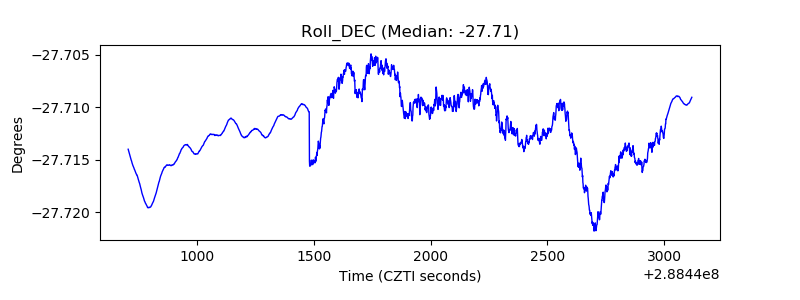 |
| _Roll_RA | 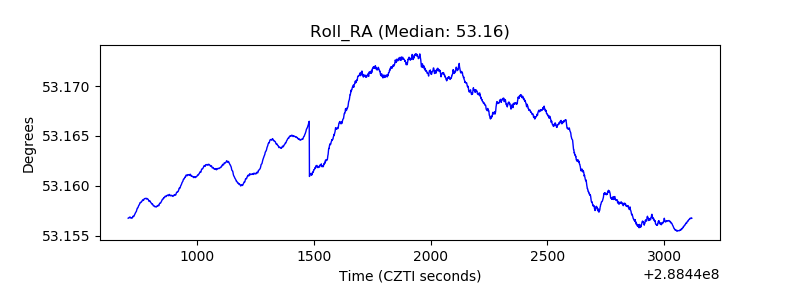 |
| Veto Counter | 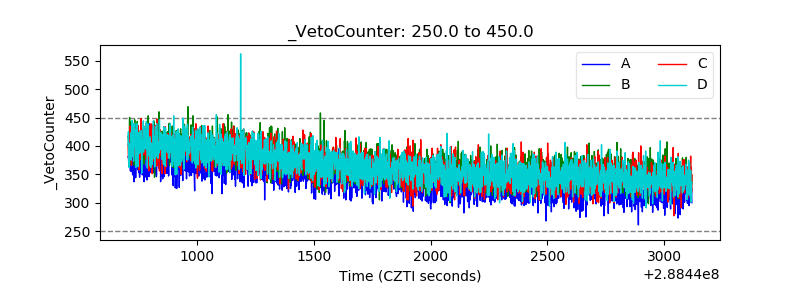 |