| Param | Original file | Final file |
|---|---|---|
| Filename | modeM0/AS1A05_094T01_9000002726cztM0_level2.fits | modeM0/AS1A05_094T01_9000002726cztM0_level2_quad_clean.evt |
| Size (bytes) | 431,377,920 | 370,235,520 |
| Size | 411.4 MB | 353.1 MB |
| Events in quadrant A | 2,653,604 | 2,139,243 |
| Events in quadrant B | 2,568,116 | 2,137,726 |
| Events in quadrant C | 2,576,070 | 2,003,069 |
| Events in quadrant D | 2,160,272 | 1,826,418 |
| Mode SS | |||
|---|---|---|---|
| Quadrant | BADHDUFLAG | Total packets | Discarded packets |
| A | 0 | 912 | 0 |
| B | 0 | 924 | 0 |
| C | 0 | 910 | 0 |
| D | 0 | 910 | 0 |
| Mode M9 | |||
|---|---|---|---|
| Quadrant | BADHDUFLAG | Total packets | Discarded packets |
| A | 0 | 119 | 0 |
| B | 0 | 119 | 0 |
| C | 0 | 119 | 0 |
| D | 0 | 119 | 0 |
| Mode M0 | |||
|---|---|---|---|
| Quadrant | BADHDUFLAG | Total packets | Discarded packets |
| A | 0 | 95822 | 0 |
| B | 0 | 96182 | 0 |
| C | 0 | 96663 | 0 |
| D | 0 | 106557 | 0 |
| Quadrant | Total seconds | Saturated seconds | Saturation percentage |
|---|---|---|---|
| A | 45319 | 727 | 1.604184% |
| B | 45335 | 717 | 1.581560% |
| C | 45176 | 1086 | 2.403931% |
| D | 45197 | 1444 | 3.194902% |
Noise dominated data is calculated using 1-second bins in cleaned event files. If a bin has >2000 counts, and if more than 50% of those come from <1% of pixels, then it is considered to be noise-dominated and hence unusable.
| Quadrant | # 1 sec bins | Bins with >0 counts | Bins with >2000 counts | High rate bins dominated by noise | Noise dominated (total time) | Noise dominated (detector-on time) | Marked lightcurve |
|---|---|---|---|---|---|---|---|
| A | 47274 | 41676 | 0 | 0 | 0.00% | 0.00% |  |
| B | 47272 | 41669 | 0 | 0 | 0.00% | 0.00% |  |
| C | 47273 | 41597 | 0 | 0 | 0.00% | 0.00% |  |
| D | 47273 | 41652 | 0 | 0 | 0.00% | 0.00% |  |
Top three noisy pixels from each quadrant. If the there are fewer than three noisy pixels in the level2.evt file, extra rows are filled as -1
| Pixel properties | Quadrant properties | ||||||
|---|---|---|---|---|---|---|---|
| Quadrant | DetID | PixID | Counts | Sigma | Mean | Median | Sigma |
| A | 0 | 29 | 2577 | 11.12 | 690 | 647 | 173.6 |
| A | 7 | 110 | 2149 | 8.65 | 690 | 647 | 173.6 |
| A | 9 | 19 | 2102 | 8.38 | 690 | 647 | 173.6 |
| B | 2 | 9 | 2020 | 10.16 | 678 | 647 | 135.1 |
| B | 2 | 8 | 1735 | 8.05 | 678 | 647 | 135.1 |
| B | 5 | 128 | 1700 | 7.79 | 678 | 647 | 135.1 |
| C | 1 | 81 | 1972 | 7.58 | 681 | 633 | 176.5 |
| C | 1 | 80 | 1964 | 7.54 | 681 | 633 | 176.5 |
| C | 12 | 241 | 1818 | 6.71 | 681 | 633 | 176.5 |
| D | 10 | 190 | 1628 | 6.53 | 617 | 563 | 163.2 |
| D | 10 | 189 | 1570 | 6.17 | 617 | 563 | 163.2 |
| D | 6 | 67 | 1560 | 6.11 | 617 | 563 | 163.2 |
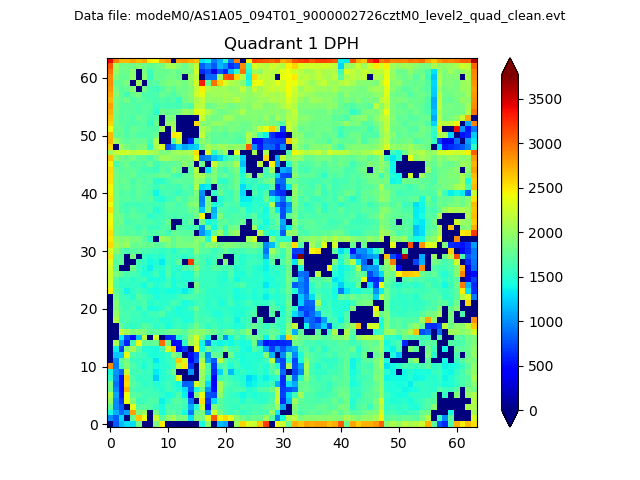
Histogram calculated using DETX and DETY for each event in the final _common_clean file
| Quadrant A |  |
 |
Quadrant B |
|---|---|---|---|
| Quadrant D | 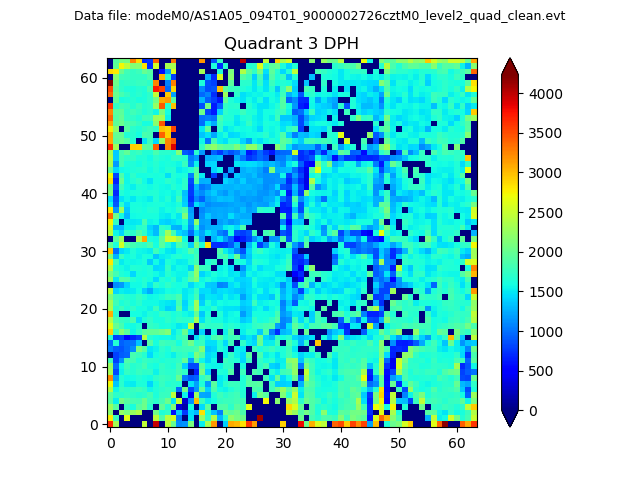 |
 |
Quadrant C |
| Plot type | Count rate plots | Images |
|---|---|---|
| Comparison with Poisson distribution Blue bars denote a histogram of data divided into 1 sec bins. Red curve is a Poisson curve with rate = median count rate of data. |
 |
 |
| Quadrant-wise count rates Data is divided into 100 sec bins |
 |
|
| Module-wise count rates for Quadrant A Data is divided into 100 sec bins |
 |
 |
| Module-wise count rates for Quadrant B Data is divided into 100 sec bins |
 |
 |
| Module-wise count rates for Quadrant C Data is divided into 100 sec bins |
 |
 |
| Module-wise count rates for Quadrant D Data is divided into 100 sec bins |
 |
 |
| Parameter | Plot |
|---|---|
| CZT HV Monitor |  |
| D_VDD |  |
| Temperature 1 |  |
| Veto HV Monitor |  |
| Veto LLD | 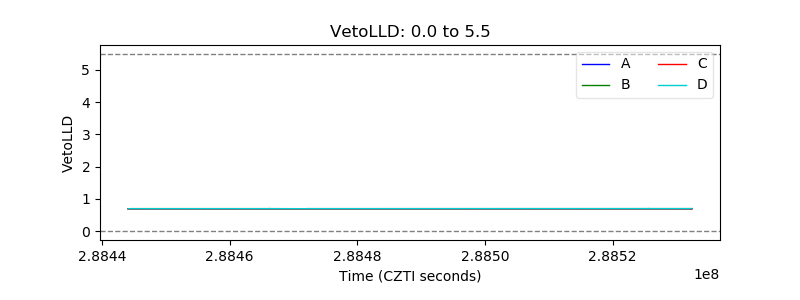 |
| Alpha Counter |  |
| _CPM_Rate | 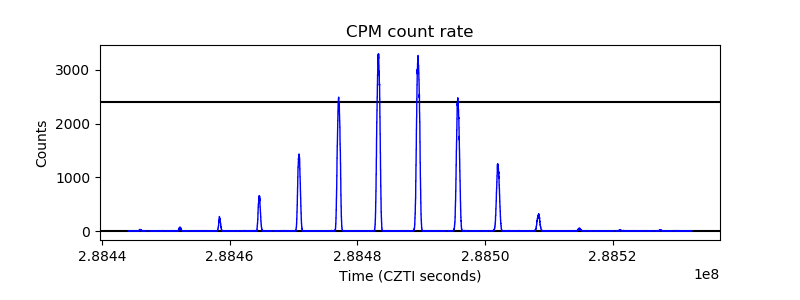 |
| CZT Counter |  |
| +2.5 Volts monitor |  |
| +5 Volts monitor |  |
| _ROLL_ROT |  |
| _Roll_DEC |  |
| _Roll_RA |  |
| Veto Counter |  |