| Param | Original file | Final file |
|---|---|---|
| Filename | modeM0/AS1A05_094T01_9000002726_18391cztM0_level2.evt | modeM0/AS1A05_094T01_9000002726_18391cztM0_level2_quad_clean.evt |
| Size (bytes) | 1,157,728,320 | 247,838,400 |
| Size | 1.1 GB | 236.4 MB |
| Events in quadrant A | 8,129,915 | 1,620,012 |
| Events in quadrant B | 8,491,544 | 1,628,350 |
| Events in quadrant C | 8,186,003 | 1,544,573 |
| Events in quadrant D | 9,069,979 | 1,507,251 |
| Mode SS | |||
|---|---|---|---|
| Quadrant | BADHDUFLAG | Total packets | Discarded packets |
| A | 0 | 356 | 0 |
| B | 0 | 356 | 0 |
| C | 0 | 356 | 0 |
| D | 0 | 356 | 0 |
| Mode M9 | |||
|---|---|---|---|
| Quadrant | BADHDUFLAG | Total packets | Discarded packets |
| A | 0 | 21 | 0 |
| B | 0 | 21 | 0 |
| C | 0 | 21 | 0 |
| D | 0 | 21 | 0 |
| Mode M0 | |||
|---|---|---|---|
| Quadrant | BADHDUFLAG | Total packets | Discarded packets |
| A | 0 | 36006 | 3 |
| B | 0 | 36654 | 3 |
| C | 0 | 35752 | 3 |
| D | 0 | 38693 | 4 |
| Quadrant | Total seconds | Saturated seconds | Saturation percentage |
|---|---|---|---|
| A | 17505 | 173 | 0.988289% |
| B | 17506 | 196 | 1.119616% |
| C | 17506 | 209 | 1.193876% |
| D | 17505 | 197 | 1.125393% |
Noise dominated data is calculated using 1-second bins in cleaned event files. If a bin has >2000 counts, and if more than 50% of those come from <1% of pixels, then it is considered to be noise-dominated and hence unusable.
| Quadrant | # 1 sec bins | Bins with >0 counts | Bins with >2000 counts | High rate bins dominated by noise | Noise dominated (total time) | Noise dominated (detector-on time) | Marked lightcurve |
|---|---|---|---|---|---|---|---|
| A | 19550 | 17508 | 2 | 2 | 0.01% | 0.01% | 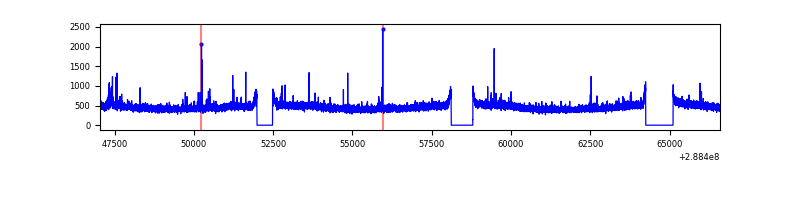 |
| B | 19551 | 17509 | 20 | 20 | 0.10% | 0.11% | 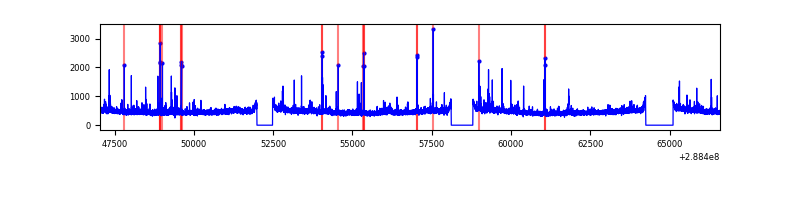 |
| C | 19551 | 17509 | 0 | 0 | 0.00% | 0.00% | 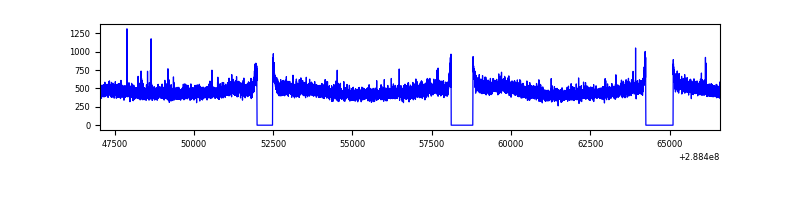 |
| D | 19550 | 17507 | 51 | 51 | 0.26% | 0.29% | 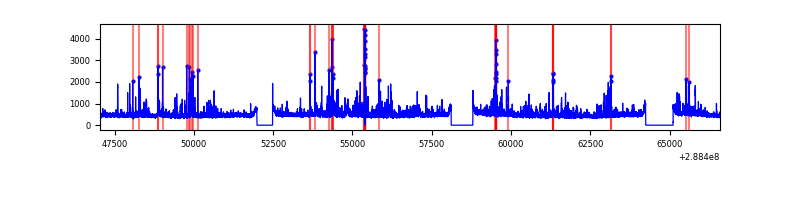 |
Top three noisy pixels from each quadrant. If the there are fewer than three noisy pixels in the level2.evt file, extra rows are filled as -1
| Pixel properties | Quadrant properties | ||||||
|---|---|---|---|---|---|---|---|
| Quadrant | DetID | PixID | Counts | Sigma | Mean | Median | Sigma |
| A | 15 | 174 | 101750 | 237.84 | 2080 | 2036 | 419.2 |
| A | 4 | 2 | 25435 | 55.81 | 2080 | 2036 | 419.2 |
| A | 0 | 226 | 18200 | 38.55 | 2080 | 2036 | 419.2 |
| B | 10 | 245 | 68336 | 169.5 | 2075 | 2024 | 391.2 |
| B | 3 | 64 | 68277 | 169.35 | 2075 | 2024 | 391.2 |
| B | 0 | 183 | 51660 | 126.88 | 2075 | 2024 | 391.2 |
| C | 14 | 238 | 306151 | 650.0 | 1993 | 2006 | 467.9 |
| C | 3 | 233 | 80733 | 168.25 | 1993 | 2006 | 467.9 |
| C | 13 | 61 | 14219 | 26.1 | 1993 | 2006 | 467.9 |
| D | 1 | 52 | 1072363 | 2192.77 | 2016 | 1958 | 488.2 |
| D | 2 | 152 | 136652 | 275.93 | 2016 | 1958 | 488.2 |
| D | 2 | 234 | 80093 | 160.06 | 2016 | 1958 | 488.2 |
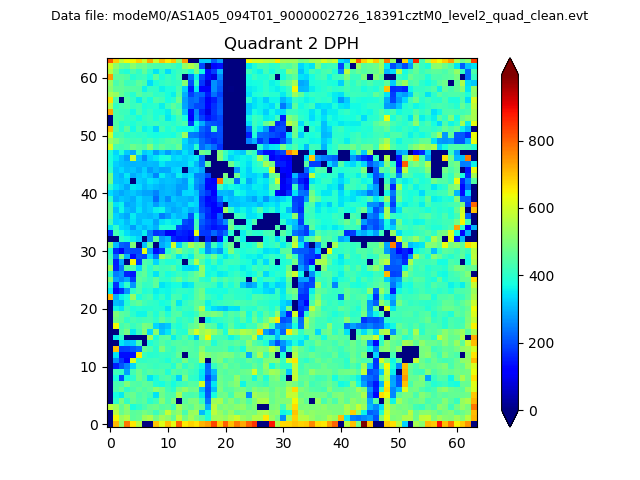
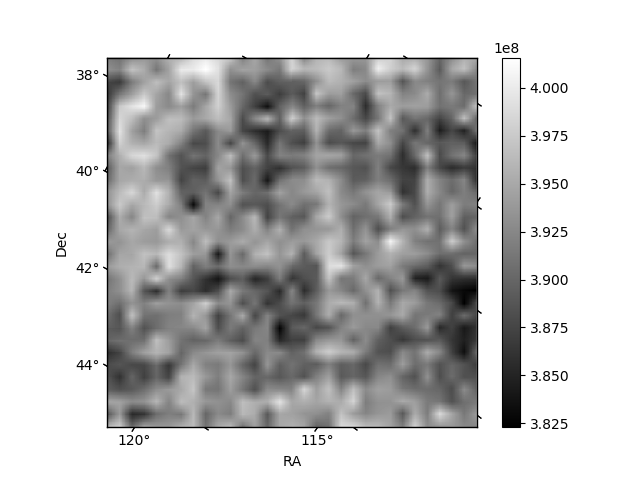
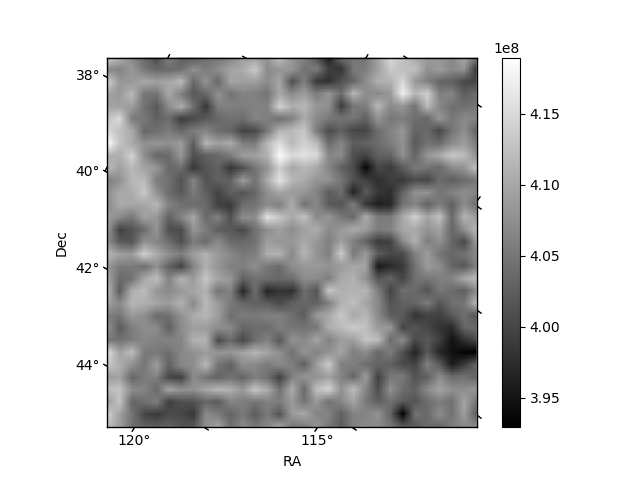
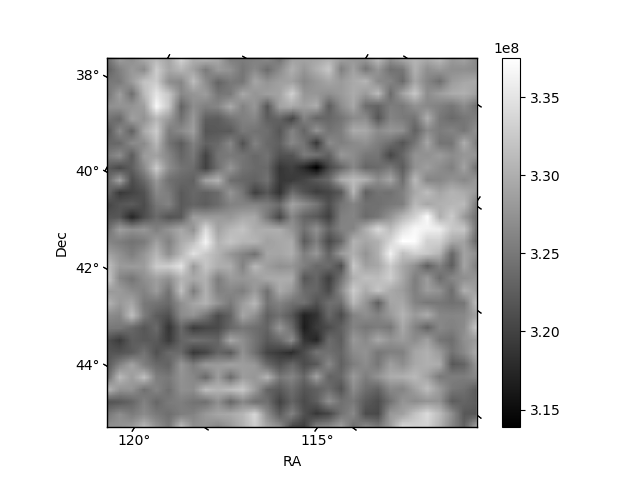
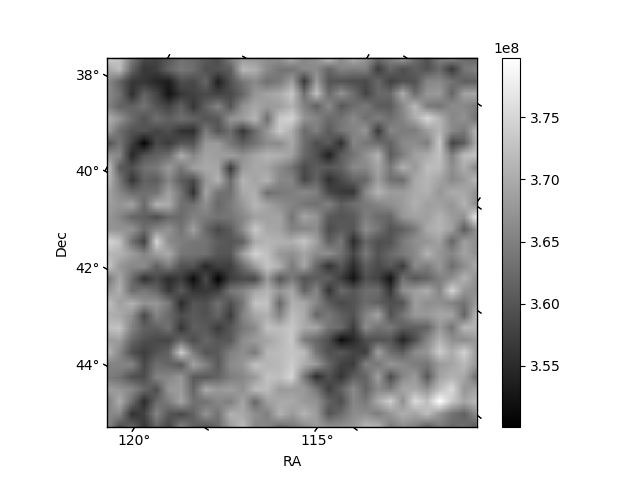
Histogram calculated using DETX and DETY for each event in the final _common_clean file
| Quadrant A | 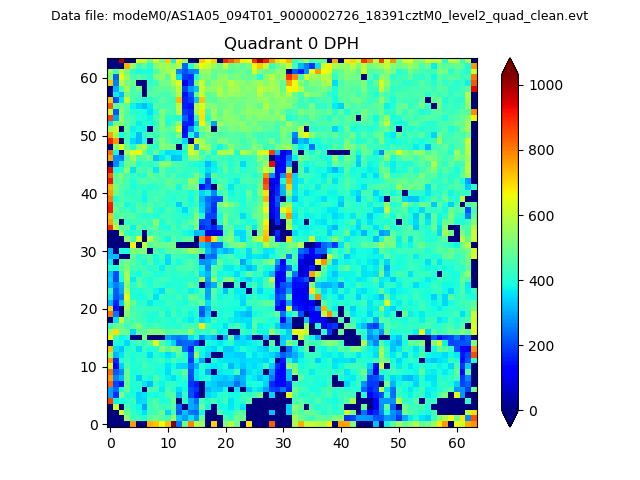 |
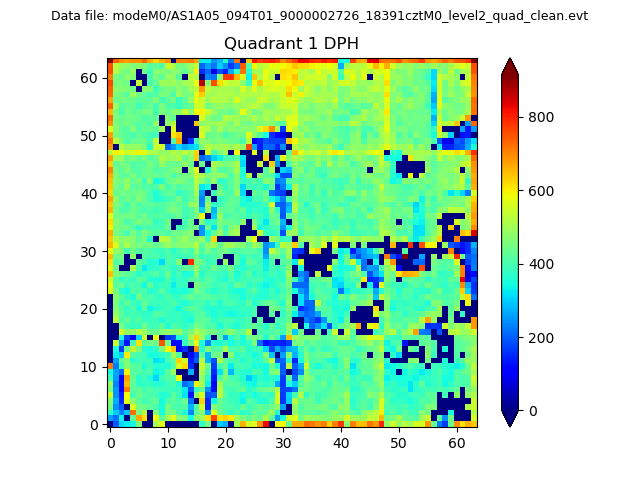 |
Quadrant B |
|---|---|---|---|
| Quadrant D | 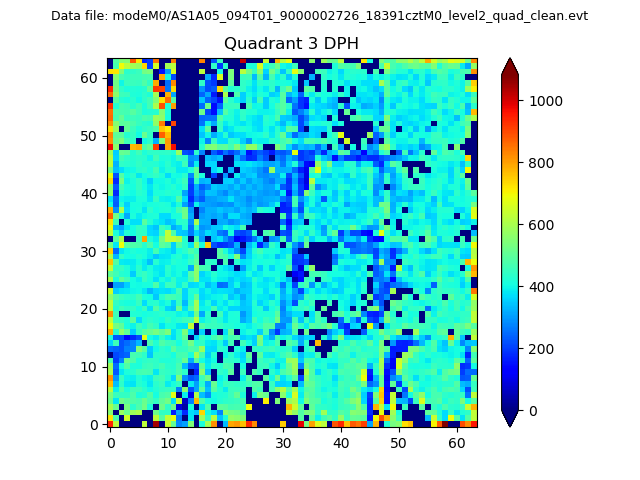 |
 |
Quadrant C |
| Plot type | Count rate plots | Images |
|---|---|---|
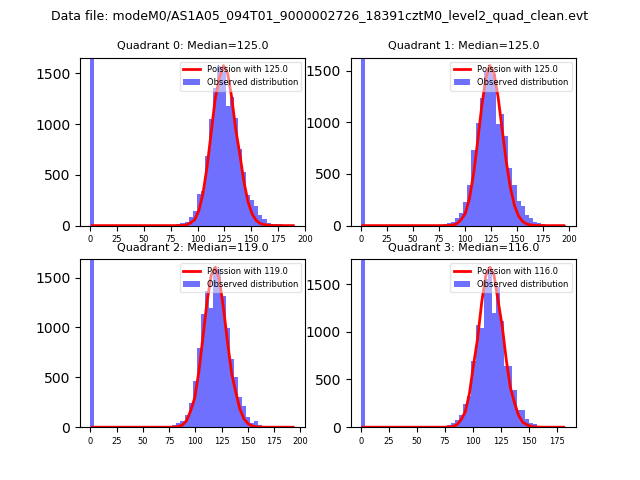
| Comparison with Poisson distribution Blue bars denote a histogram of data divided into 1 sec bins. Red curve is a Poisson curve with rate = median count rate of data. |
 |
 |
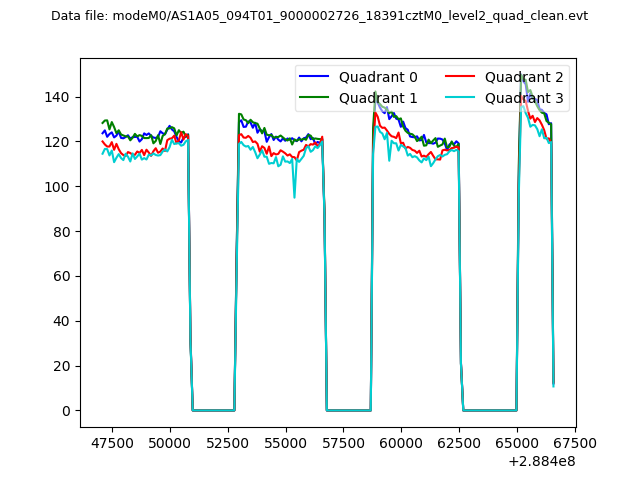
| Quadrant-wise count rates Data is divided into 100 sec bins |
 |
|
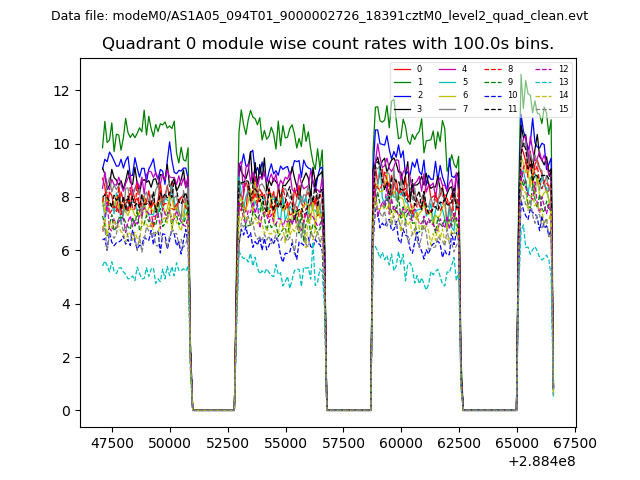
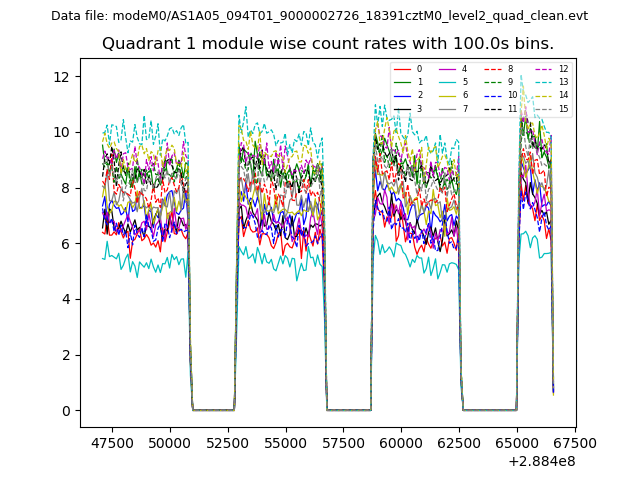
| Module-wise count rates for Quadrant A Data is divided into 100 sec bins |
 |
 |
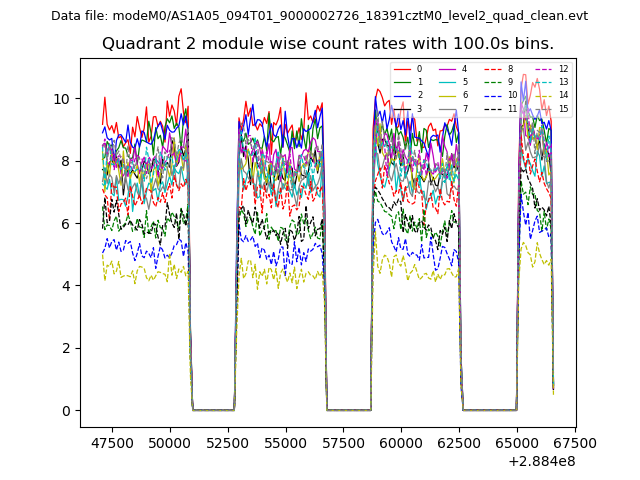
| Module-wise count rates for Quadrant B Data is divided into 100 sec bins |
 |
 |
| Module-wise count rates for Quadrant C Data is divided into 100 sec bins |
 |
 |
| Module-wise count rates for Quadrant D Data is divided into 100 sec bins |
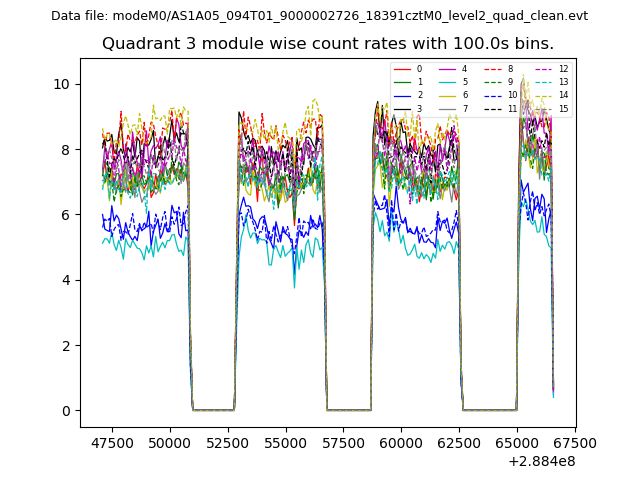 |
 |
| Parameter | Plot |
|---|---|
| CZT HV Monitor | 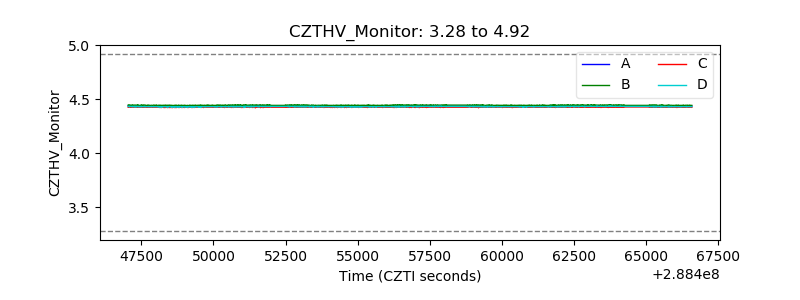 |
| D_VDD | 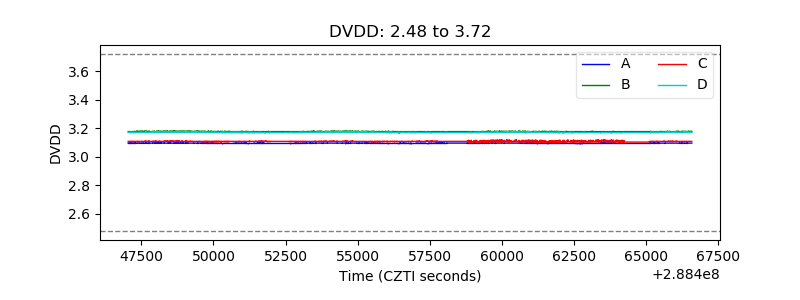 |
| Temperature 1 | 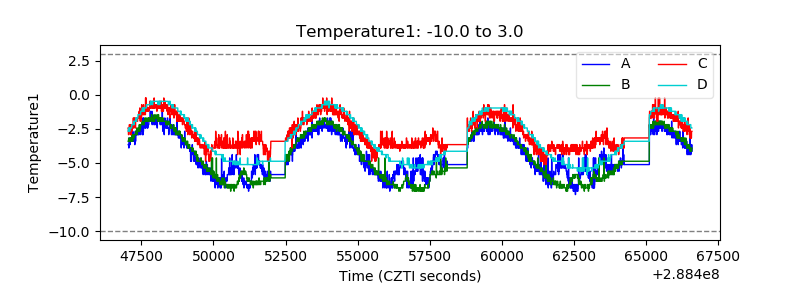 |
| Veto HV Monitor | 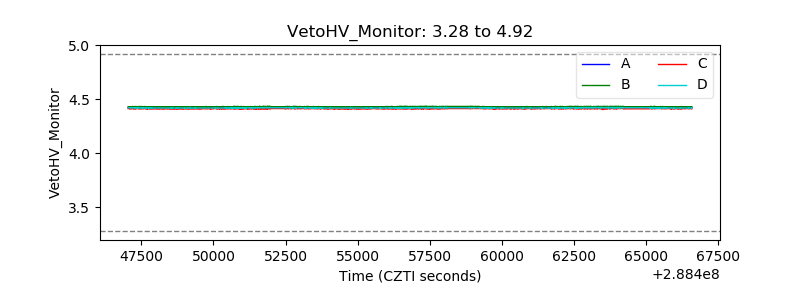 |
| Veto LLD | 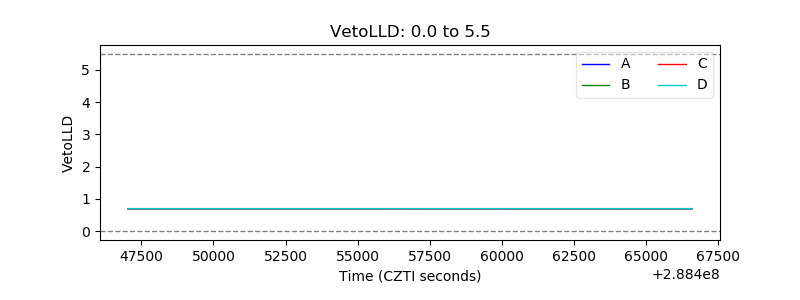 |
| Alpha Counter | 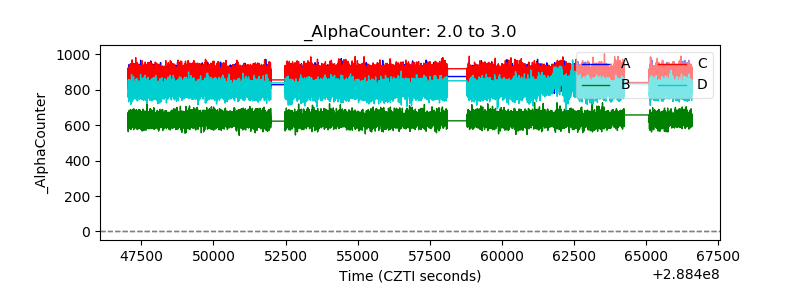 |
| _CPM_Rate | 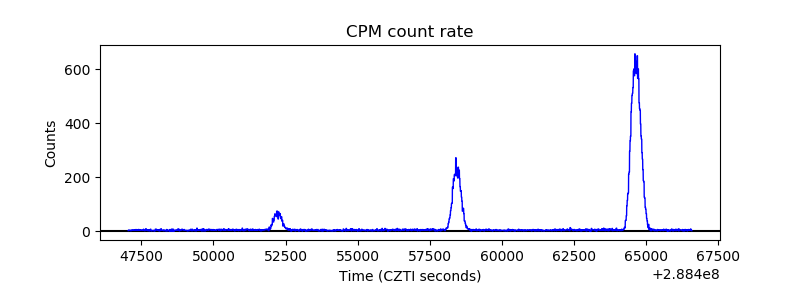 |
| CZT Counter |  |
| +2.5 Volts monitor |  |
| +5 Volts monitor |  |
| _ROLL_ROT | 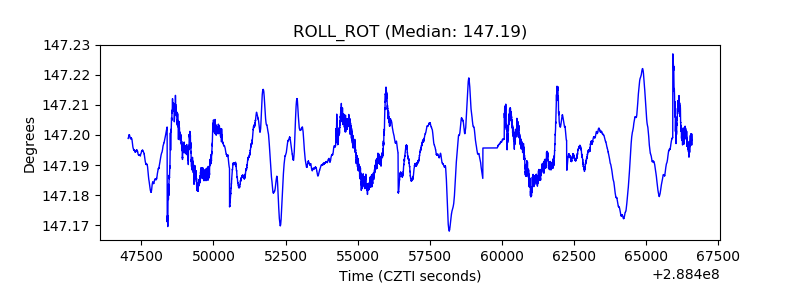 |
| _Roll_DEC | 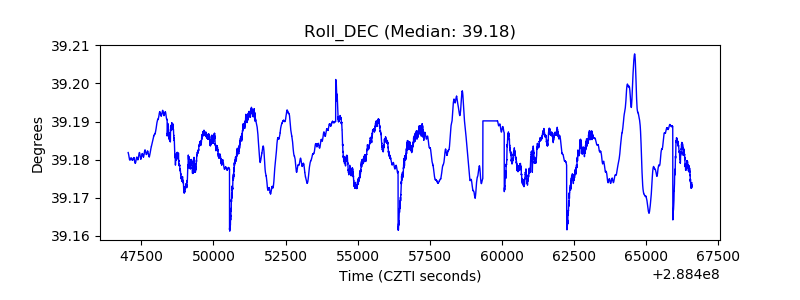 |
| _Roll_RA | 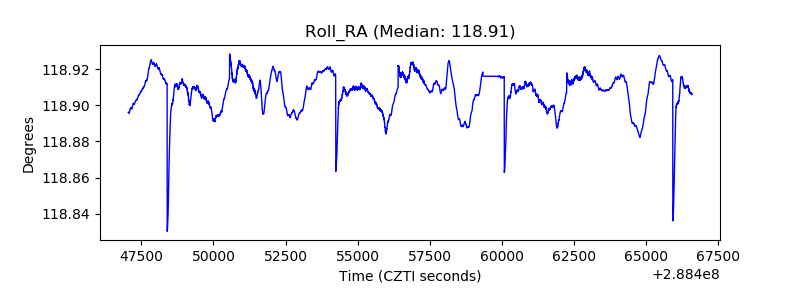 |
| Veto Counter |  |