| Param | Original file | Final file |
|---|---|---|
| Filename | modeM0/AS1A05_094T01_9000002726_18397cztM0_level2.evt | modeM0/AS1A05_094T01_9000002726_18397cztM0_level2_quad_clean.evt |
| Size (bytes) | 451,961,280 | 93,565,440 |
| Size | 431.0 MB | 89.2 MB |
| Events in quadrant A | 3,207,471 | 614,863 |
| Events in quadrant B | 3,193,041 | 636,125 |
| Events in quadrant C | 3,086,730 | 595,628 |
| Events in quadrant D | 3,780,483 | 555,340 |
| Mode SS | |||
|---|---|---|---|
| Quadrant | BADHDUFLAG | Total packets | Discarded packets |
| A | 0 | 126 | 0 |
| B | 0 | 126 | 0 |
| C | 0 | 126 | 0 |
| D | 0 | 126 | 0 |
| Mode M9 | |||
|---|---|---|---|
| Quadrant | BADHDUFLAG | Total packets | Discarded packets |
| A | 0 | 22 | 0 |
| B | 0 | 23 | 0 |
| C | 0 | 23 | 0 |
| D | 0 | 23 | 0 |
| Mode M0 | |||
|---|---|---|---|
| Quadrant | BADHDUFLAG | Total packets | Discarded packets |
| A | 0 | 13184 | 2 |
| B | 0 | 13215 | 2 |
| C | 0 | 12942 | 2 |
| D | 0 | 15361 | 2 |
| Quadrant | Total seconds | Saturated seconds | Saturation percentage |
|---|---|---|---|
| A | 6181 | 32 | 0.517716% |
| B | 6181 | 31 | 0.501537% |
| C | 6181 | 49 | 0.792752% |
| D | 6181 | 187 | 3.025400% |
Noise dominated data is calculated using 1-second bins in cleaned event files. If a bin has >2000 counts, and if more than 50% of those come from <1% of pixels, then it is considered to be noise-dominated and hence unusable.
| Quadrant | # 1 sec bins | Bins with >0 counts | Bins with >2000 counts | High rate bins dominated by noise | Noise dominated (total time) | Noise dominated (detector-on time) | Marked lightcurve |
|---|---|---|---|---|---|---|---|
| A | 7572 | 6182 | 16 | 16 | 0.21% | 0.26% | 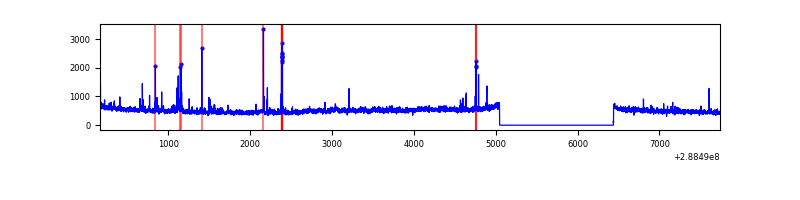 |
| B | 7572 | 6182 | 10 | 10 | 0.13% | 0.16% | 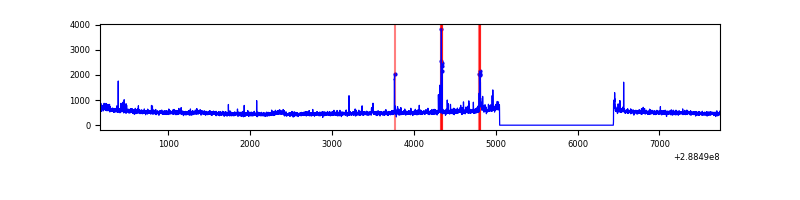 |
| C | 7572 | 6182 | 0 | 0 | 0.00% | 0.00% | 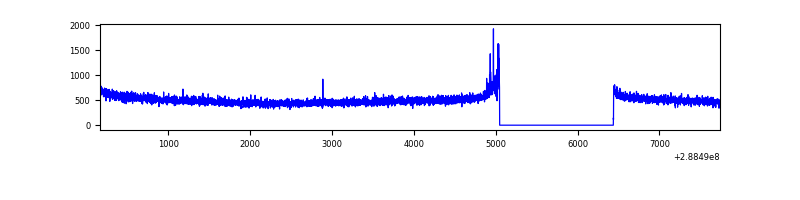 |
| D | 7572 | 6182 | 171 | 171 | 2.26% | 2.77% | 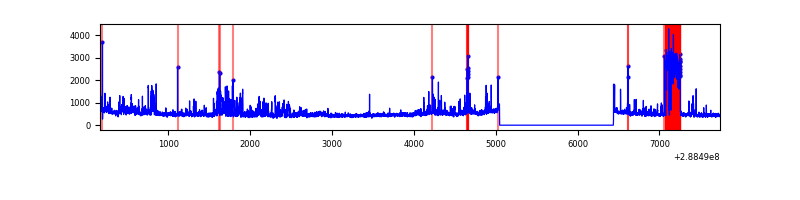 |
Top three noisy pixels from each quadrant. If the there are fewer than three noisy pixels in the level2.evt file, extra rows are filled as -1
| Pixel properties | Quadrant properties | ||||||
|---|---|---|---|---|---|---|---|
| Quadrant | DetID | PixID | Counts | Sigma | Mean | Median | Sigma |
| A | 8 | 34 | 112968 | 730.67 | 777 | 763 | 153.6 |
| A | 4 | 2 | 104203 | 673.6 | 777 | 763 | 153.6 |
| A | 0 | 226 | 6675 | 38.5 | 777 | 763 | 153.6 |
| B | 3 | 64 | 47846 | 324.76 | 786 | 768 | 145.0 |
| B | 12 | 18 | 19002 | 125.78 | 786 | 768 | 145.0 |
| B | 10 | 245 | 18579 | 122.87 | 786 | 768 | 145.0 |
| C | 14 | 238 | 118029 | 667.81 | 752 | 759 | 175.6 |
| C | 0 | 207 | 29222 | 162.09 | 752 | 759 | 175.6 |
| C | 13 | 61 | 5321 | 25.98 | 752 | 759 | 175.6 |
| D | 7 | 238 | 485018 | 2713.8 | 736 | 715 | 178.5 |
| D | 1 | 52 | 363731 | 2034.17 | 736 | 715 | 178.5 |
| D | 14 | 34 | 47335 | 261.24 | 736 | 715 | 178.5 |
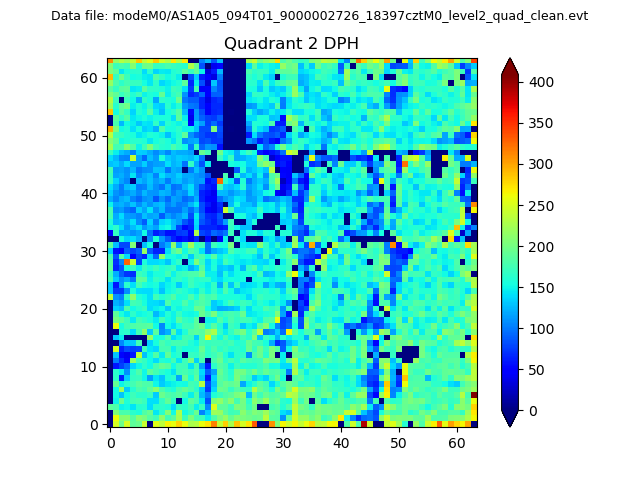
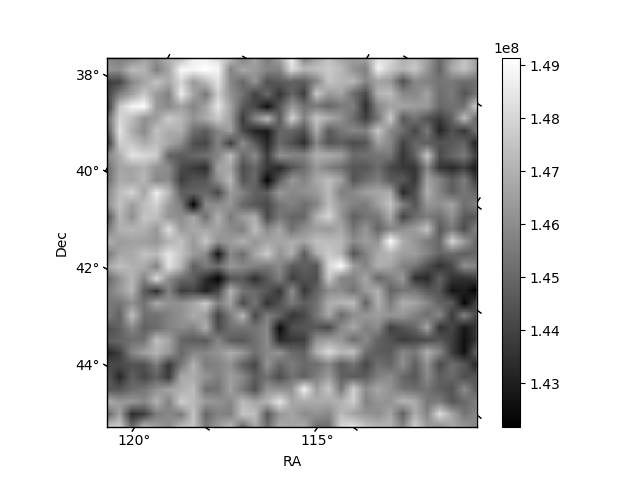
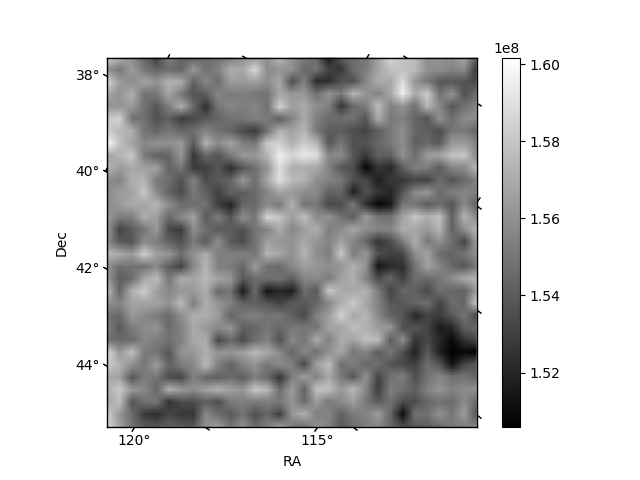
Histogram calculated using DETX and DETY for each event in the final _common_clean file
| Quadrant A | 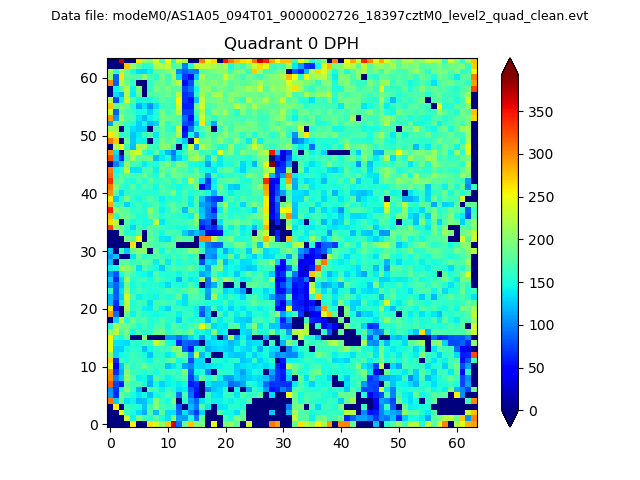 |
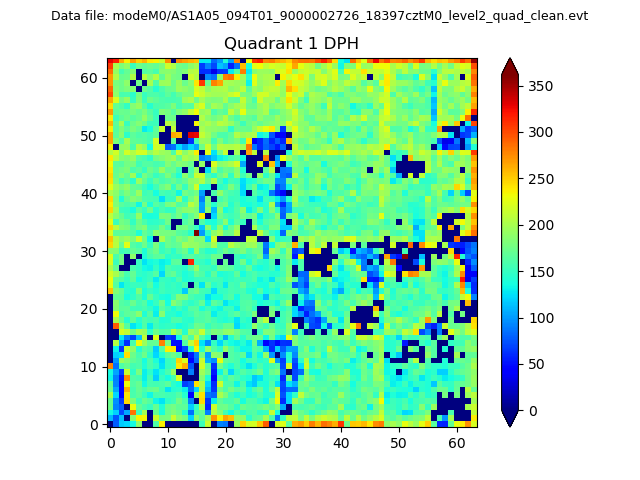 |
Quadrant B |
|---|---|---|---|
| Quadrant D | 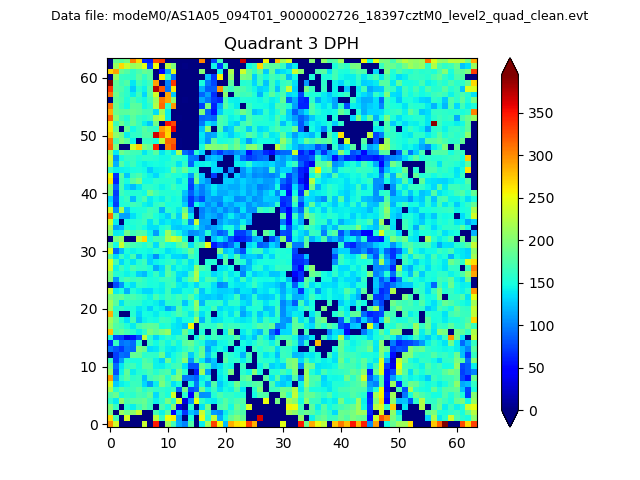 |
 |
Quadrant C |
| Plot type | Count rate plots | Images |
|---|---|---|
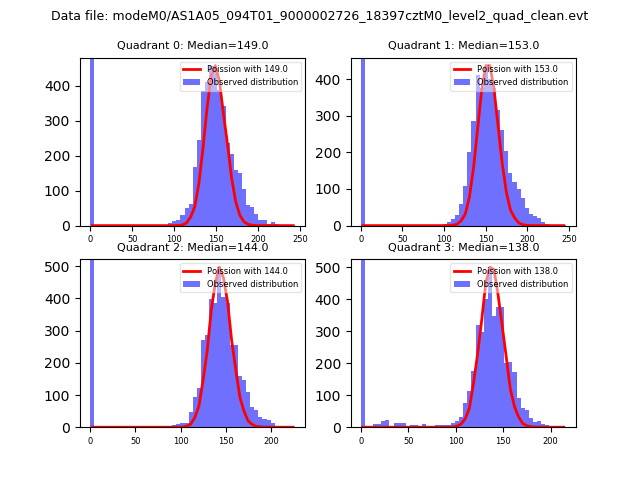
| Comparison with Poisson distribution Blue bars denote a histogram of data divided into 1 sec bins. Red curve is a Poisson curve with rate = median count rate of data. |
 |
 |
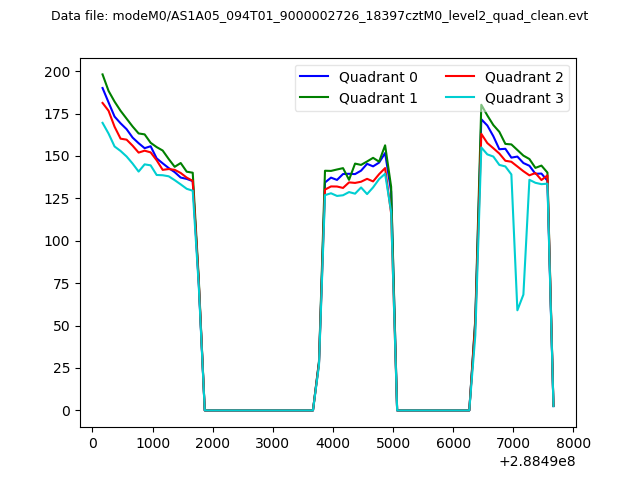
| Quadrant-wise count rates Data is divided into 100 sec bins |
 |
|
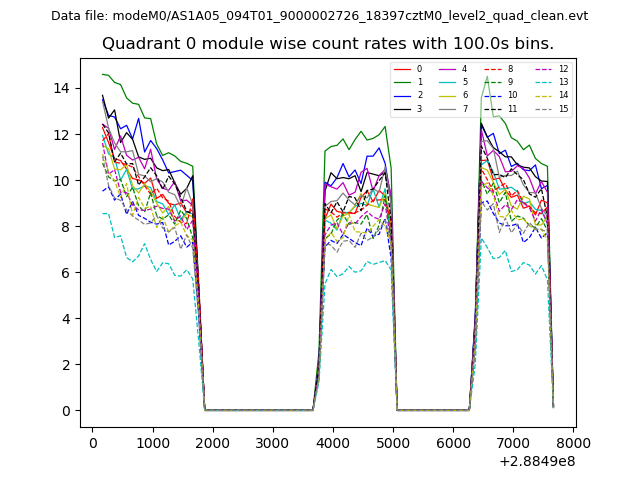
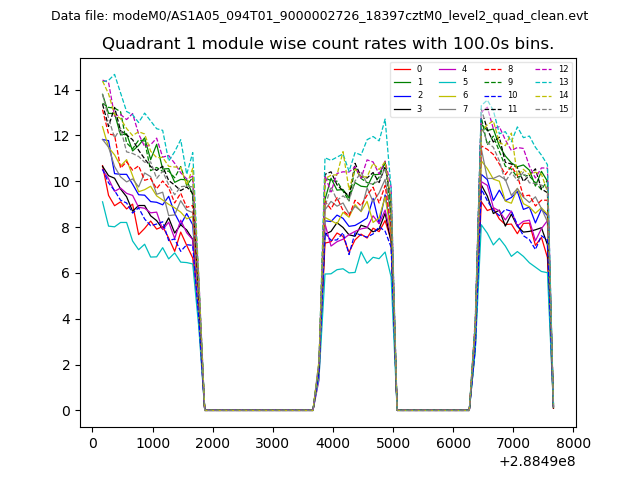
| Module-wise count rates for Quadrant A Data is divided into 100 sec bins |
 |
 |
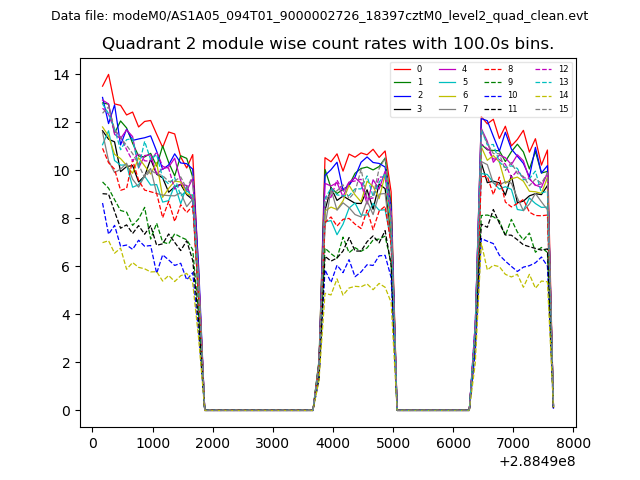
| Module-wise count rates for Quadrant B Data is divided into 100 sec bins |
 |
 |
| Module-wise count rates for Quadrant C Data is divided into 100 sec bins |
 |
 |
| Module-wise count rates for Quadrant D Data is divided into 100 sec bins |
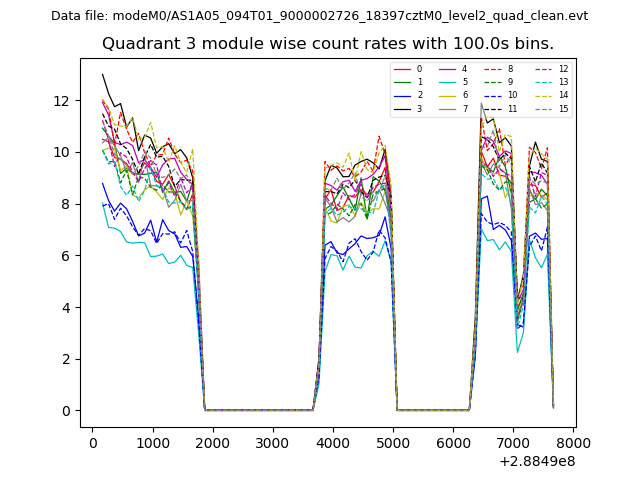 |
 |
| Parameter | Plot |
|---|---|
| CZT HV Monitor | 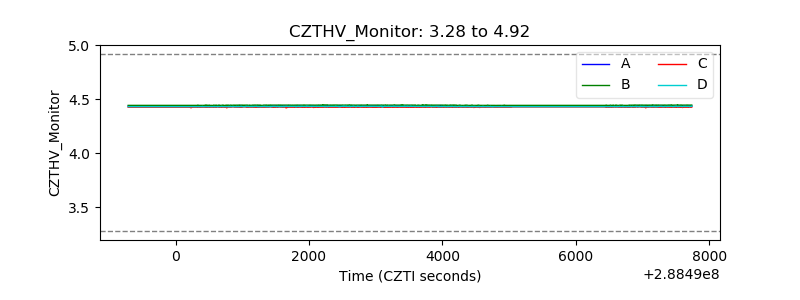 |
| D_VDD | 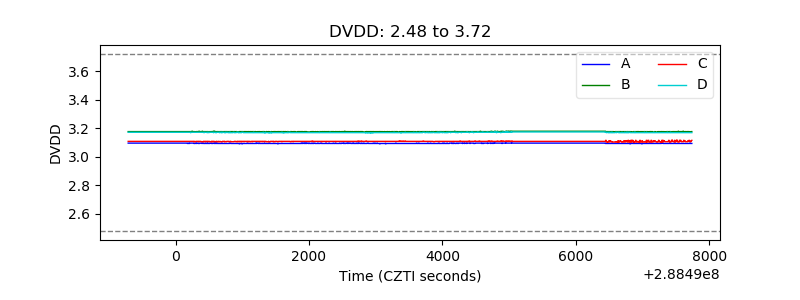 |
| Temperature 1 | 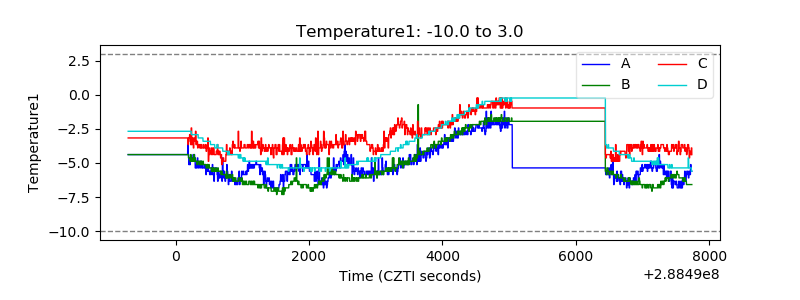 |
| Veto HV Monitor | 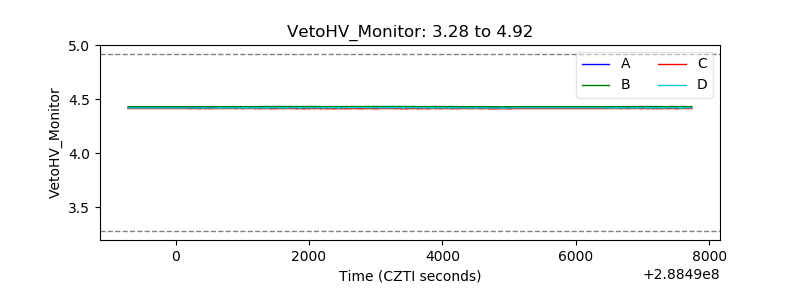 |
| Veto LLD | 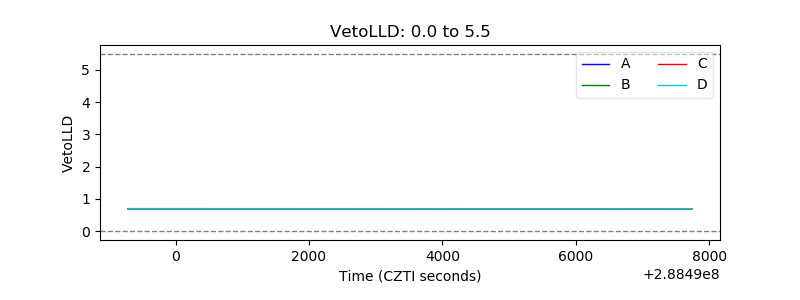 |
| Alpha Counter | 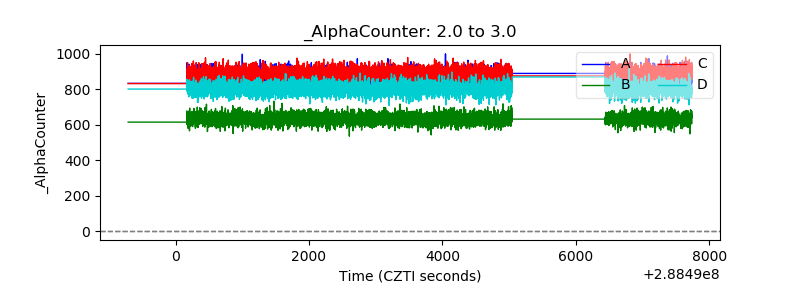 |
| _CPM_Rate | 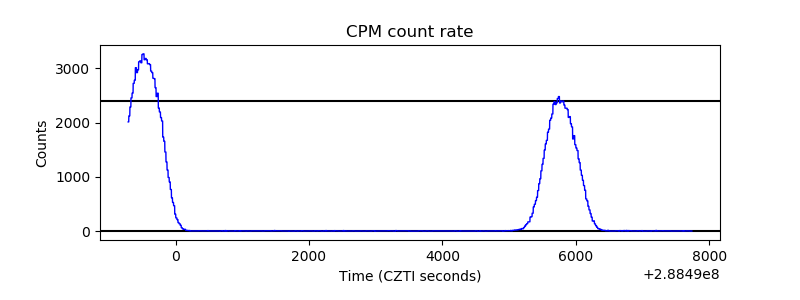 |
| CZT Counter | 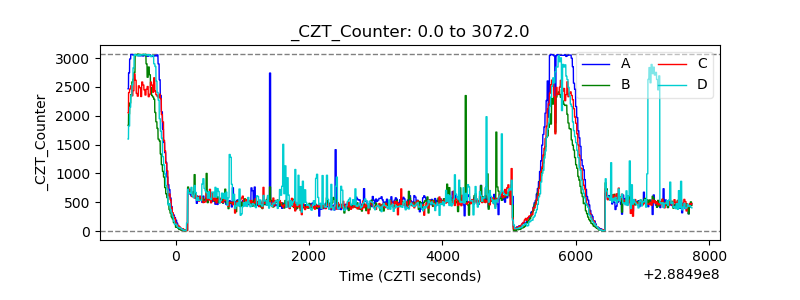 |
| +2.5 Volts monitor |  |
| +5 Volts monitor |  |
| _ROLL_ROT | 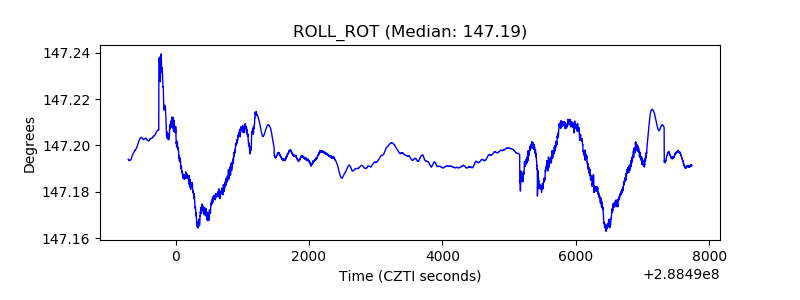 |
| _Roll_DEC | 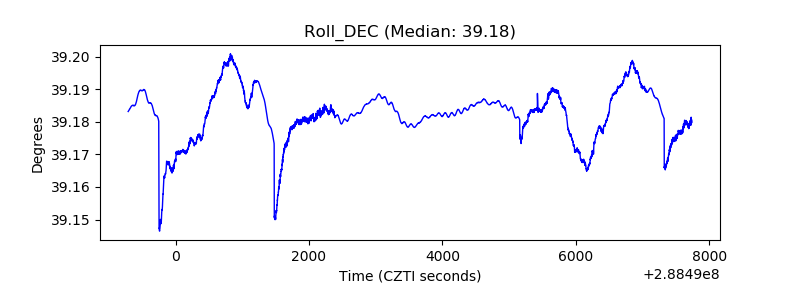 |
| _Roll_RA | 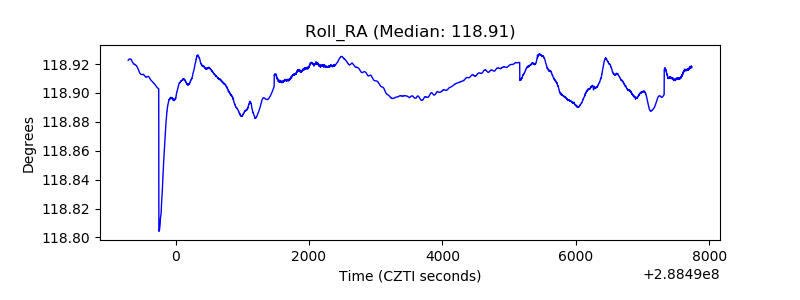 |
| Veto Counter | 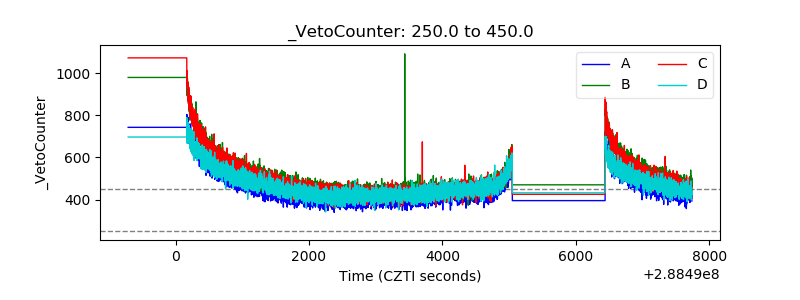 |