| Param | Original file | Final file |
|---|---|---|
| Filename | modeM0/AS1A05_094T01_9000002726_18398cztM0_level2.evt | modeM0/AS1A05_094T01_9000002726_18398cztM0_level2_quad_clean.evt |
| Size (bytes) | 430,804,800 | 84,415,680 |
| Size | 410.8 MB | 80.5 MB |
| Events in quadrant A | 3,038,843 | 545,515 |
| Events in quadrant B | 3,084,717 | 561,246 |
| Events in quadrant C | 3,005,543 | 525,840 |
| Events in quadrant D | 3,498,571 | 493,161 |
| Mode SS | |||
|---|---|---|---|
| Quadrant | BADHDUFLAG | Total packets | Discarded packets |
| A | 0 | 126 | 0 |
| B | 0 | 126 | 0 |
| C | 0 | 126 | 0 |
| D | 0 | 126 | 0 |
| Mode M9 | |||
|---|---|---|---|
| Quadrant | BADHDUFLAG | Total packets | Discarded packets |
| A | 0 | 19 | 0 |
| B | 0 | 20 | 0 |
| C | 0 | 20 | 0 |
| D | 0 | 20 | 0 |
| Mode M0 | |||
|---|---|---|---|
| Quadrant | BADHDUFLAG | Total packets | Discarded packets |
| A | 0 | 12906 | 2 |
| B | 0 | 12948 | 2 |
| C | 0 | 12736 | 3 |
| D | 0 | 14583 | 2 |
| Quadrant | Total seconds | Saturated seconds | Saturation percentage |
|---|---|---|---|
| A | 6166 | 36 | 0.583847% |
| B | 6166 | 41 | 0.664937% |
| C | 6165 | 35 | 0.567721% |
| D | 6165 | 192 | 3.114355% |
Noise dominated data is calculated using 1-second bins in cleaned event files. If a bin has >2000 counts, and if more than 50% of those come from <1% of pixels, then it is considered to be noise-dominated and hence unusable.
| Quadrant | # 1 sec bins | Bins with >0 counts | Bins with >2000 counts | High rate bins dominated by noise | Noise dominated (total time) | Noise dominated (detector-on time) | Marked lightcurve |
|---|---|---|---|---|---|---|---|
| A | 7456 | 6167 | 10 | 10 | 0.13% | 0.16% | 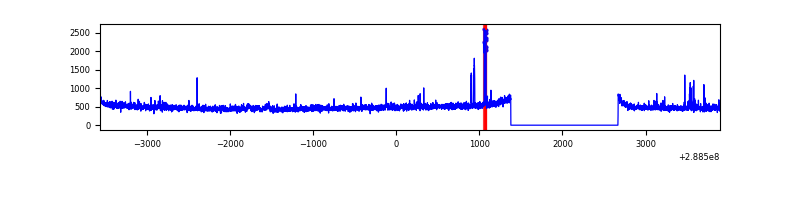 |
| B | 7456 | 6167 | 3 | 3 | 0.04% | 0.05% | 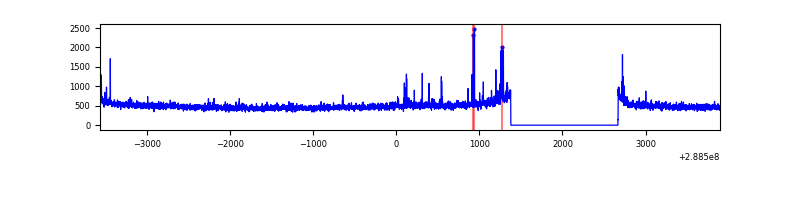 |
| C | 7455 | 6166 | 0 | 0 | 0.00% | 0.00% | 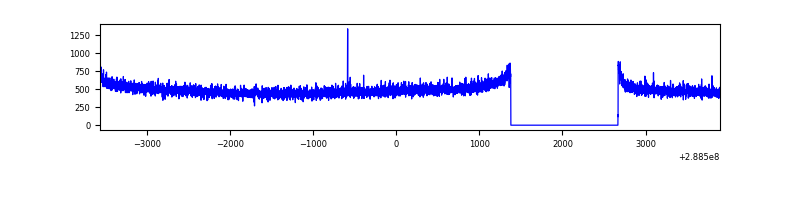 |
| D | 7455 | 6166 | 171 | 171 | 2.29% | 2.77% | 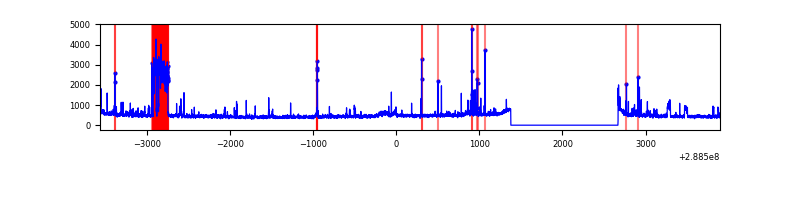 |
Top three noisy pixels from each quadrant. If the there are fewer than three noisy pixels in the level2.evt file, extra rows are filled as -1
| Pixel properties | Quadrant properties | ||||||
|---|---|---|---|---|---|---|---|
| Quadrant | DetID | PixID | Counts | Sigma | Mean | Median | Sigma |
| A | 15 | 174 | 50024 | 323.37 | 763 | 748 | 152.4 |
| A | 4 | 2 | 33168 | 212.75 | 763 | 748 | 152.4 |
| A | 8 | 34 | 22198 | 140.76 | 763 | 748 | 152.4 |
| B | 3 | 64 | 49302 | 335.41 | 769 | 751 | 144.8 |
| B | 7 | 220 | 18445 | 122.24 | 769 | 751 | 144.8 |
| B | 12 | 111 | 16346 | 107.74 | 769 | 751 | 144.8 |
| C | 14 | 238 | 116050 | 671.64 | 735 | 742 | 171.7 |
| C | 8 | 128 | 11717 | 63.93 | 735 | 742 | 171.7 |
| C | 8 | 112 | 5446 | 27.4 | 735 | 742 | 171.7 |
| D | 7 | 238 | 502172 | 2848.42 | 722 | 700 | 176.1 |
| D | 1 | 52 | 122808 | 693.59 | 722 | 700 | 176.1 |
| D | 12 | 110 | 59049 | 331.43 | 722 | 700 | 176.1 |
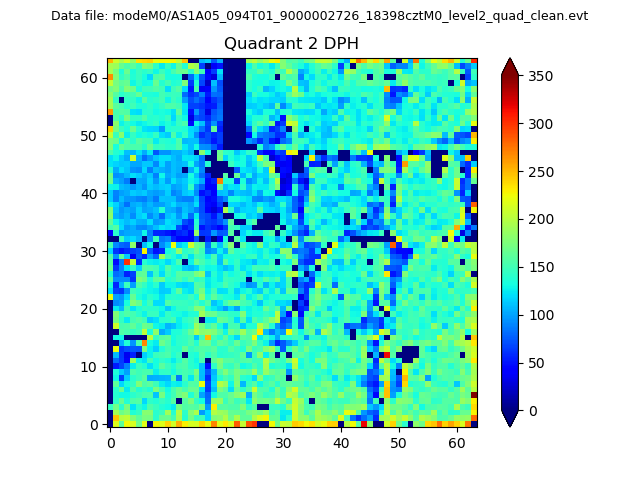
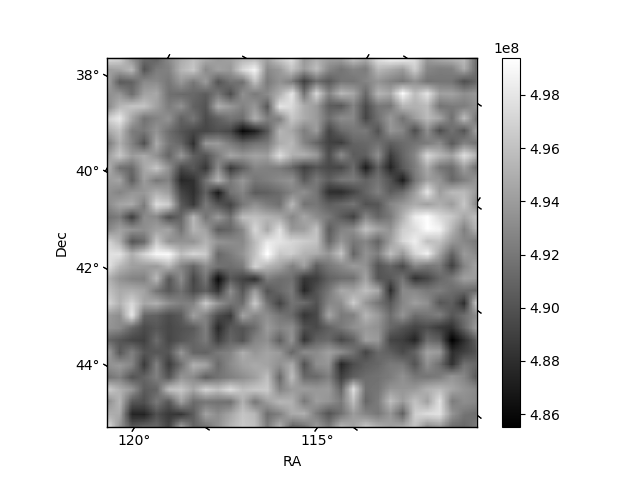
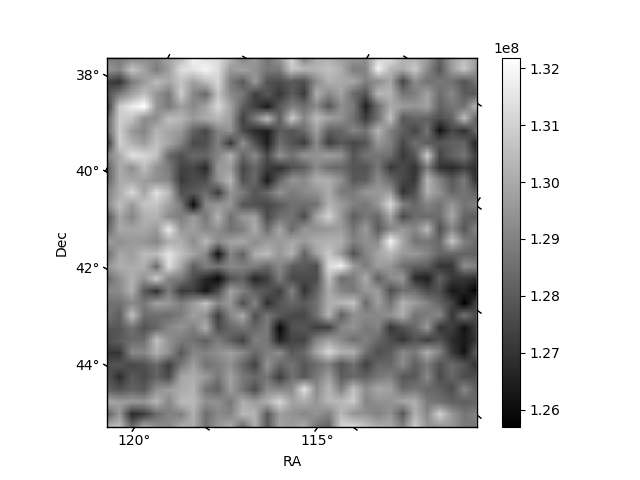
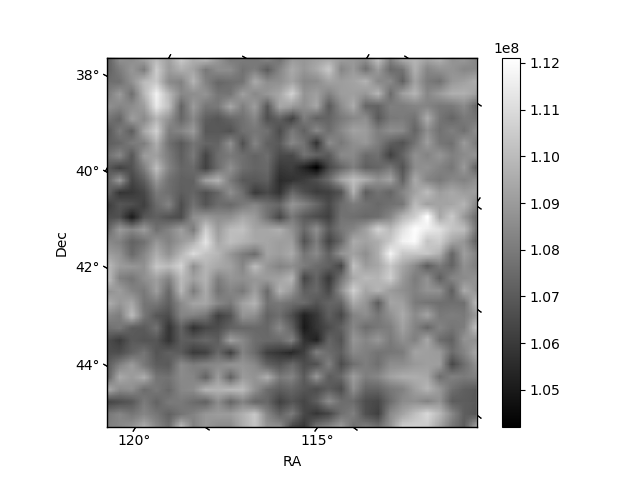
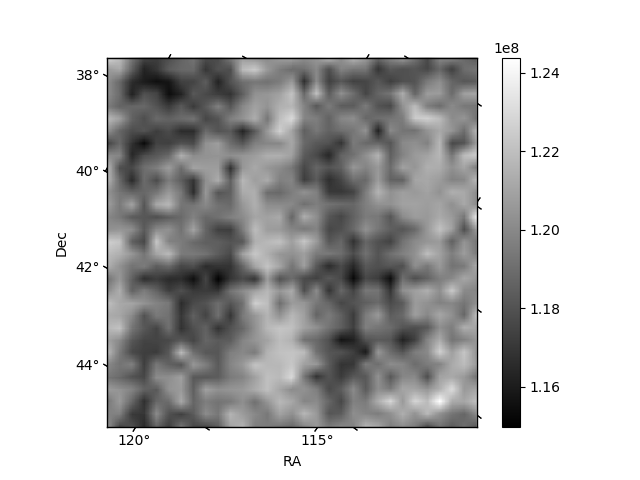
Histogram calculated using DETX and DETY for each event in the final _common_clean file
| Quadrant A | 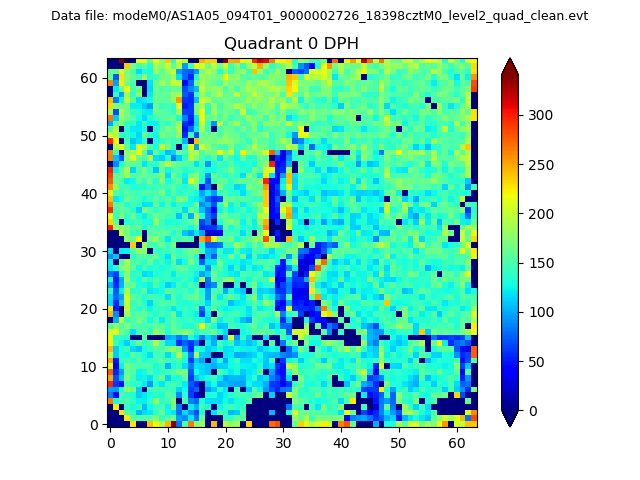 |
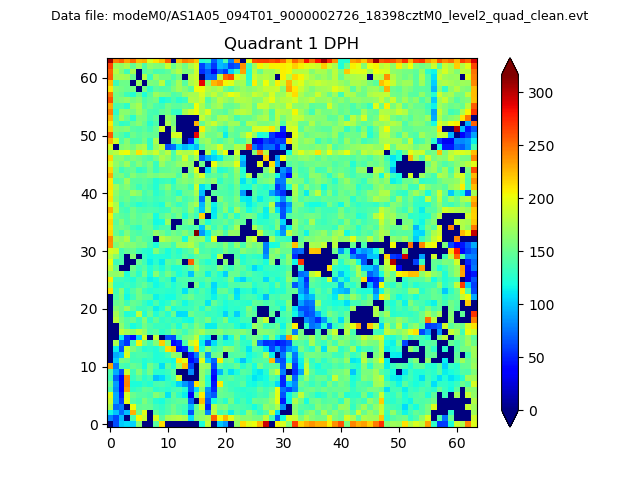 |
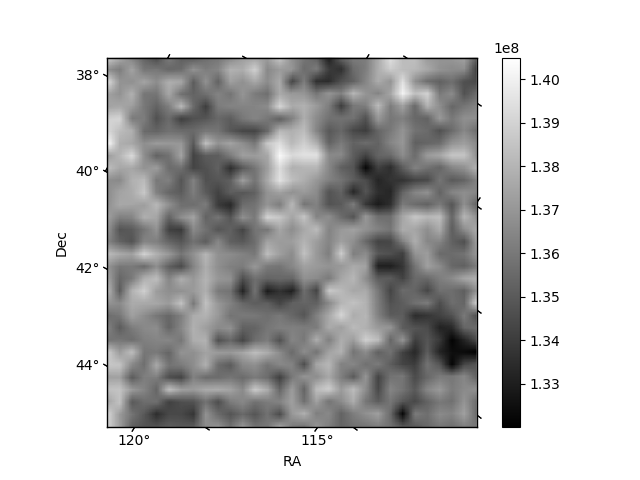
Quadrant B |
|---|---|---|---|
| Quadrant D | 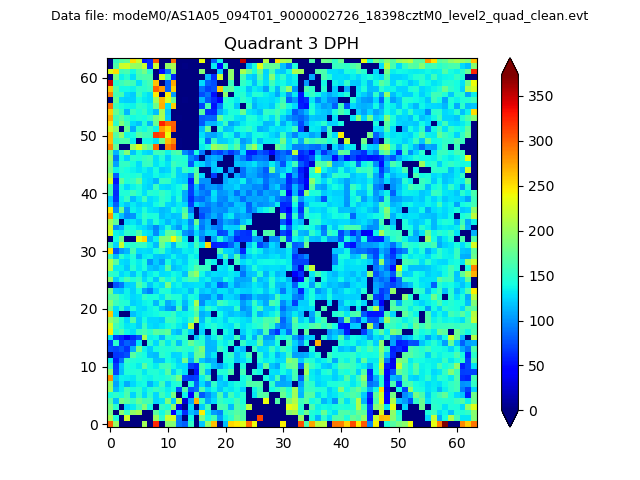 |
 |
Quadrant C |
| Plot type | Count rate plots | Images |
|---|---|---|
| Comparison with Poisson distribution Blue bars denote a histogram of data divided into 1 sec bins. Red curve is a Poisson curve with rate = median count rate of data. |
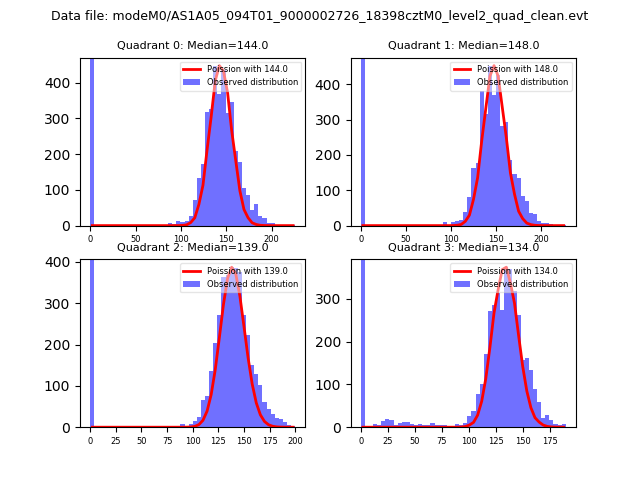 |
 |
| Quadrant-wise count rates Data is divided into 100 sec bins |
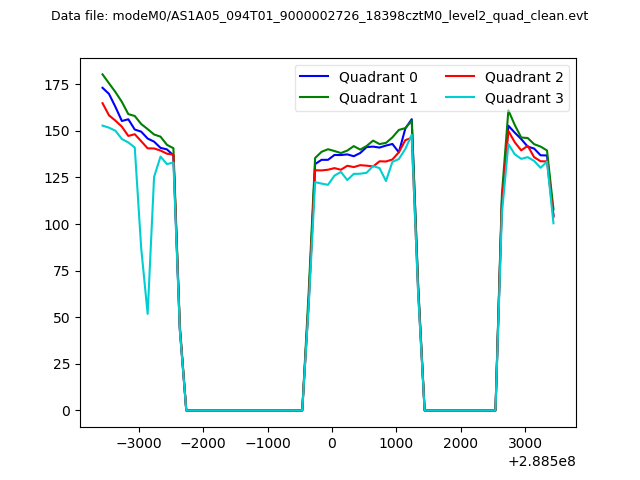 |
|
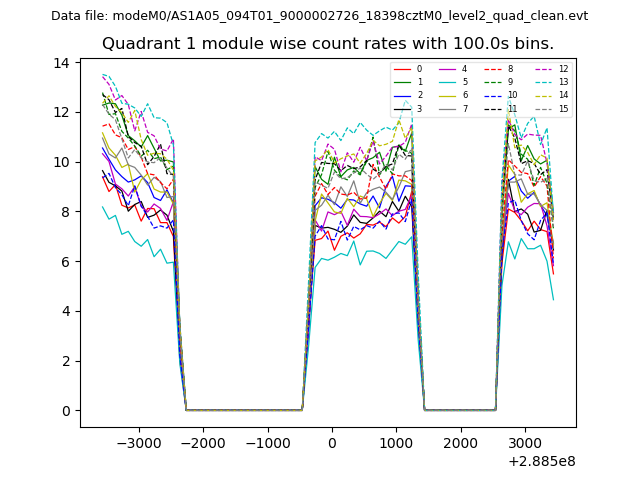
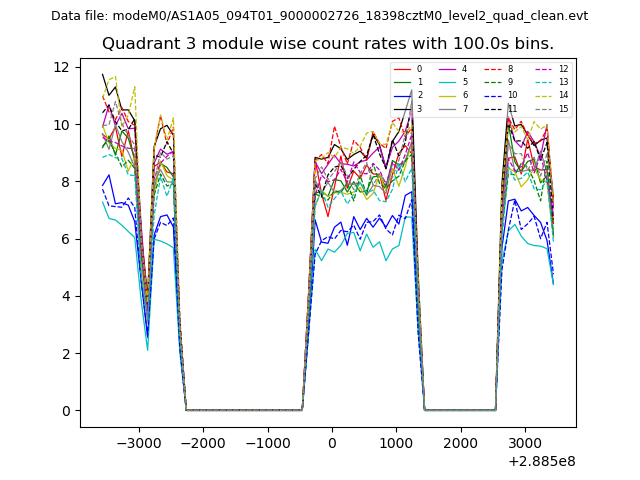
| Module-wise count rates for Quadrant A Data is divided into 100 sec bins |
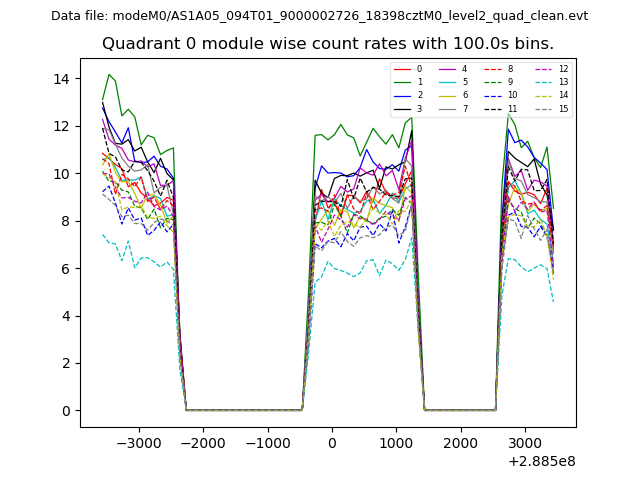 |
 |
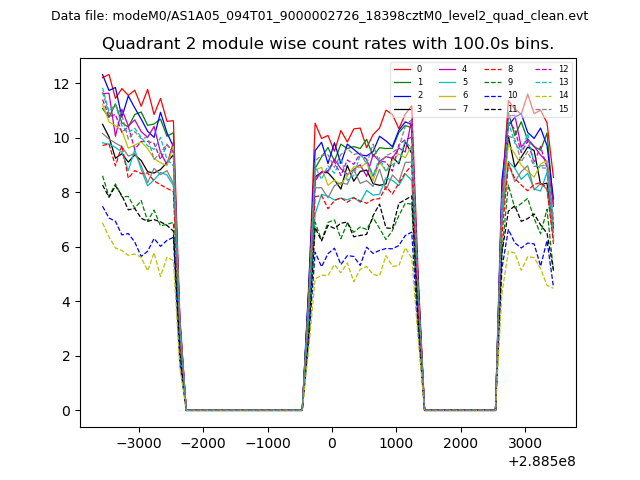
| Module-wise count rates for Quadrant B Data is divided into 100 sec bins |
 |
 |
| Module-wise count rates for Quadrant C Data is divided into 100 sec bins |
 |
 |
| Module-wise count rates for Quadrant D Data is divided into 100 sec bins |
 |
 |
| Parameter | Plot |
|---|---|
| CZT HV Monitor | 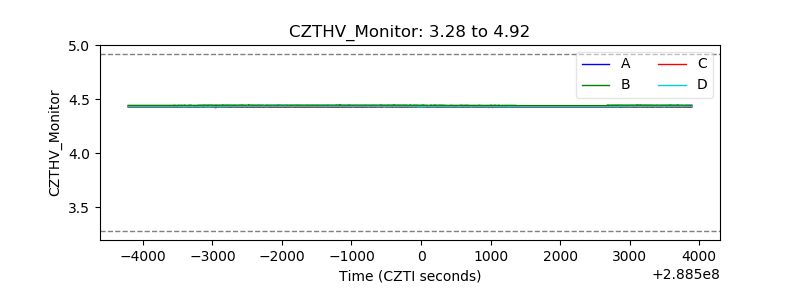 |
| D_VDD | 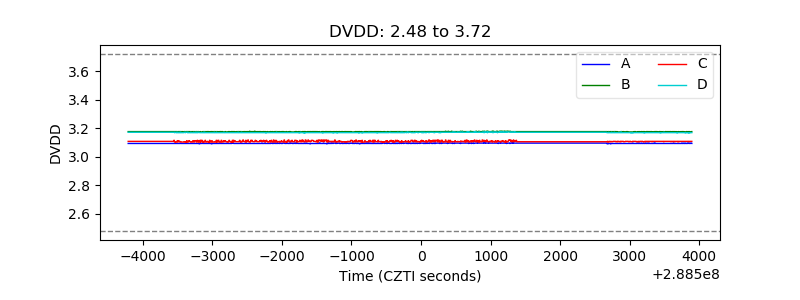 |
| Temperature 1 | 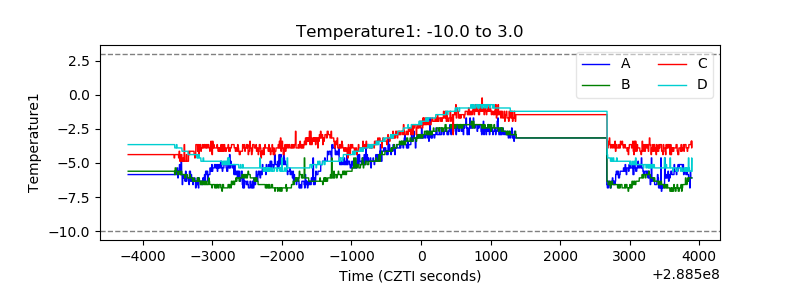 |
| Veto HV Monitor | 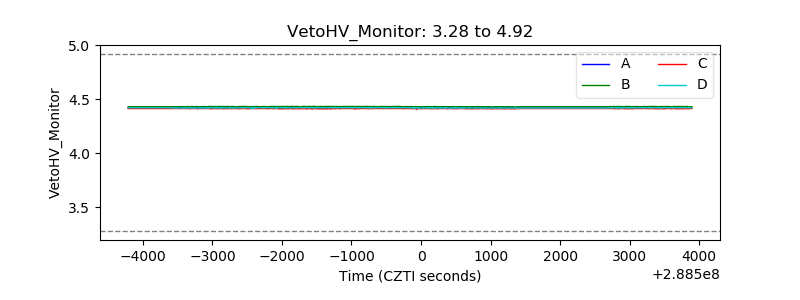 |
| Veto LLD | 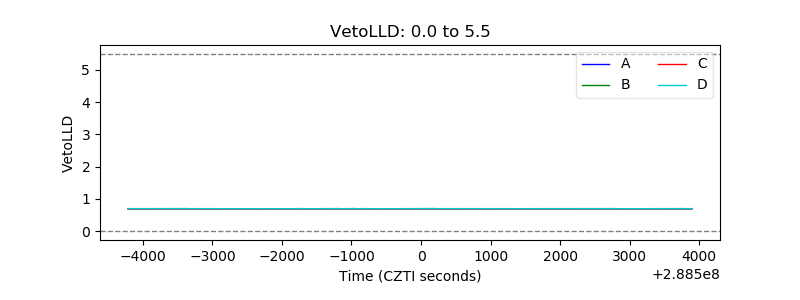 |
| Alpha Counter | 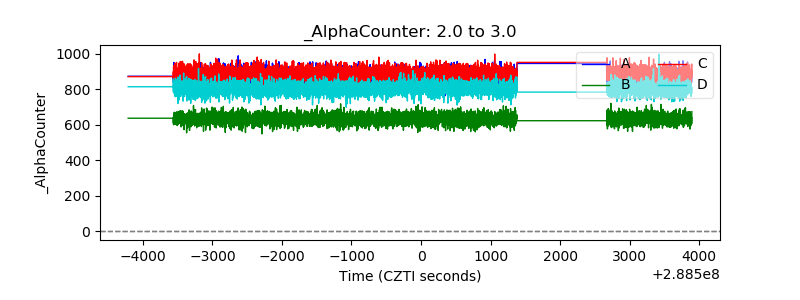 |
| _CPM_Rate | 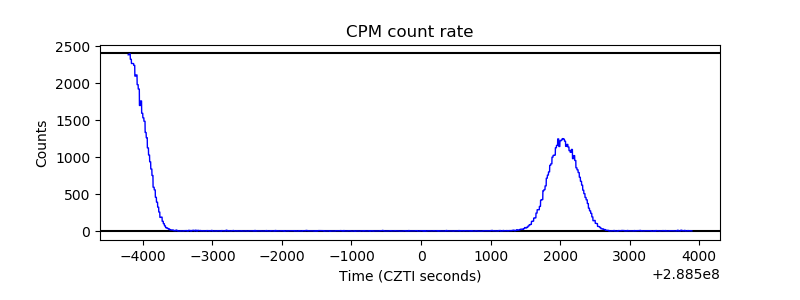 |
| CZT Counter | 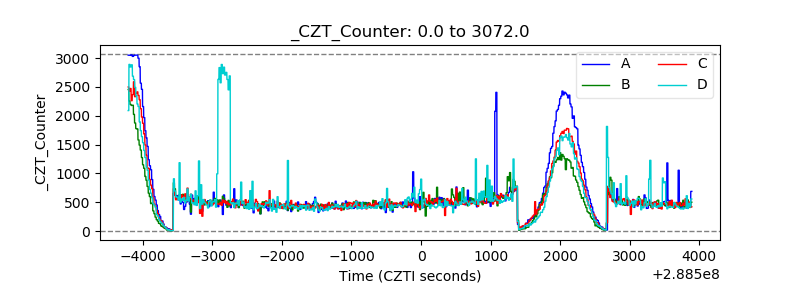 |
| +2.5 Volts monitor |  |
| +5 Volts monitor | 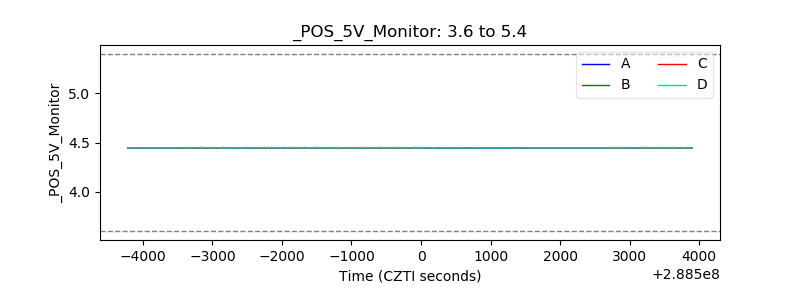 |
| _ROLL_ROT | 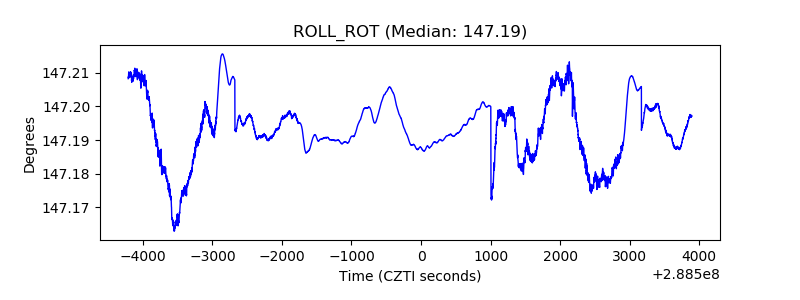 |
| _Roll_DEC | 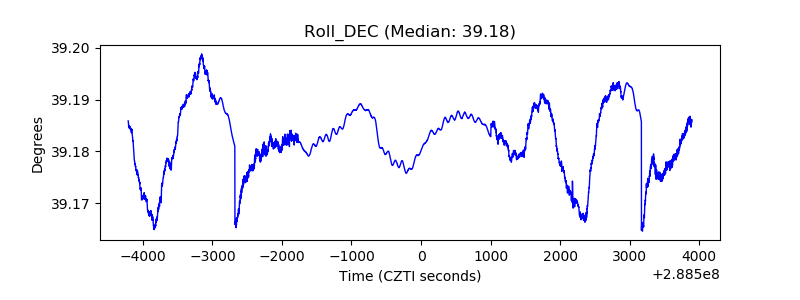 |
| _Roll_RA | 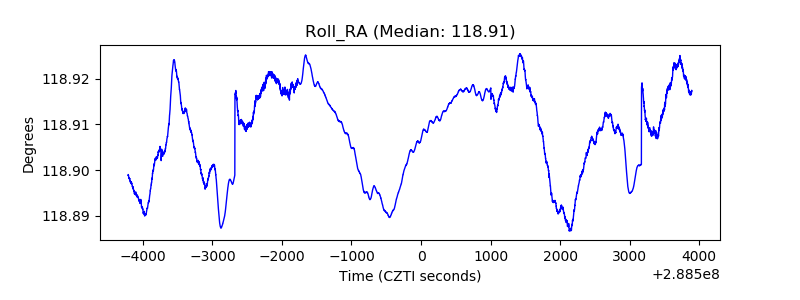 |
| Veto Counter | 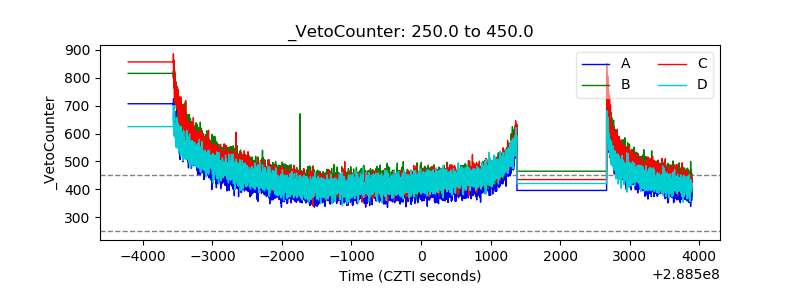 |