| Param | Original file | Final file |
|---|---|---|
| Filename | modeM0/AS1A05_094T01_9000002726_18400cztM0_level2.evt | modeM0/AS1A05_094T01_9000002726_18400cztM0_level2_quad_clean.evt |
| Size (bytes) | 601,151,040 | 83,520,000 |
| Size | 573.3 MB | 79.7 MB |
| Events in quadrant A | 3,611,126 | 518,861 |
| Events in quadrant B | 3,663,037 | 527,765 |
| Events in quadrant C | 3,749,904 | 496,490 |
| Events in quadrant D | 6,673,950 | 464,960 |
| Mode SS | |||
|---|---|---|---|
| Quadrant | BADHDUFLAG | Total packets | Discarded packets |
| A | 0 | 154 | 0 |
| B | 0 | 154 | 0 |
| C | 0 | 154 | 0 |
| D | 0 | 154 | 0 |
| Mode M9 | |||
|---|---|---|---|
| Quadrant | BADHDUFLAG | Total packets | Discarded packets |
| A | 0 | 16 | 0 |
| B | 0 | 16 | 0 |
| C | 0 | 16 | 0 |
| D | 0 | 16 | 0 |
| Mode M0 | |||
|---|---|---|---|
| Quadrant | BADHDUFLAG | Total packets | Discarded packets |
| A | 0 | 15661 | 2 |
| B | 0 | 15685 | 2 |
| C | 0 | 15805 | 2 |
| D | 0 | 24671 | 5 |
| Quadrant | Total seconds | Saturated seconds | Saturation percentage |
|---|---|---|---|
| A | 7480 | 159 | 2.125668% |
| B | 7481 | 203 | 2.713541% |
| C | 7481 | 185 | 2.472931% |
| D | 7480 | 1257 | 16.804813% |
Noise dominated data is calculated using 1-second bins in cleaned event files. If a bin has >2000 counts, and if more than 50% of those come from <1% of pixels, then it is considered to be noise-dominated and hence unusable.
| Quadrant | # 1 sec bins | Bins with >0 counts | Bins with >2000 counts | High rate bins dominated by noise | Noise dominated (total time) | Noise dominated (detector-on time) | Marked lightcurve |
|---|---|---|---|---|---|---|---|
| A | 9095 | 7482 | 4 | 4 | 0.04% | 0.05% | 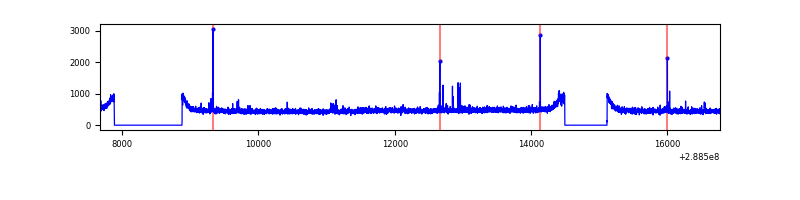 |
| B | 9096 | 7483 | 3 | 3 | 0.03% | 0.04% | 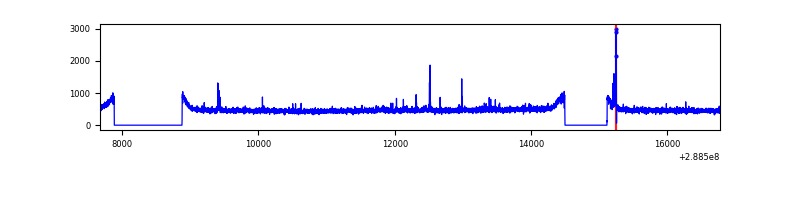 |
| C | 9096 | 7483 | 0 | 0 | 0.00% | 0.00% | 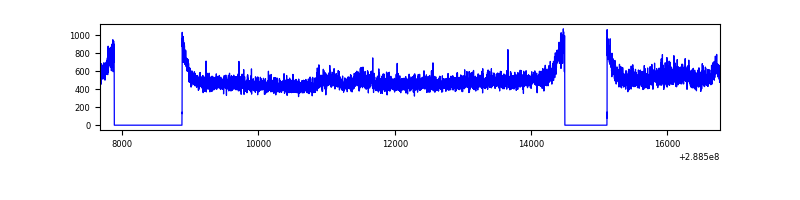 |
| D | 9095 | 7482 | 1153 | 1153 | 12.68% | 15.41% | 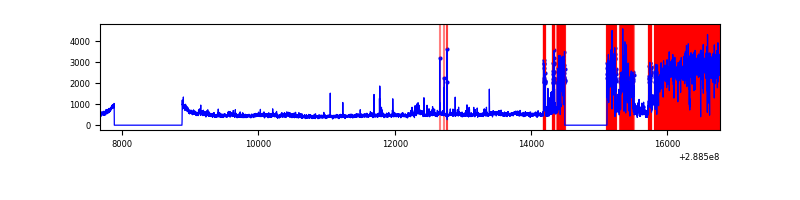 |
Top three noisy pixels from each quadrant. If the there are fewer than three noisy pixels in the level2.evt file, extra rows are filled as -1
| Pixel properties | Quadrant properties | ||||||
|---|---|---|---|---|---|---|---|
| Quadrant | DetID | PixID | Counts | Sigma | Mean | Median | Sigma |
| A | 6 | 16 | 26741 | 139.04 | 918 | 899 | 185.9 |
| A | 15 | 174 | 18641 | 95.46 | 918 | 899 | 185.9 |
| A | 4 | 2 | 14510 | 73.23 | 918 | 899 | 185.9 |
| B | 3 | 64 | 63025 | 353.26 | 920 | 896 | 175.9 |
| B | 12 | 111 | 21431 | 116.76 | 920 | 896 | 175.9 |
| B | 11 | 111 | 18137 | 98.03 | 920 | 896 | 175.9 |
| C | 3 | 233 | 185502 | 892.43 | 880 | 883 | 206.9 |
| C | 14 | 238 | 133725 | 642.14 | 880 | 883 | 206.9 |
| C | 13 | 61 | 6380 | 26.57 | 880 | 883 | 206.9 |
| D | 1 | 52 | 3417211 | 17688.55 | 796 | 771 | 193.1 |
| D | 7 | 238 | 98717 | 507.11 | 796 | 771 | 193.1 |
| D | 12 | 110 | 80065 | 410.54 | 796 | 771 | 193.1 |
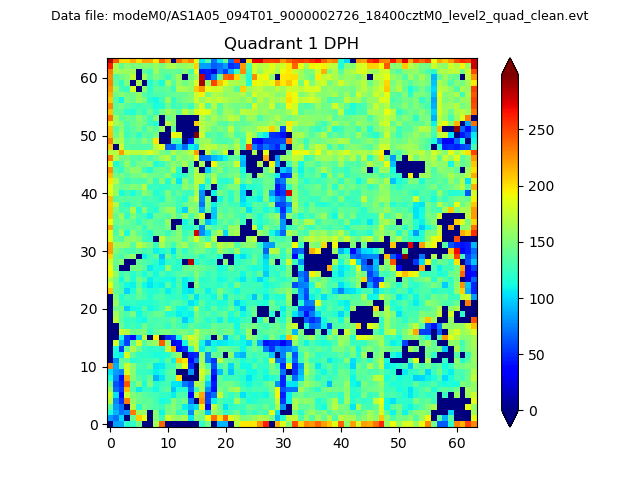
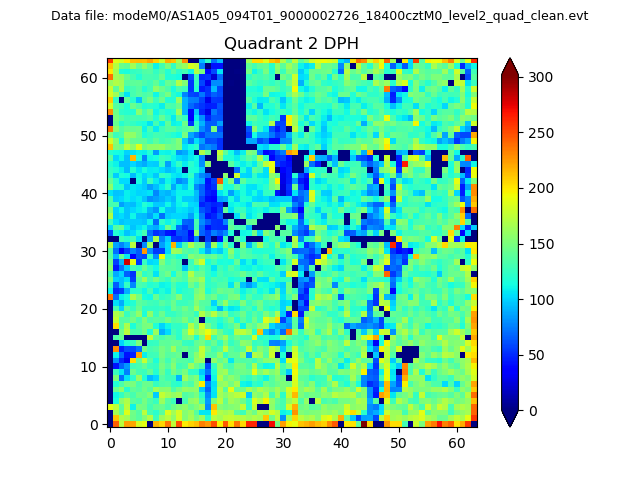
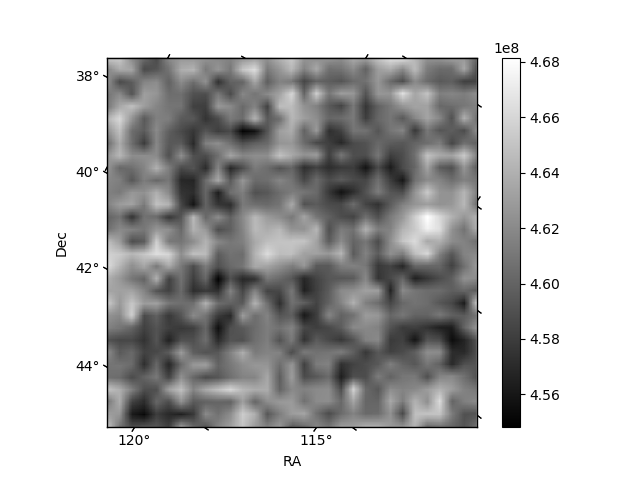
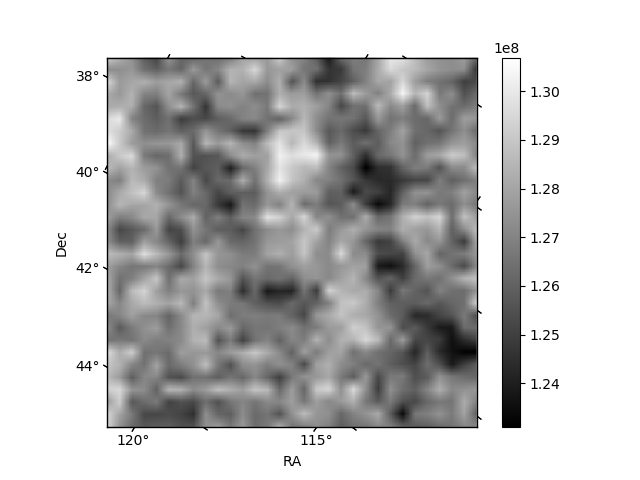
Histogram calculated using DETX and DETY for each event in the final _common_clean file
| Quadrant A |  |
 |
Quadrant B |
|---|---|---|---|
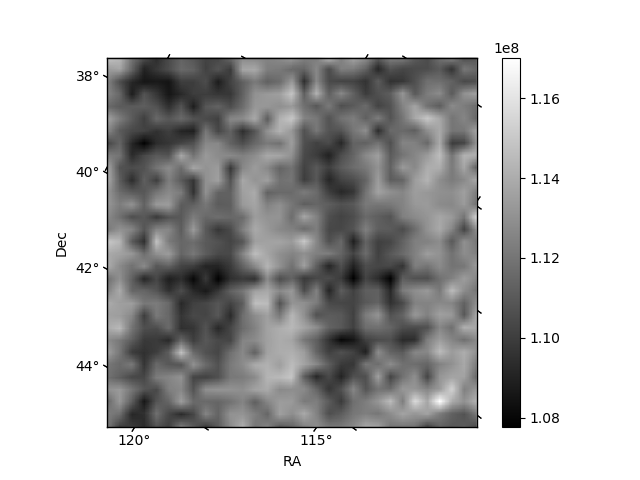
| Quadrant D | 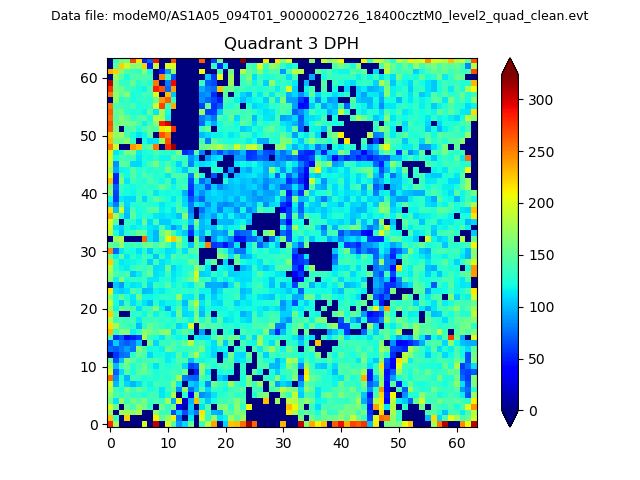 |
 |
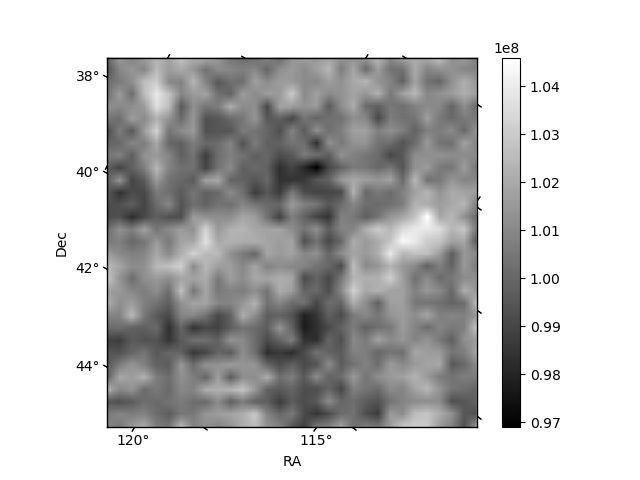
Quadrant C |
| Plot type | Count rate plots | Images |
|---|---|---|
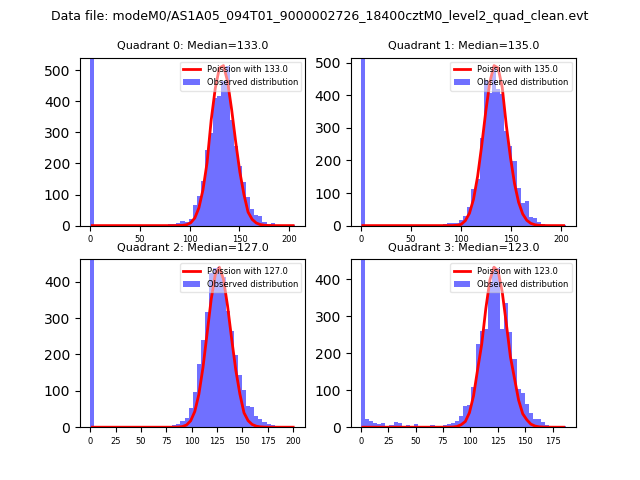
| Comparison with Poisson distribution Blue bars denote a histogram of data divided into 1 sec bins. Red curve is a Poisson curve with rate = median count rate of data. |
 |
 |
| Quadrant-wise count rates Data is divided into 100 sec bins |
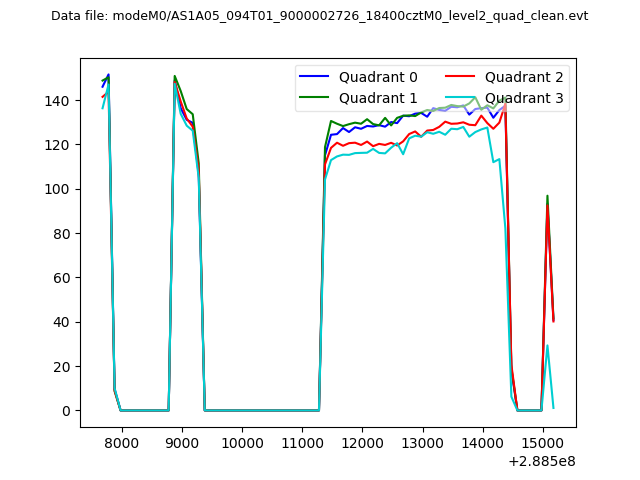 |
|
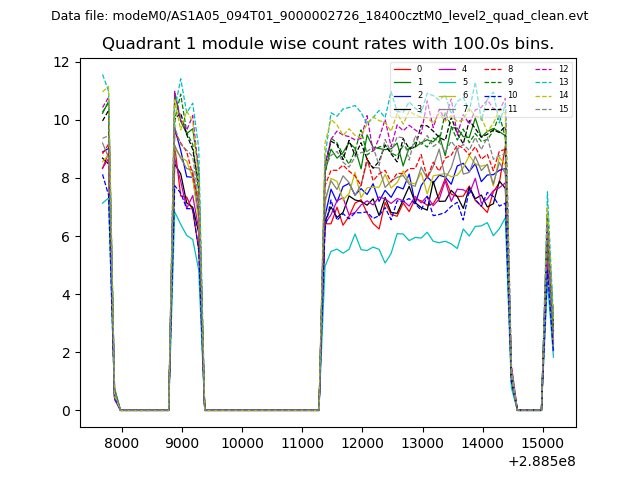
| Module-wise count rates for Quadrant A Data is divided into 100 sec bins |
 |
 |
| Module-wise count rates for Quadrant B Data is divided into 100 sec bins |
 |
 |
| Module-wise count rates for Quadrant C Data is divided into 100 sec bins |
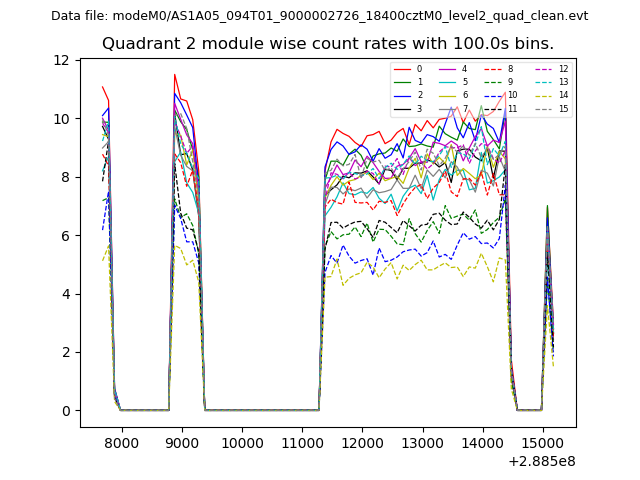 |
 |
| Module-wise count rates for Quadrant D Data is divided into 100 sec bins |
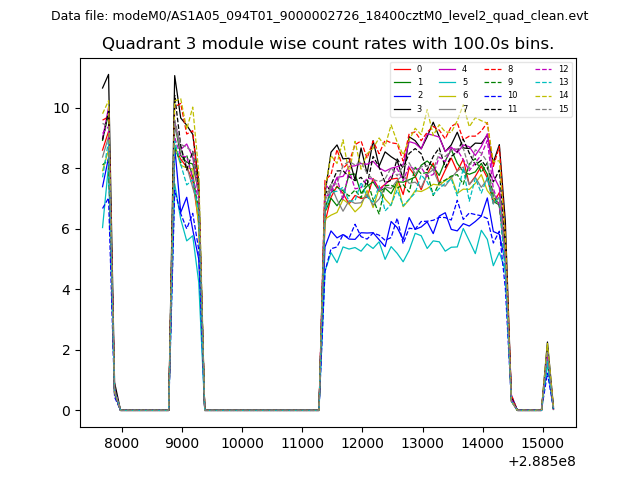 |
 |
| Parameter | Plot |
|---|---|
| CZT HV Monitor | 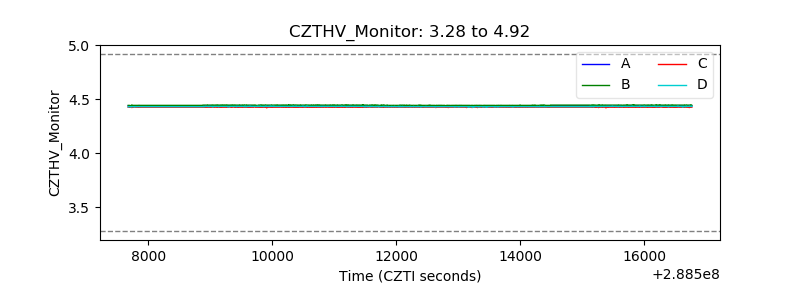 |
| D_VDD | 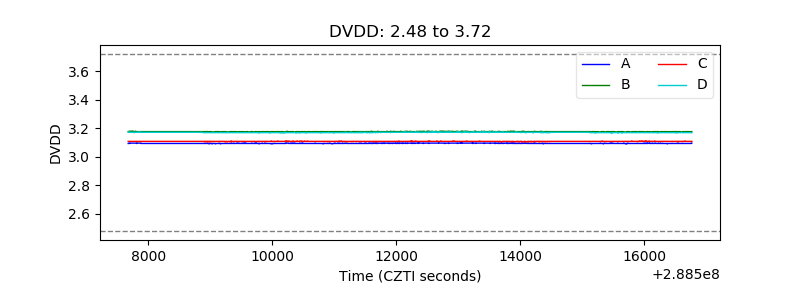 |
| Temperature 1 | 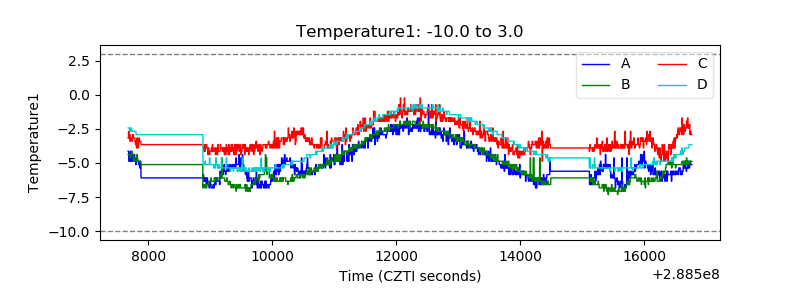 |
| Veto HV Monitor |  |
| Veto LLD | 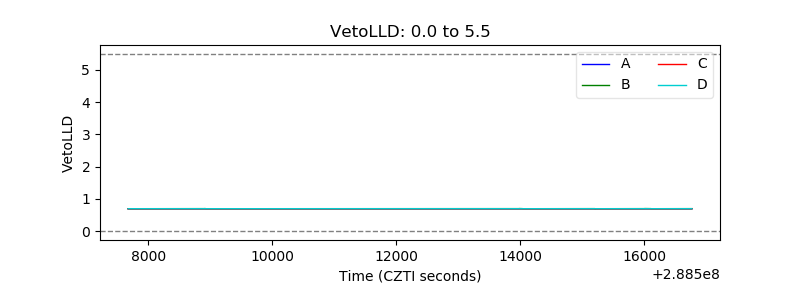 |
| Alpha Counter | 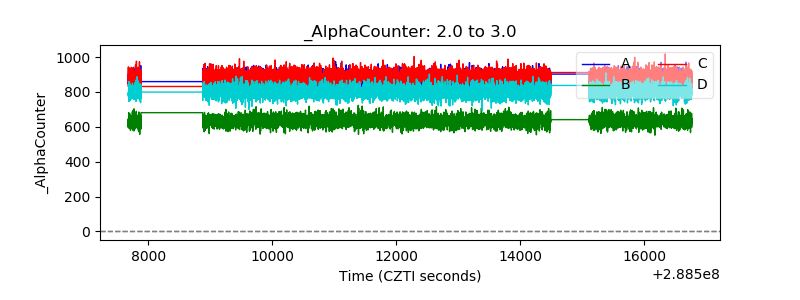 |
| _CPM_Rate | 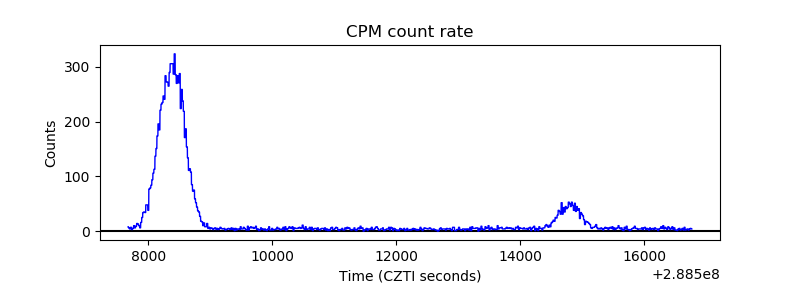 |
| CZT Counter | 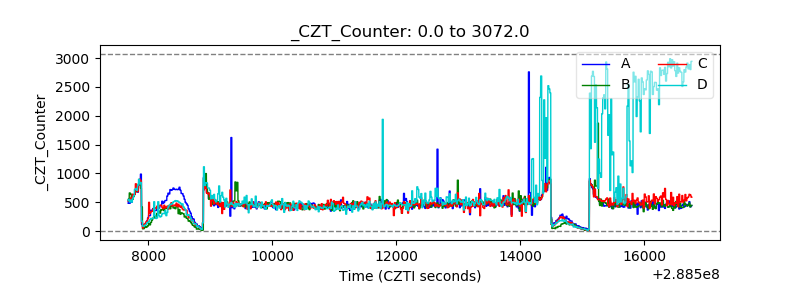 |
| +2.5 Volts monitor |  |
| +5 Volts monitor |  |
| _ROLL_ROT | 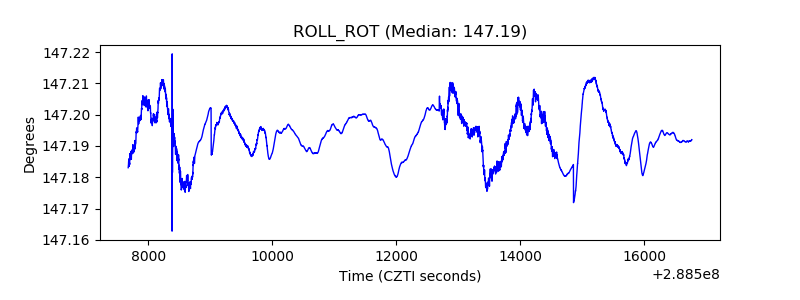 |
| _Roll_DEC | 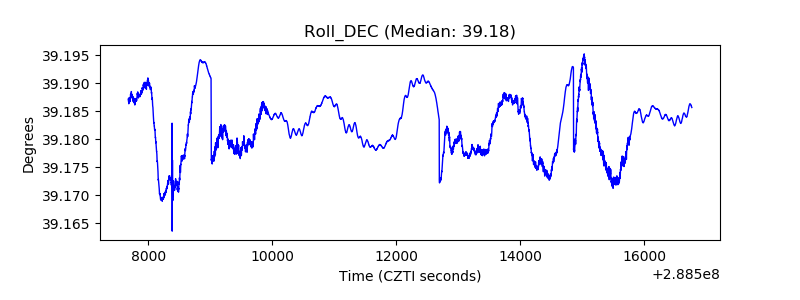 |
| _Roll_RA | 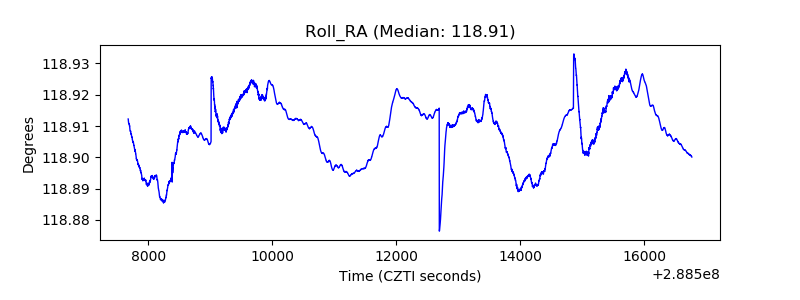 |
| Veto Counter | 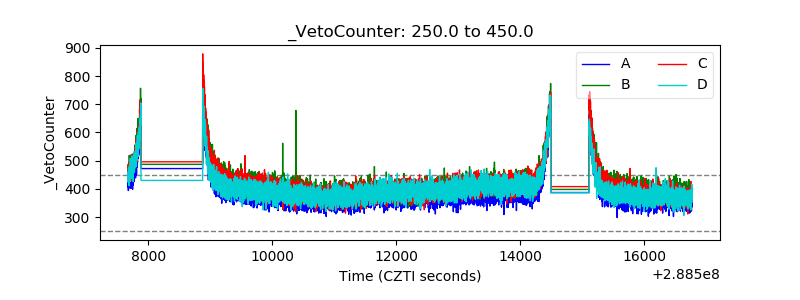 |