| Param | Original file | Final file |
|---|---|---|
| Filename | modeM0/AS1A05_094T01_9000002726_18405cztM0_level2.evt | modeM0/AS1A05_094T01_9000002726_18405cztM0_level2_quad_clean.evt |
| Size (bytes) | 296,683,200 | 66,147,840 |
| Size | 282.9 MB | 63.1 MB |
| Events in quadrant A | 2,102,953 | 430,895 |
| Events in quadrant B | 2,152,020 | 434,839 |
| Events in quadrant C | 2,138,829 | 410,999 |
| Events in quadrant D | 2,272,414 | 398,165 |
| Mode SS | |||
|---|---|---|---|
| Quadrant | BADHDUFLAG | Total packets | Discarded packets |
| A | 0 | 94 | 0 |
| B | 0 | 94 | 0 |
| C | 0 | 94 | 0 |
| D | 0 | 94 | 0 |
| Mode M0 | |||
|---|---|---|---|
| Quadrant | BADHDUFLAG | Total packets | Discarded packets |
| A | 0 | 9432 | 0 |
| B | 0 | 9520 | 0 |
| C | 0 | 9400 | 0 |
| D | 0 | 9845 | 0 |
| Quadrant | Total seconds | Saturated seconds | Saturation percentage |
|---|---|---|---|
| A | 4665 | 4 | 0.085745% |
| B | 4666 | 16 | 0.342906% |
| C | 4666 | 14 | 0.300043% |
| D | 4666 | 10 | 0.214316% |
Noise dominated data is calculated using 1-second bins in cleaned event files. If a bin has >2000 counts, and if more than 50% of those come from <1% of pixels, then it is considered to be noise-dominated and hence unusable.
| Quadrant | # 1 sec bins | Bins with >0 counts | Bins with >2000 counts | High rate bins dominated by noise | Noise dominated (total time) | Noise dominated (detector-on time) | Marked lightcurve |
|---|---|---|---|---|---|---|---|
| A | 4665 | 4665 | 1 | 1 | 0.02% | 0.02% | 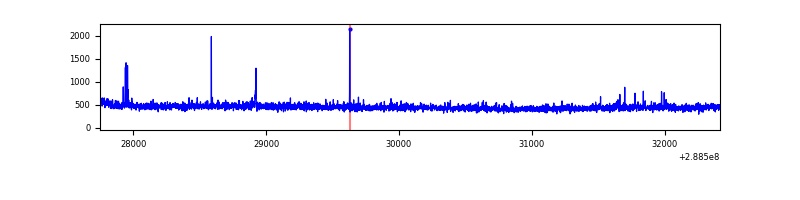 |
| B | 4666 | 4666 | 9 | 9 | 0.19% | 0.19% | 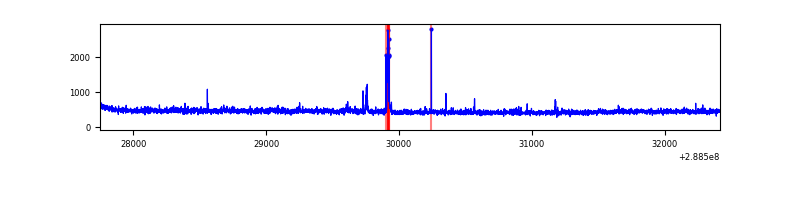 |
| C | 4666 | 4666 | 0 | 0 | 0.00% | 0.00% | 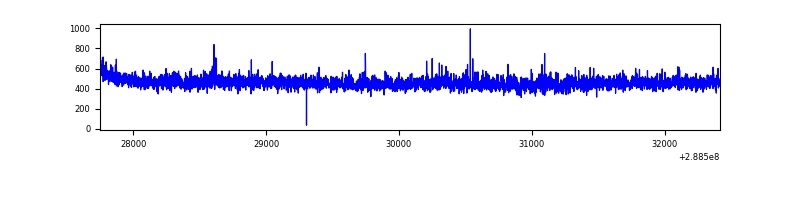 |
| D | 4666 | 4666 | 4 | 4 | 0.09% | 0.09% | 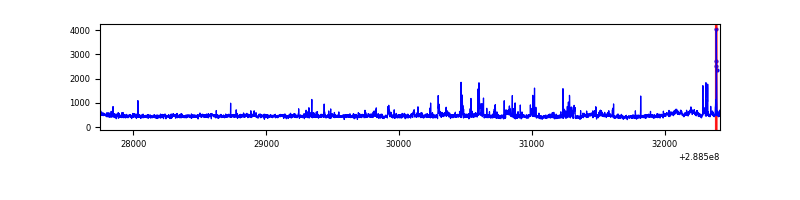 |
Top three noisy pixels from each quadrant. If the there are fewer than three noisy pixels in the level2.evt file, extra rows are filled as -1
| Pixel properties | Quadrant properties | ||||||
|---|---|---|---|---|---|---|---|
| Quadrant | DetID | PixID | Counts | Sigma | Mean | Median | Sigma |
| A | 4 | 2 | 20910 | 185.6 | 537 | 526 | 109.8 |
| A | 15 | 174 | 12584 | 109.79 | 537 | 526 | 109.8 |
| A | 0 | 254 | 5264 | 43.14 | 537 | 526 | 109.8 |
| B | 7 | 220 | 33037 | 315.34 | 533 | 518 | 103.1 |
| B | 0 | 189 | 15057 | 140.99 | 533 | 518 | 103.1 |
| B | 12 | 111 | 12044 | 111.77 | 533 | 518 | 103.1 |
| C | 14 | 238 | 79552 | 651.02 | 513 | 516 | 121.4 |
| C | 3 | 233 | 30585 | 247.68 | 513 | 516 | 121.4 |
| C | 0 | 207 | 10452 | 81.84 | 513 | 516 | 121.4 |
| D | 1 | 52 | 199074 | 1560.8 | 519 | 503 | 127.2 |
| D | 12 | 110 | 27487 | 212.1 | 519 | 503 | 127.2 |
| D | 13 | 104 | 25694 | 198.01 | 519 | 503 | 127.2 |
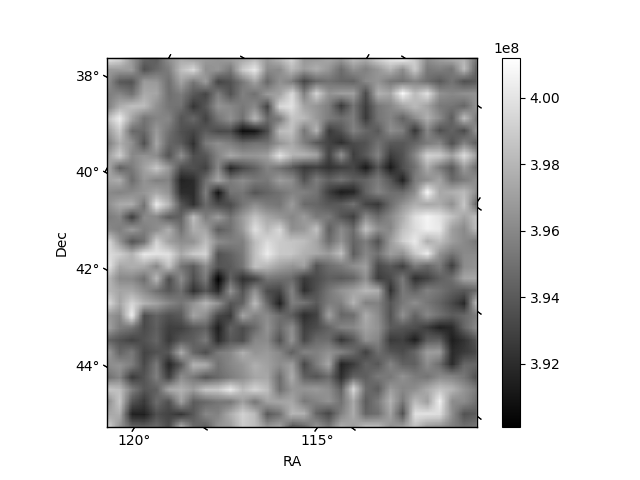
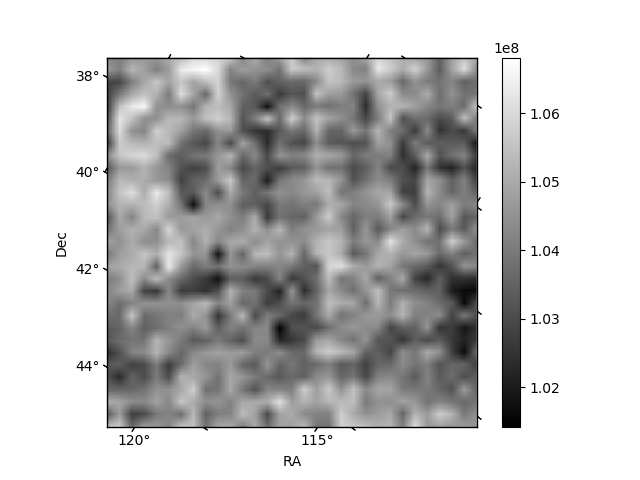
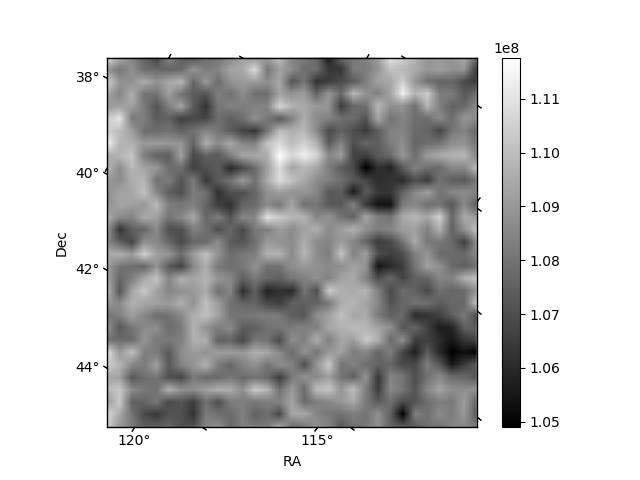
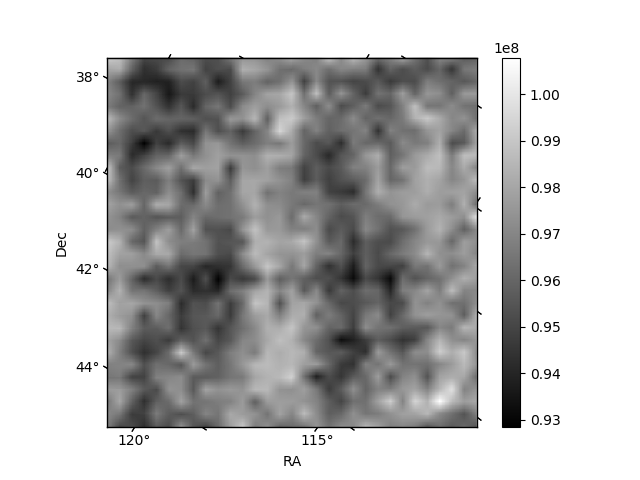
Histogram calculated using DETX and DETY for each event in the final _common_clean file
| Quadrant A | 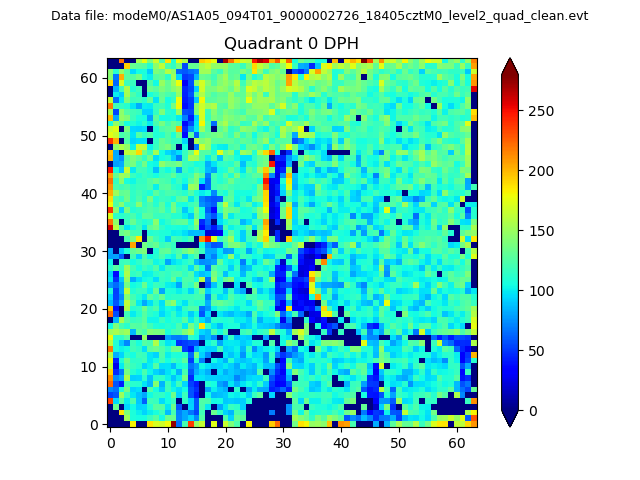 |
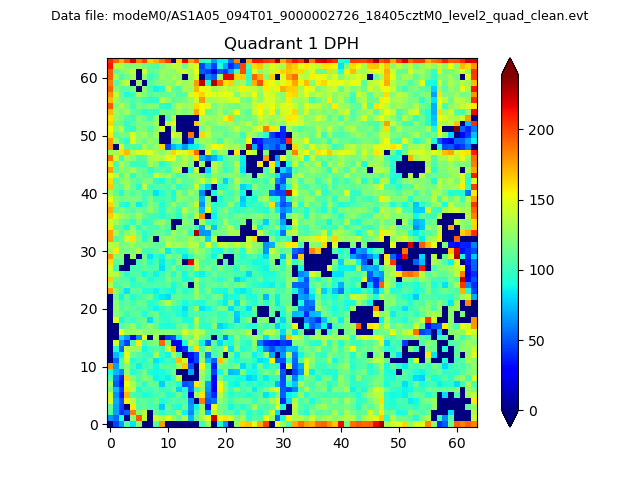 |
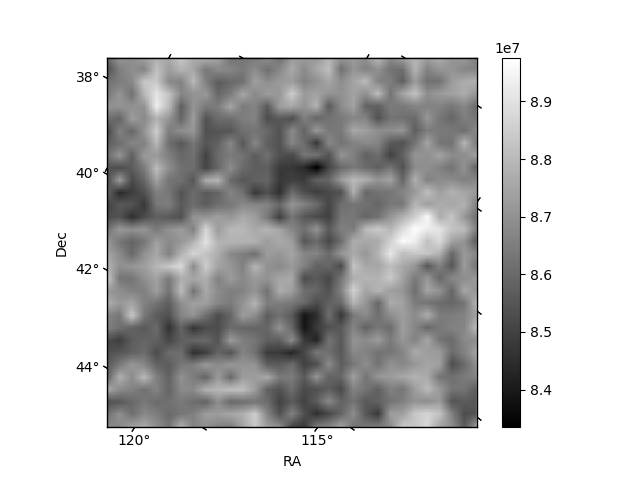
Quadrant B |
|---|---|---|---|
| Quadrant D | 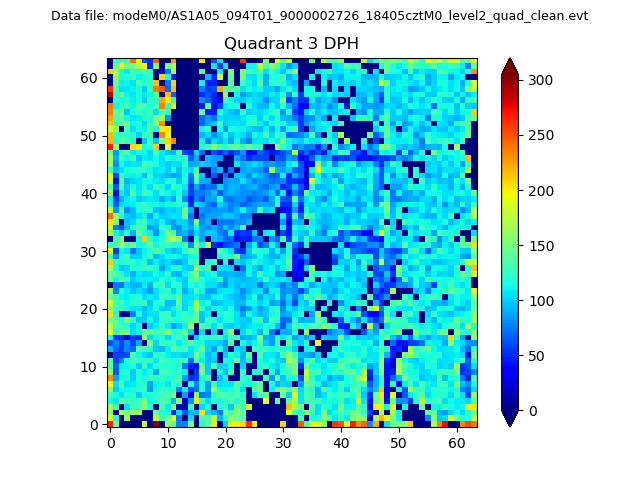 |
 |
Quadrant C |
| Plot type | Count rate plots | Images |
|---|---|---|
| Comparison with Poisson distribution Blue bars denote a histogram of data divided into 1 sec bins. Red curve is a Poisson curve with rate = median count rate of data. |
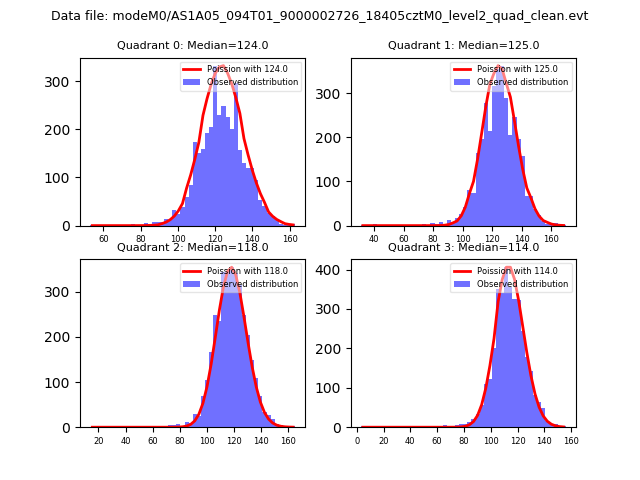 |
 |
| Quadrant-wise count rates Data is divided into 100 sec bins |
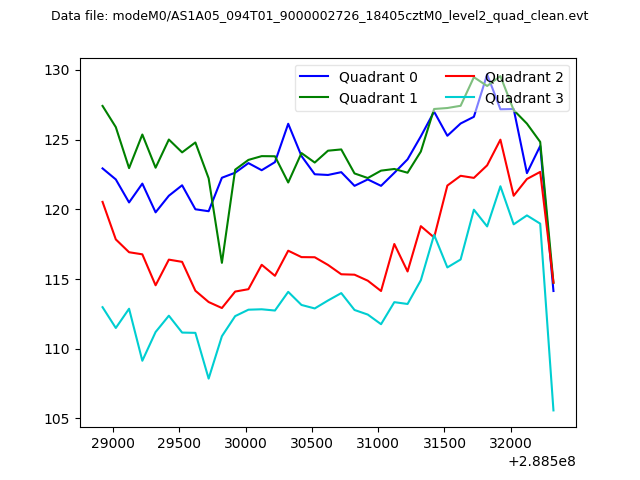 |
|
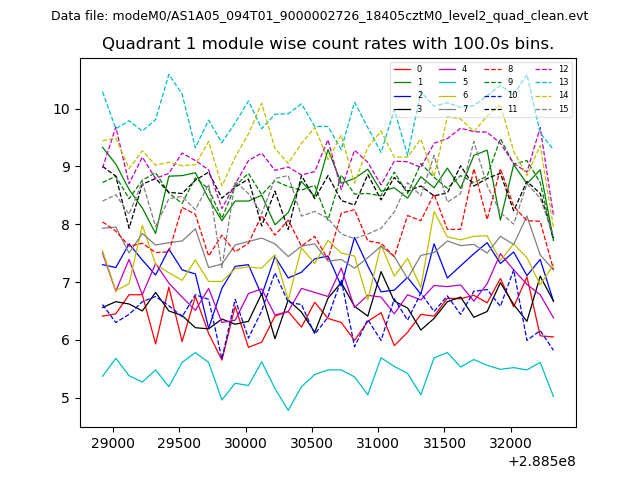
| Module-wise count rates for Quadrant A Data is divided into 100 sec bins |
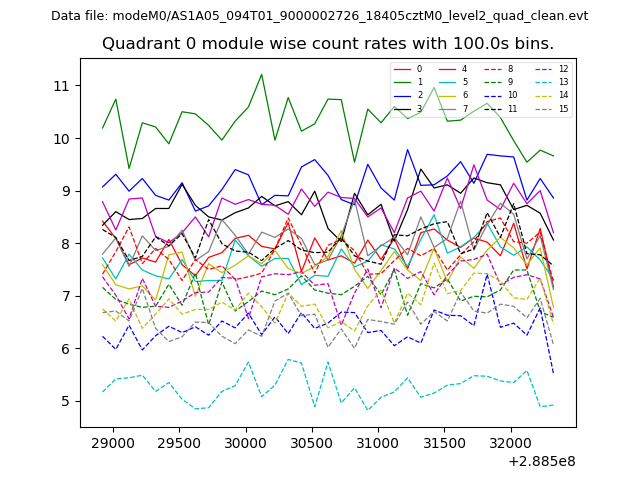 |
 |
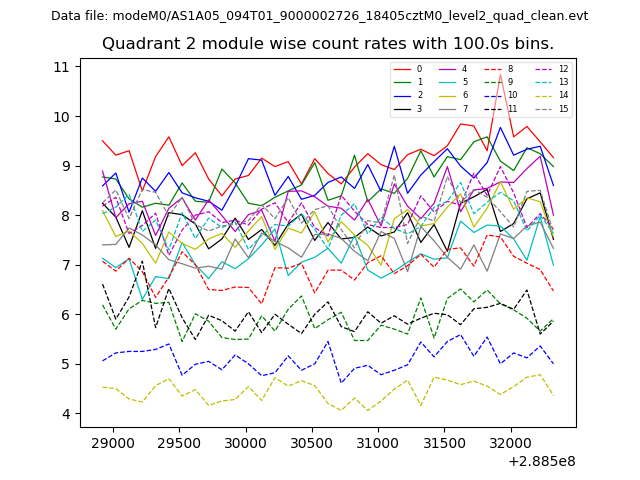
| Module-wise count rates for Quadrant B Data is divided into 100 sec bins |
 |
 |
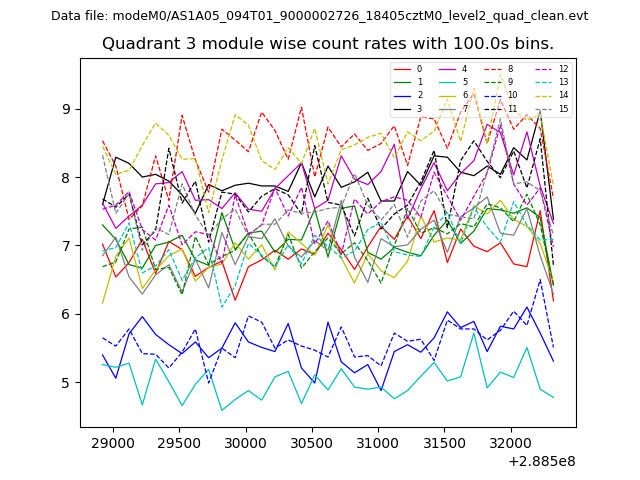
| Module-wise count rates for Quadrant C Data is divided into 100 sec bins |
 |
 |
| Module-wise count rates for Quadrant D Data is divided into 100 sec bins |
 |
 |
| Parameter | Plot |
|---|---|
| CZT HV Monitor | 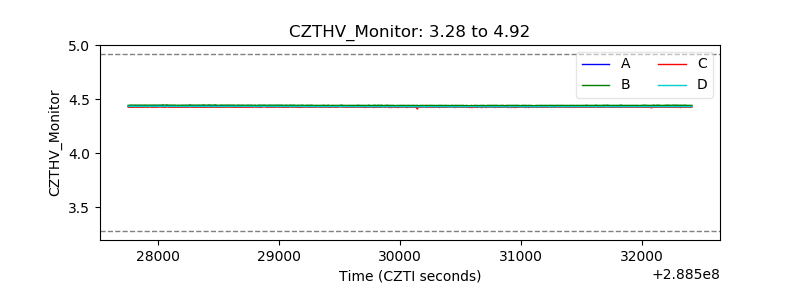 |
| D_VDD | 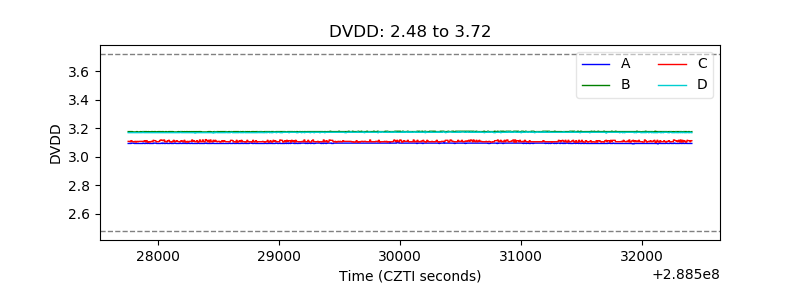 |
| Temperature 1 | 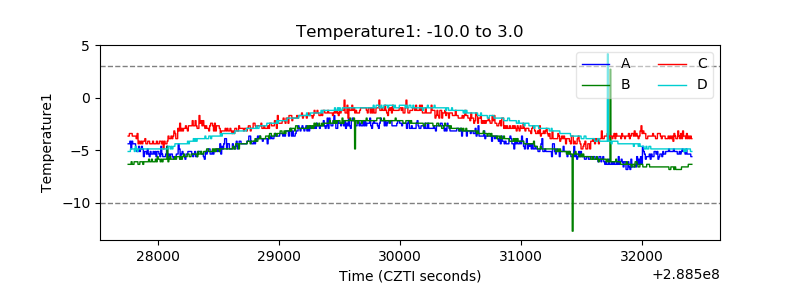 |
| Veto HV Monitor | 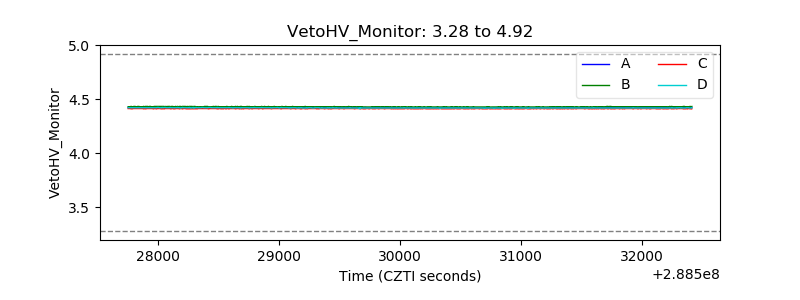 |
| Veto LLD | 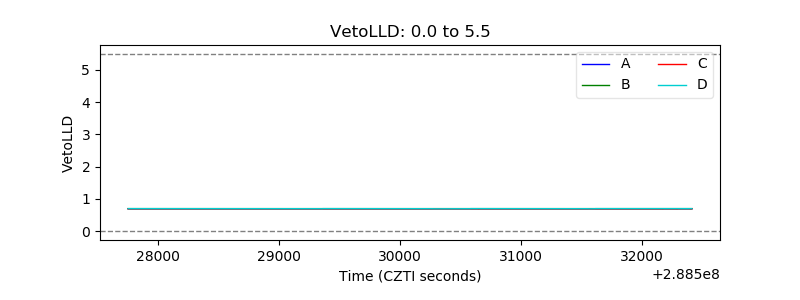 |
| Alpha Counter | 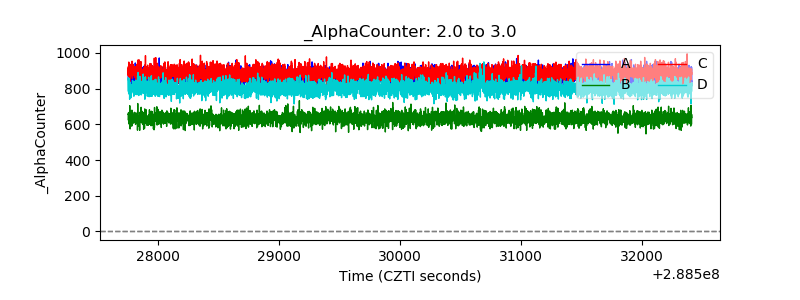 |
| _CPM_Rate | 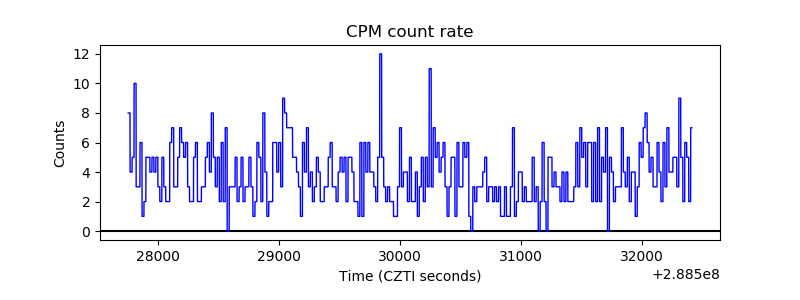 |
| CZT Counter | 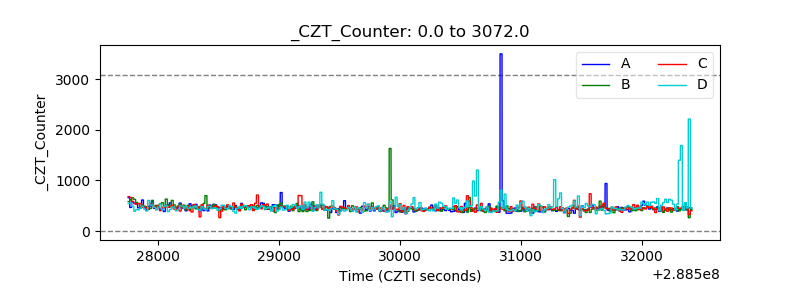 |
| +2.5 Volts monitor |  |
| +5 Volts monitor |  |
| _ROLL_ROT | 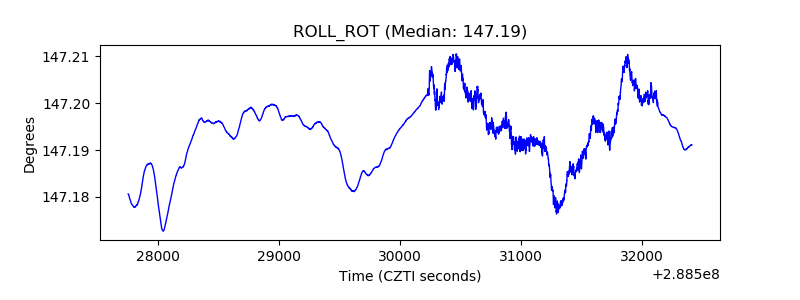 |
| _Roll_DEC | 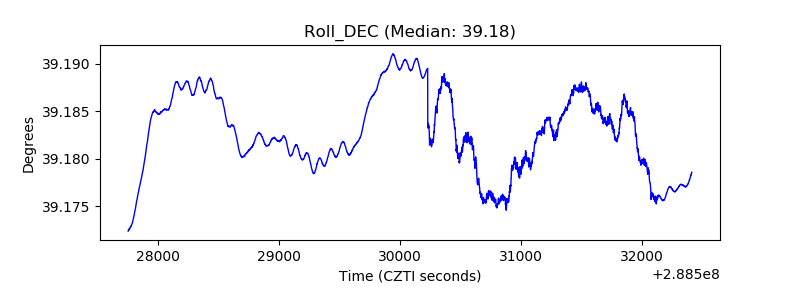 |
| _Roll_RA | 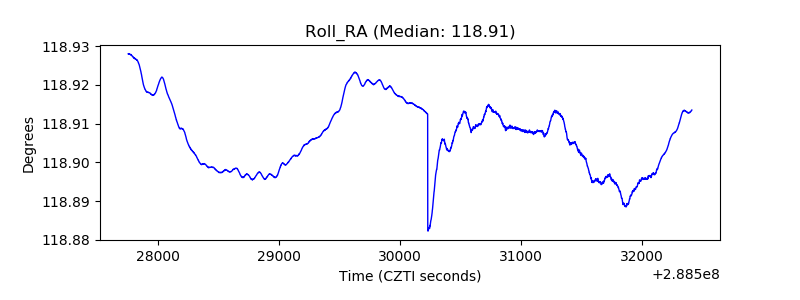 |
| Veto Counter | 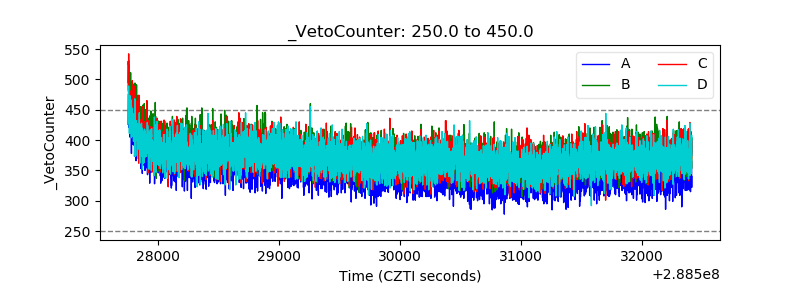 |