| Param | Original file | Final file |
|---|---|---|
| Filename | modeM0/AS1A05_227T06_9000002730cztM0_level2.fits | modeM0/AS1A05_227T06_9000002730cztM0_level2_quad_clean.evt |
| Size (bytes) | 228,749,760 | 190,200,960 |
| Size | 218.2 MB | 181.4 MB |
| Events in quadrant A | 1,438,786 | 1,103,511 |
| Events in quadrant B | 1,365,020 | 1,105,139 |
| Events in quadrant C | 1,386,112 | 1,051,138 |
| Events in quadrant D | 1,196,368 | 957,924 |
| Mode SS | |||
|---|---|---|---|
| Quadrant | BADHDUFLAG | Total packets | Discarded packets |
| A | 0 | 452 | 0 |
| B | 0 | 452 | 0 |
| C | 0 | 452 | 0 |
| D | 0 | 452 | 0 |
| Mode M0 | |||
|---|---|---|---|
| Quadrant | BADHDUFLAG | Total packets | Discarded packets |
| A | 0 | 47640 | 0 |
| B | 0 | 57592 | 0 |
| C | 0 | 46984 | 0 |
| D | 0 | 57184 | 0 |
| Mode M9 | |||
|---|---|---|---|
| Quadrant | BADHDUFLAG | Total packets | Discarded packets |
| A | 0 | 53 | 0 |
| B | 0 | 53 | 0 |
| C | 0 | 53 | 0 |
| D | 0 | 53 | 0 |
| Quadrant | Total seconds | Saturated seconds | Saturation percentage |
|---|---|---|---|
| A | 22411 | 253 | 1.128910% |
| B | 22411 | 818 | 3.649993% |
| C | 22411 | 218 | 0.972737% |
| D | 22411 | 510 | 2.275668% |
Noise dominated data is calculated using 1-second bins in cleaned event files. If a bin has >2000 counts, and if more than 50% of those come from <1% of pixels, then it is considered to be noise-dominated and hence unusable.
| Quadrant | # 1 sec bins | Bins with >0 counts | Bins with >2000 counts | High rate bins dominated by noise | Noise dominated (total time) | Noise dominated (detector-on time) | Marked lightcurve |
|---|---|---|---|---|---|---|---|
| A | 27552 | 22411 | 0 | 0 | 0.00% | 0.00% |  |
| B | 27552 | 22409 | 0 | 0 | 0.00% | 0.00% |  |
| C | 27552 | 22411 | 0 | 0 | 0.00% | 0.00% |  |
| D | 27551 | 22406 | 0 | 0 | 0.00% | 0.00% |  |
Top three noisy pixels from each quadrant. If the there are fewer than three noisy pixels in the level2.evt file, extra rows are filled as -1
| Pixel properties | Quadrant properties | ||||||
|---|---|---|---|---|---|---|---|
| Quadrant | DetID | PixID | Counts | Sigma | Mean | Median | Sigma |
| A | 0 | 29 | 1431 | 11.64 | 374 | 353 | 92.6 |
| A | 7 | 110 | 1200 | 9.14 | 374 | 353 | 92.6 |
| A | 0 | 30 | 1188 | 9.01 | 374 | 353 | 92.6 |
| B | 2 | 9 | 1129 | 10.83 | 361 | 347 | 72.2 |
| B | 2 | 8 | 971 | 8.65 | 361 | 347 | 72.2 |
| B | 3 | 17 | 895 | 7.59 | 361 | 347 | 72.2 |
| C | 1 | 81 | 1112 | 8.09 | 366 | 344 | 94.9 |
| C | 1 | 80 | 1111 | 8.08 | 366 | 344 | 94.9 |
| C | 1 | 65 | 949 | 6.37 | 366 | 344 | 94.9 |
| D | 4 | 246 | 958 | 7.08 | 341 | 311 | 91.4 |
| D | 3 | 14 | 924 | 6.7 | 341 | 311 | 91.4 |
| D | 6 | 231 | 893 | 6.36 | 341 | 311 | 91.4 |
Histogram calculated using DETX and DETY for each event in the final _common_clean file
| Quadrant A | 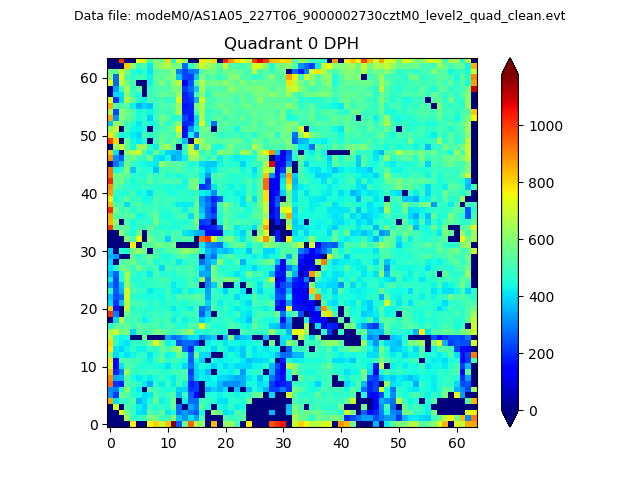 |
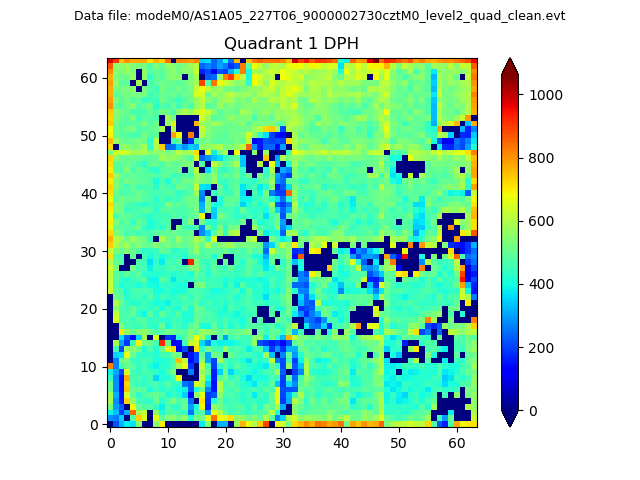 |
Quadrant B |
|---|---|---|---|
| Quadrant D |  |
 |
Quadrant C |
| Plot type | Count rate plots | Images |
|---|---|---|
| Comparison with Poisson distribution Blue bars denote a histogram of data divided into 1 sec bins. Red curve is a Poisson curve with rate = median count rate of data. |
 |
 |
| Quadrant-wise count rates Data is divided into 100 sec bins |
 |
|
| Module-wise count rates for Quadrant A Data is divided into 100 sec bins |
 |
 |
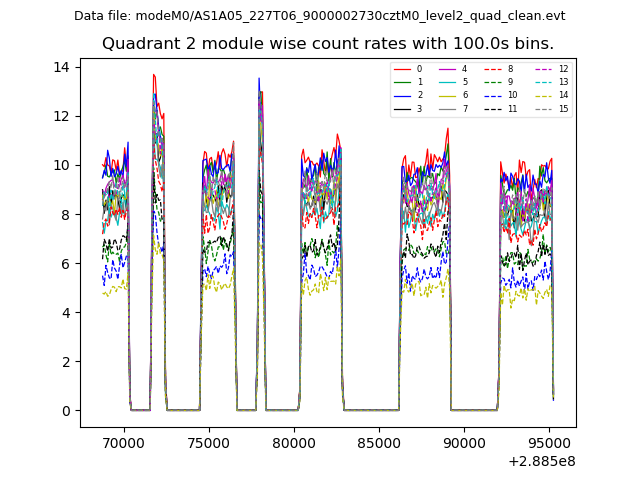
| Module-wise count rates for Quadrant B Data is divided into 100 sec bins |
 |
 |
| Module-wise count rates for Quadrant C Data is divided into 100 sec bins |
 |
 |
| Module-wise count rates for Quadrant D Data is divided into 100 sec bins |
 |
 |
| Parameter | Plot |
|---|---|
| CZT HV Monitor | 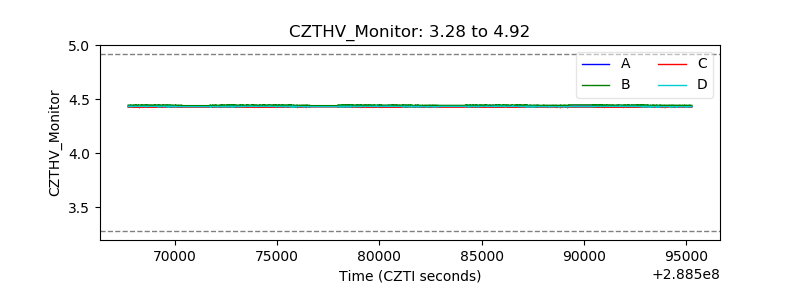 |
| D_VDD | 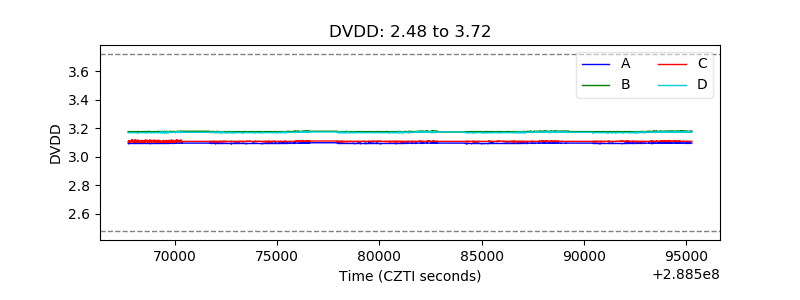 |
| Temperature 1 |  |
| Veto HV Monitor |  |
| Veto LLD | 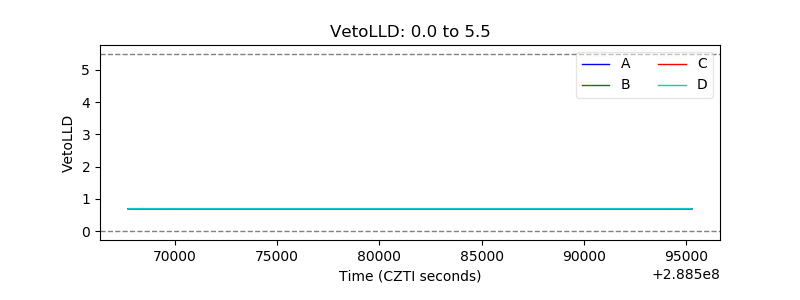 |
| Alpha Counter |  |
| _CPM_Rate | 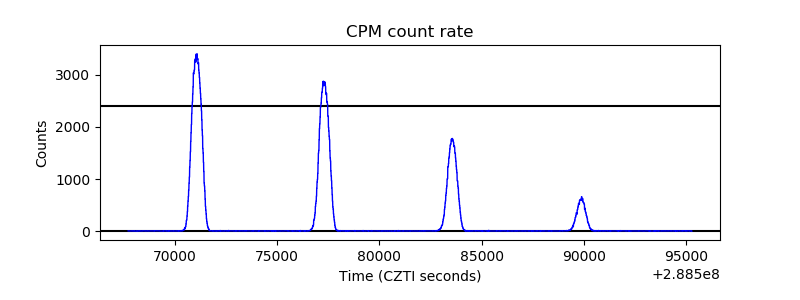 |
| CZT Counter |  |
| +2.5 Volts monitor |  |
| +5 Volts monitor |  |
| _ROLL_ROT |  |
| _Roll_DEC |  |
| _Roll_RA |  |
| Veto Counter |  |