| Param | Original file | Final file |
|---|---|---|
| Filename | modeM0/AS1A05_227T06_9000002730_18410cztM0_level2.evt | modeM0/AS1A05_227T06_9000002730_18410cztM0_level2_quad_clean.evt |
| Size (bytes) | 293,846,400 | 54,253,440 |
| Size | 280.2 MB | 51.7 MB |
| Events in quadrant A | 1,985,132 | 348,098 |
| Events in quadrant B | 2,445,172 | 357,246 |
| Events in quadrant C | 1,963,591 | 337,276 |
| Events in quadrant D | 2,241,082 | 326,585 |
| Mode SS | |||
|---|---|---|---|
| Quadrant | BADHDUFLAG | Total packets | Discarded packets |
| A | 0 | 78 | 0 |
| B | 0 | 78 | 0 |
| C | 0 | 78 | 0 |
| D | 0 | 78 | 0 |
| Mode M0 | |||
|---|---|---|---|
| Quadrant | BADHDUFLAG | Total packets | Discarded packets |
| A | 0 | 8231 | 1 |
| B | 0 | 9716 | 2 |
| C | 0 | 8132 | 1 |
| D | 0 | 9096 | 1 |
| Mode M9 | |||
|---|---|---|---|
| Quadrant | BADHDUFLAG | Total packets | Discarded packets |
| A | 0 | 14 | 0 |
| B | 0 | 14 | 0 |
| C | 0 | 14 | 0 |
| D | 0 | 14 | 0 |
| Quadrant | Total seconds | Saturated seconds | Saturation percentage |
|---|---|---|---|
| A | 3877 | 12 | 0.309518% |
| B | 3876 | 51 | 1.315789% |
| C | 3876 | 22 | 0.567595% |
| D | 3876 | 42 | 1.083591% |
Noise dominated data is calculated using 1-second bins in cleaned event files. If a bin has >2000 counts, and if more than 50% of those come from <1% of pixels, then it is considered to be noise-dominated and hence unusable.
| Quadrant | # 1 sec bins | Bins with >0 counts | Bins with >2000 counts | High rate bins dominated by noise | Noise dominated (total time) | Noise dominated (detector-on time) | Marked lightcurve |
|---|---|---|---|---|---|---|---|
| A | 5212 | 3878 | 4 | 4 | 0.08% | 0.10% | 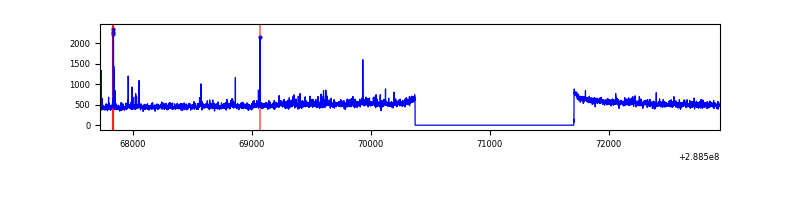 |
| B | 5211 | 3877 | 33 | 33 | 0.63% | 0.85% | 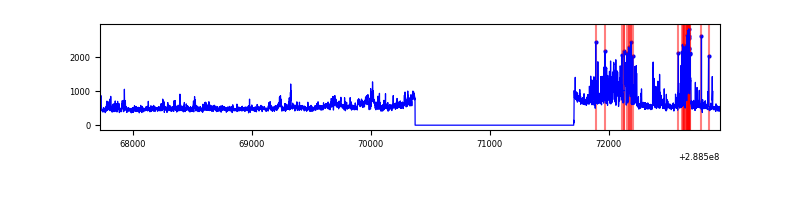 |
| C | 5211 | 3877 | 0 | 0 | 0.00% | 0.00% | 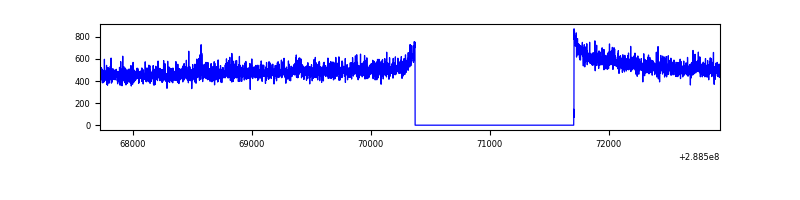 |
| D | 5211 | 3877 | 33 | 33 | 0.63% | 0.85% | 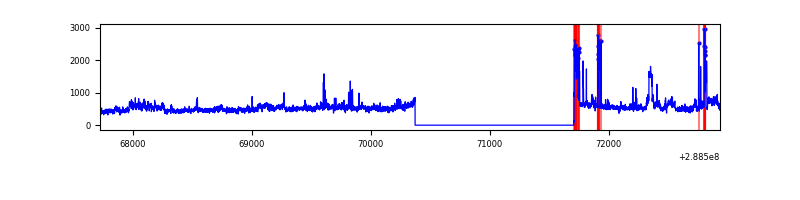 |
Top three noisy pixels from each quadrant. If the there are fewer than three noisy pixels in the level2.evt file, extra rows are filled as -1
| Pixel properties | Quadrant properties | ||||||
|---|---|---|---|---|---|---|---|
| Quadrant | DetID | PixID | Counts | Sigma | Mean | Median | Sigma |
| A | 4 | 2 | 38858 | 375.94 | 500 | 488 | 102.1 |
| A | 15 | 174 | 23762 | 228.03 | 500 | 488 | 102.1 |
| A | 0 | 226 | 4572 | 40.01 | 500 | 488 | 102.1 |
| B | 10 | 245 | 416110 | 4343.33 | 501 | 489 | 95.7 |
| B | 0 | 189 | 35500 | 365.87 | 501 | 489 | 95.7 |
| B | 0 | 197 | 11460 | 114.65 | 501 | 489 | 95.7 |
| C | 14 | 238 | 75665 | 665.05 | 479 | 483 | 113.0 |
| C | 3 | 233 | 11599 | 98.33 | 479 | 483 | 113.0 |
| C | 8 | 128 | 5562 | 44.93 | 479 | 483 | 113.0 |
| D | 12 | 110 | 177944 | 1522.09 | 481 | 467 | 116.6 |
| D | 1 | 52 | 77355 | 659.41 | 481 | 467 | 116.6 |
| D | 8 | 230 | 66367 | 565.17 | 481 | 467 | 116.6 |
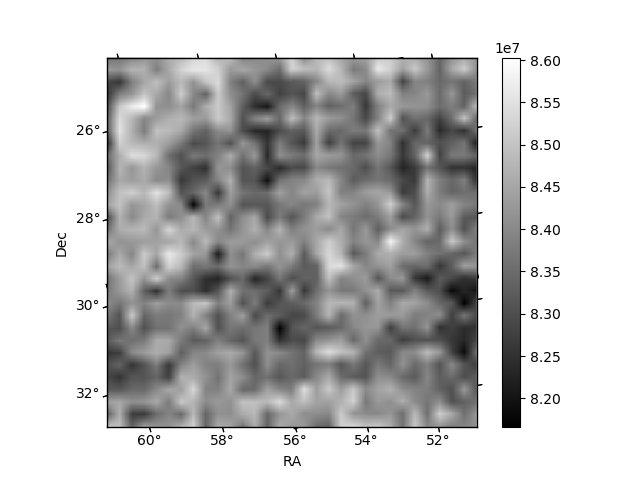
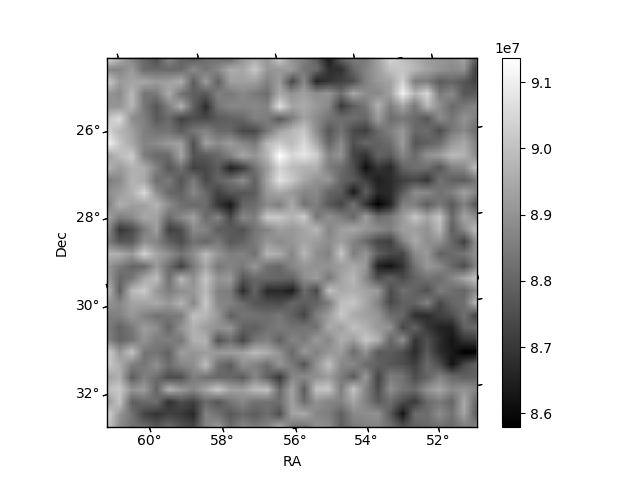
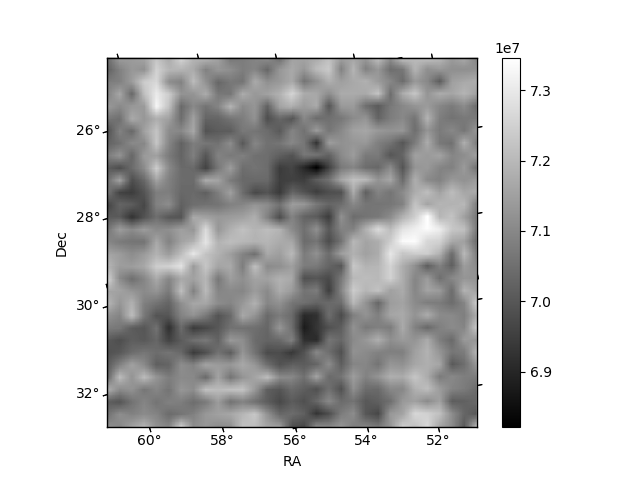
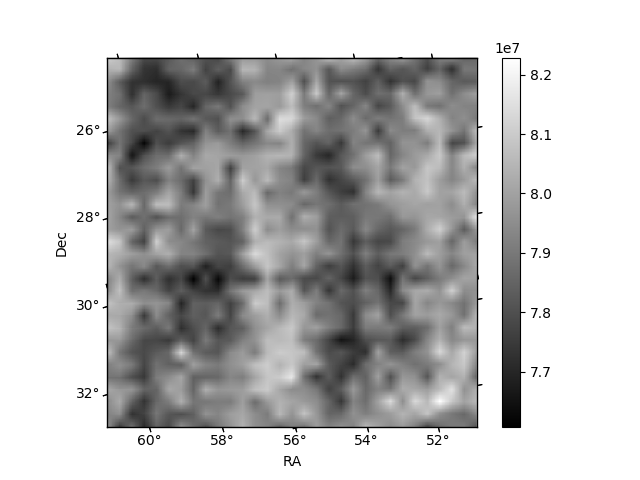
Histogram calculated using DETX and DETY for each event in the final _common_clean file
| Quadrant A |  |
 |
Quadrant B |
|---|---|---|---|
| Quadrant D | 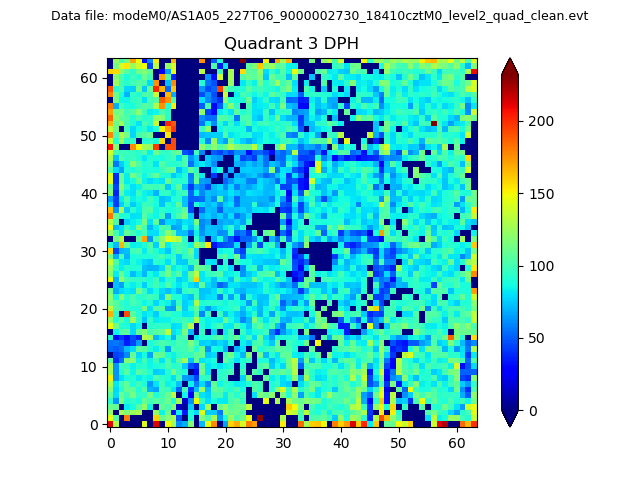 |
 |
Quadrant C |
| Plot type | Count rate plots | Images |
|---|---|---|
| Comparison with Poisson distribution Blue bars denote a histogram of data divided into 1 sec bins. Red curve is a Poisson curve with rate = median count rate of data. |
 |
 |
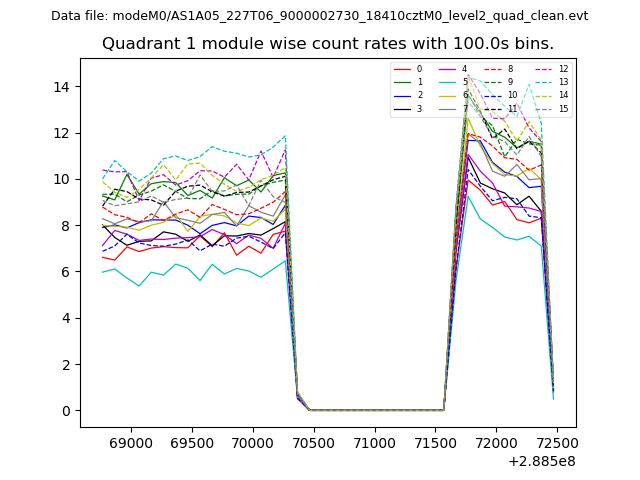
| Quadrant-wise count rates Data is divided into 100 sec bins |
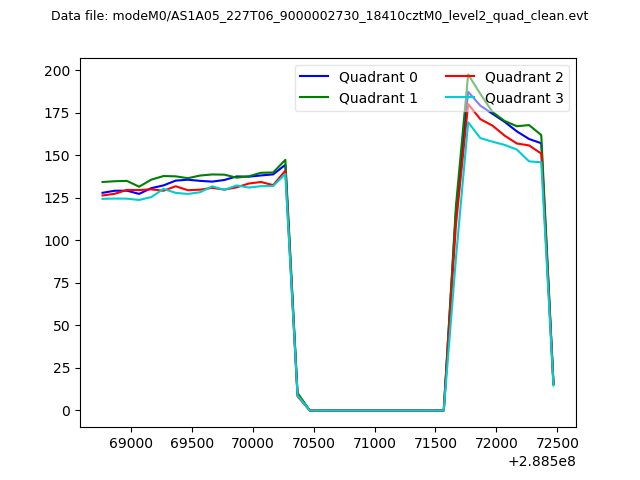 |
|
| Module-wise count rates for Quadrant A Data is divided into 100 sec bins |
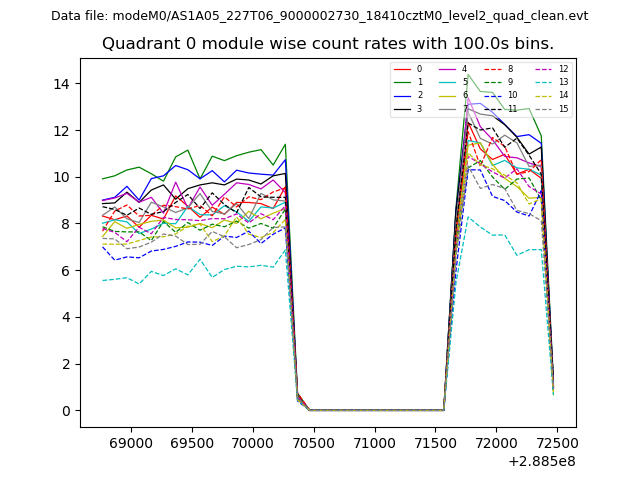 |
 |
| Module-wise count rates for Quadrant B Data is divided into 100 sec bins |
 |
 |
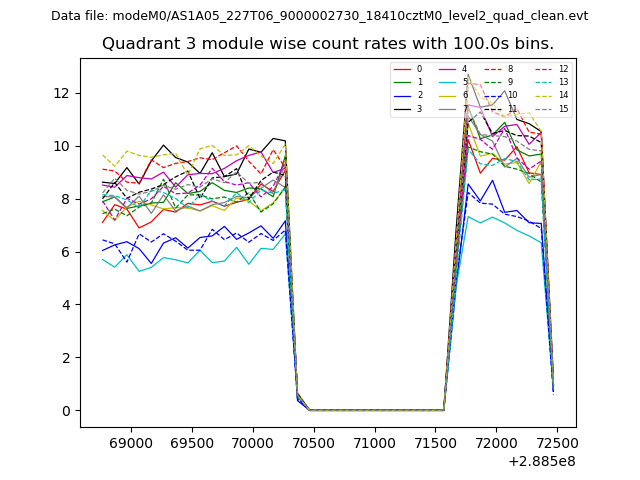
| Module-wise count rates for Quadrant C Data is divided into 100 sec bins |
 |
 |
| Module-wise count rates for Quadrant D Data is divided into 100 sec bins |
 |
 |
| Parameter | Plot |
|---|---|
| CZT HV Monitor |  |
| D_VDD | 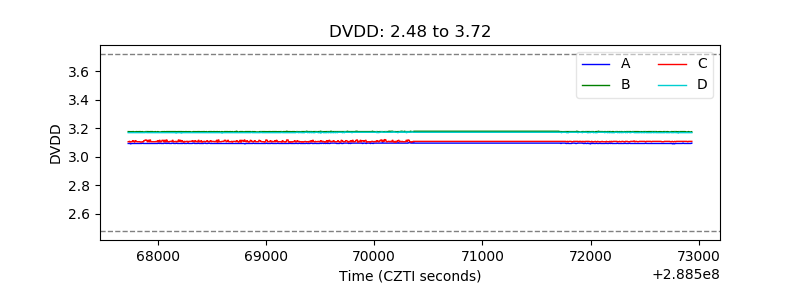 |
| Temperature 1 | 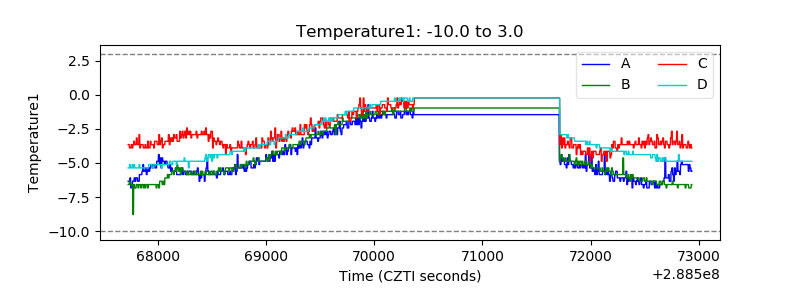 |
| Veto HV Monitor | 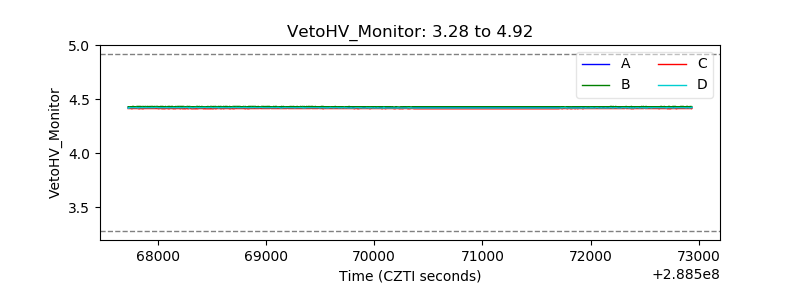 |
| Veto LLD | 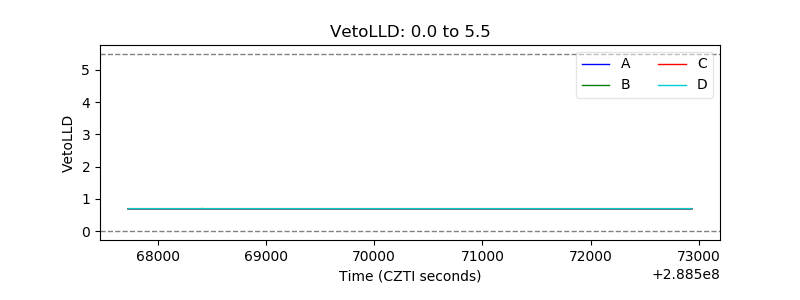 |
| Alpha Counter | 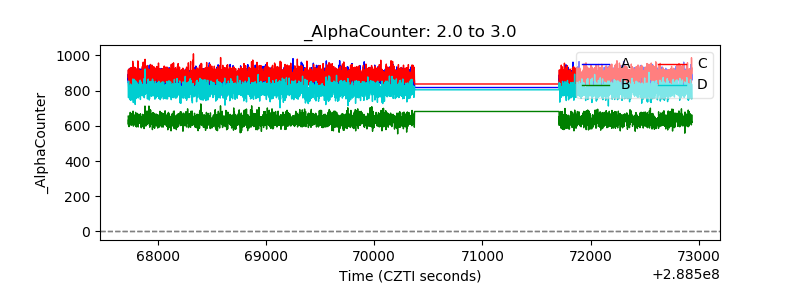 |
| _CPM_Rate | 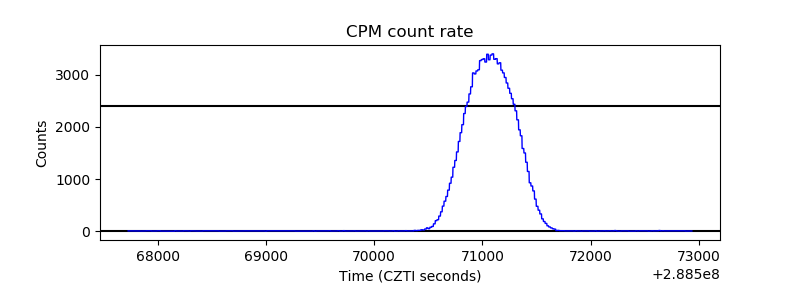 |
| CZT Counter | 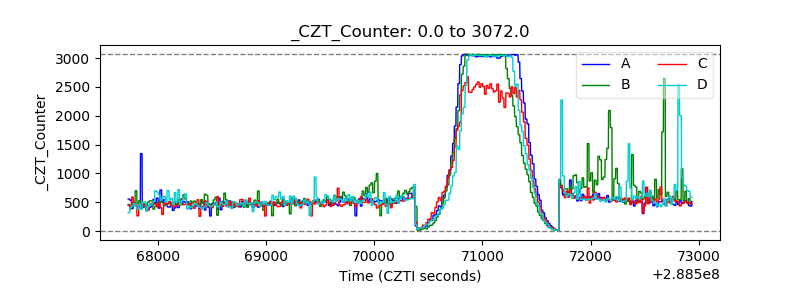 |
| +2.5 Volts monitor |  |
| +5 Volts monitor | 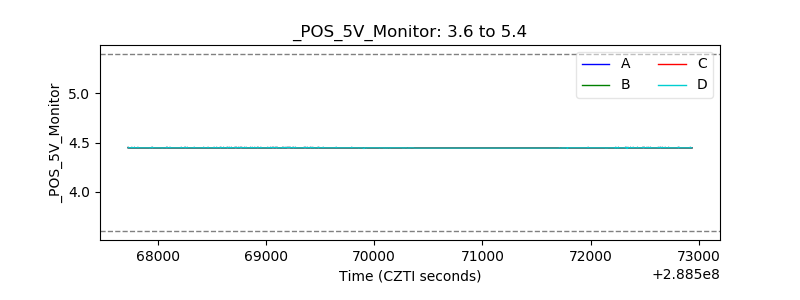 |
| _ROLL_ROT | 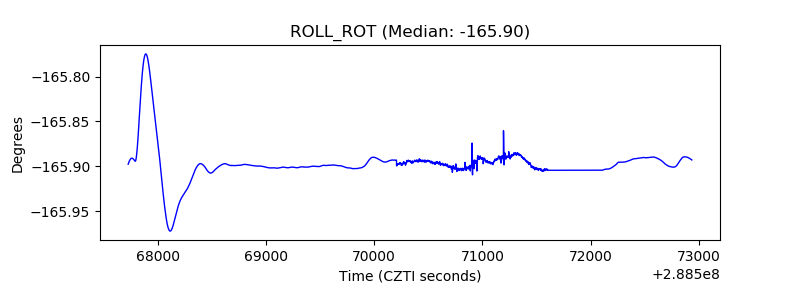 |
| _Roll_DEC | 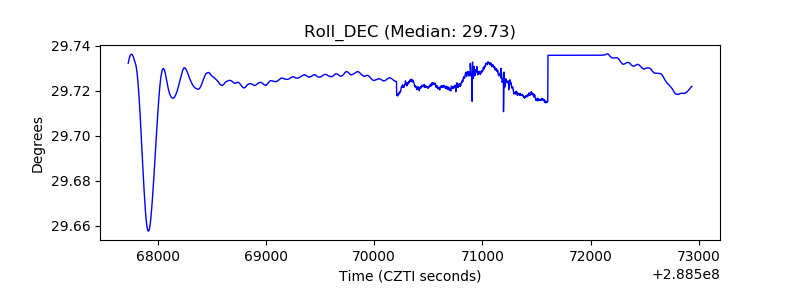 |
| _Roll_RA | 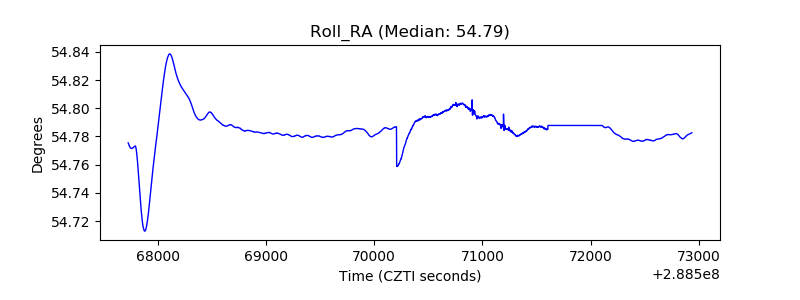 |
| Veto Counter | 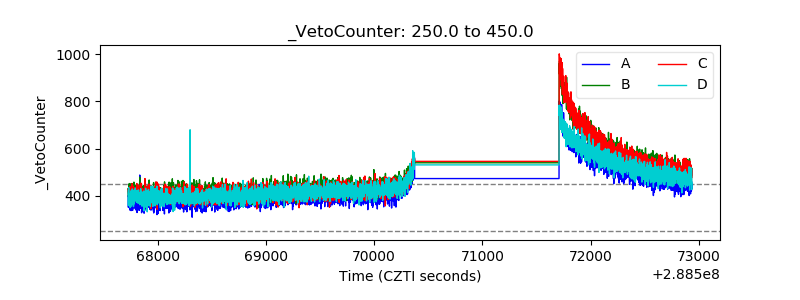 |