| Param | Original file | Final file |
|---|---|---|
| Filename | modeM0/AS1A05_227T06_9000002730_18411cztM0_level2.evt | modeM0/AS1A05_227T06_9000002730_18411cztM0_level2_quad_clean.evt |
| Size (bytes) | 543,945,600 | 75,893,760 |
| Size | 518.7 MB | 72.4 MB |
| Events in quadrant A | 3,319,934 | 477,132 |
| Events in quadrant B | 5,119,421 | 470,231 |
| Events in quadrant C | 3,365,269 | 459,924 |
| Events in quadrant D | 4,232,719 | 441,654 |
| Mode SS | |||
|---|---|---|---|
| Quadrant | BADHDUFLAG | Total packets | Discarded packets |
| A | 0 | 130 | 0 |
| B | 0 | 130 | 0 |
| C | 0 | 130 | 0 |
| D | 0 | 130 | 0 |
| Mode M0 | |||
|---|---|---|---|
| Quadrant | BADHDUFLAG | Total packets | Discarded packets |
| A | 0 | 13757 | 2 |
| B | 0 | 19564 | 2 |
| C | 0 | 13851 | 2 |
| D | 0 | 16856 | 2 |
| Mode M9 | |||
|---|---|---|---|
| Quadrant | BADHDUFLAG | Total packets | Discarded packets |
| A | 0 | 19 | 0 |
| B | 0 | 20 | 0 |
| C | 0 | 20 | 0 |
| D | 0 | 20 | 0 |
| Quadrant | Total seconds | Saturated seconds | Saturation percentage |
|---|---|---|---|
| A | 6439 | 38 | 0.590154% |
| B | 6439 | 499 | 7.749651% |
| C | 6439 | 66 | 1.025004% |
| D | 6439 | 110 | 1.708340% |
Noise dominated data is calculated using 1-second bins in cleaned event files. If a bin has >2000 counts, and if more than 50% of those come from <1% of pixels, then it is considered to be noise-dominated and hence unusable.
| Quadrant | # 1 sec bins | Bins with >0 counts | Bins with >2000 counts | High rate bins dominated by noise | Noise dominated (total time) | Noise dominated (detector-on time) | Marked lightcurve |
|---|---|---|---|---|---|---|---|
| A | 7769 | 6440 | 0 | 0 | 0.00% | 0.00% | 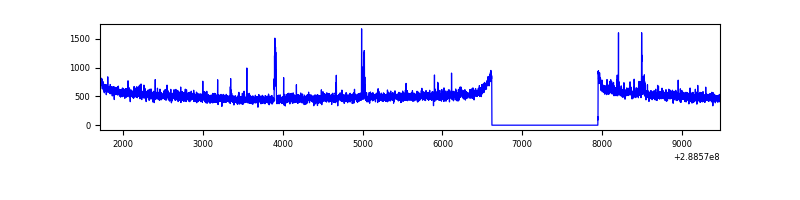 |
| B | 7769 | 6440 | 288 | 288 | 3.71% | 4.47% | 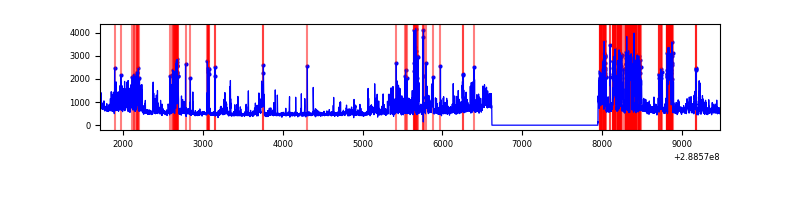 |
| C | 7769 | 6440 | 3 | 3 | 0.04% | 0.05% | 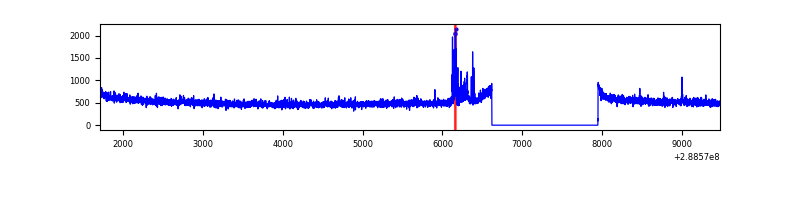 |
| D | 7769 | 6440 | 51 | 51 | 0.66% | 0.79% | 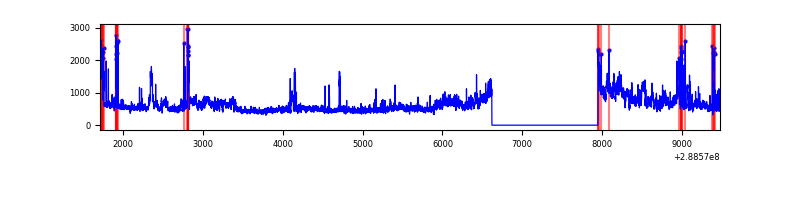 |
Top three noisy pixels from each quadrant. If the there are fewer than three noisy pixels in the level2.evt file, extra rows are filled as -1
| Pixel properties | Quadrant properties | ||||||
|---|---|---|---|---|---|---|---|
| Quadrant | DetID | PixID | Counts | Sigma | Mean | Median | Sigma |
| A | 15 | 174 | 48923 | 286.07 | 843 | 827 | 168.1 |
| A | 4 | 2 | 24817 | 142.69 | 843 | 827 | 168.1 |
| A | 0 | 226 | 7509 | 39.74 | 843 | 827 | 168.1 |
| B | 10 | 245 | 1829196 | 11867.24 | 824 | 805 | 154.1 |
| B | 12 | 111 | 17288 | 106.98 | 824 | 805 | 154.1 |
| B | 11 | 111 | 15148 | 93.09 | 824 | 805 | 154.1 |
| C | 14 | 238 | 127635 | 670.36 | 809 | 816 | 189.2 |
| C | 0 | 207 | 70655 | 369.17 | 809 | 816 | 189.2 |
| C | 3 | 233 | 14104 | 70.24 | 809 | 816 | 189.2 |
| D | 8 | 230 | 456544 | 2342.03 | 807 | 785 | 194.6 |
| D | 1 | 52 | 432008 | 2215.94 | 807 | 785 | 194.6 |
| D | 12 | 110 | 138682 | 708.62 | 807 | 785 | 194.6 |
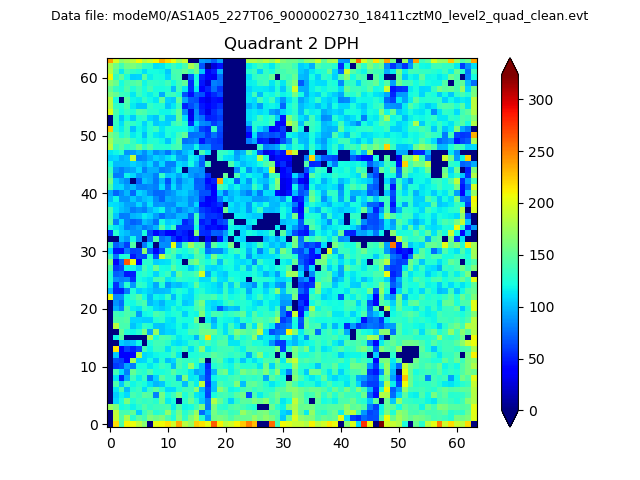
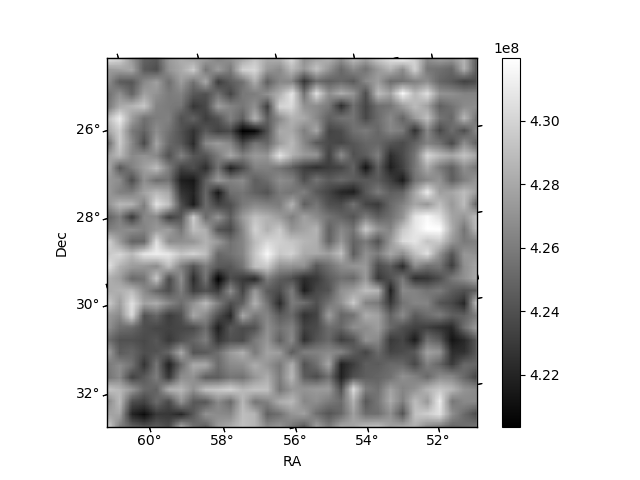
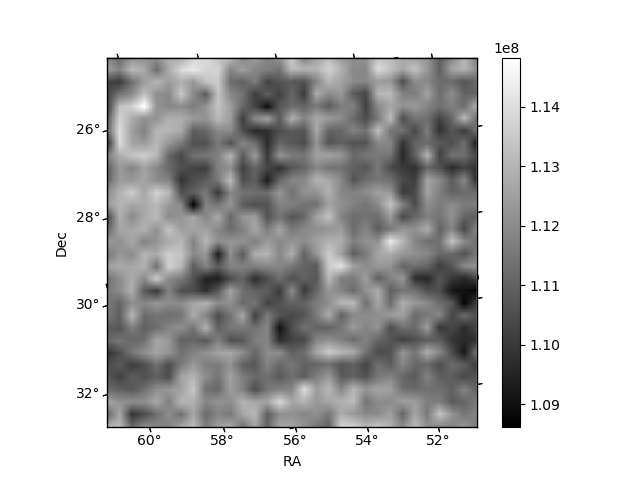
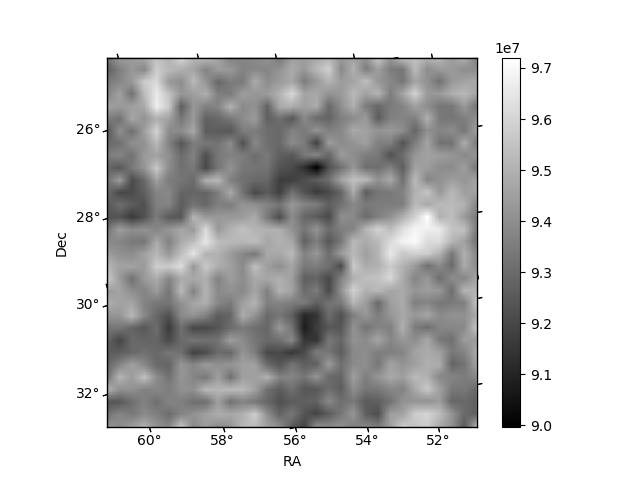
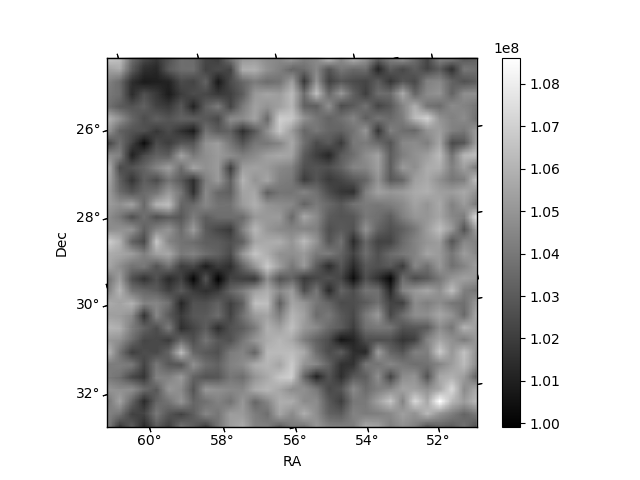
Histogram calculated using DETX and DETY for each event in the final _common_clean file
| Quadrant A | 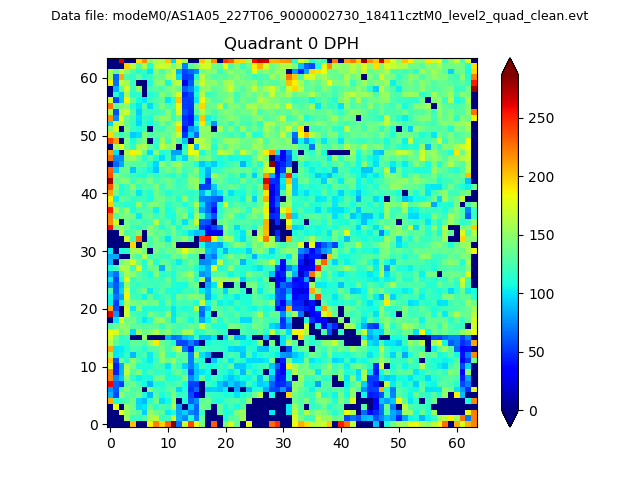 |
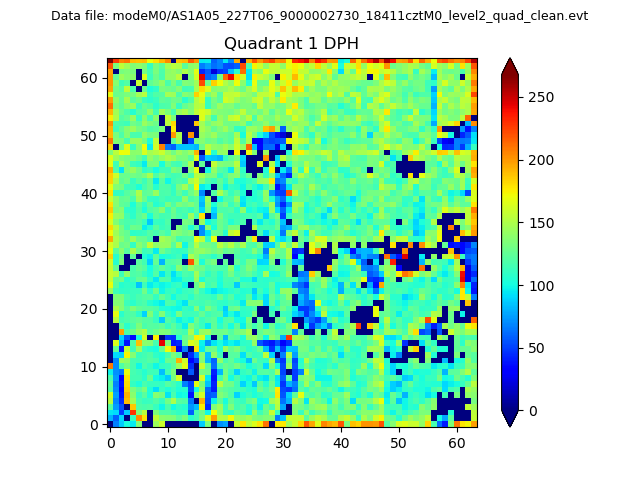 |
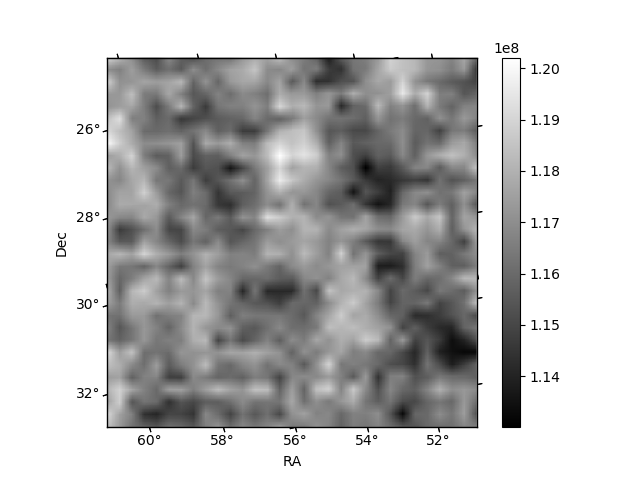
Quadrant B |
|---|---|---|---|
| Quadrant D | 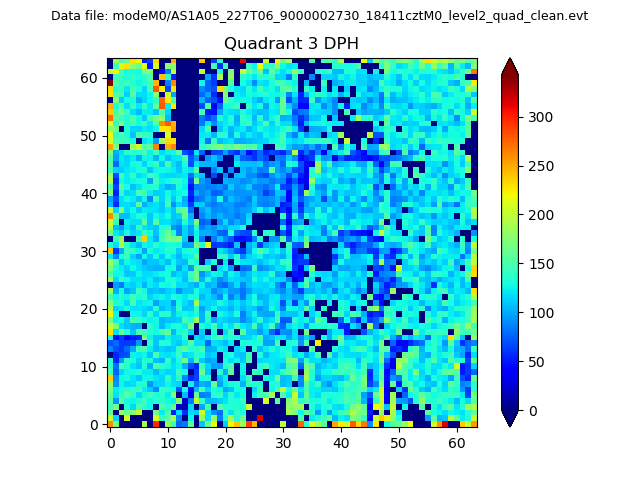 |
 |
Quadrant C |
| Plot type | Count rate plots | Images |
|---|---|---|
| Comparison with Poisson distribution Blue bars denote a histogram of data divided into 1 sec bins. Red curve is a Poisson curve with rate = median count rate of data. |
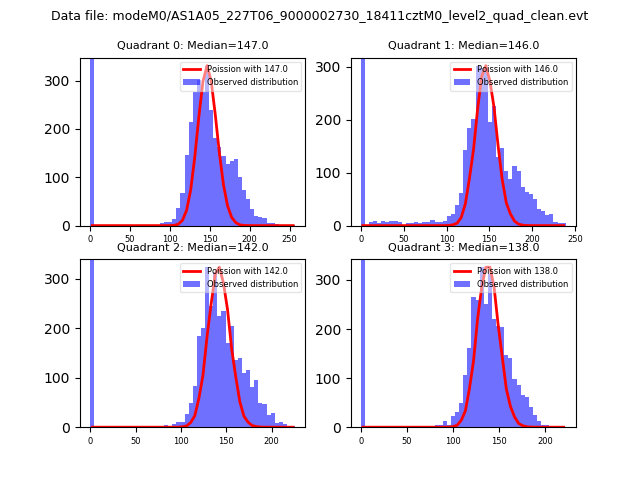 |
 |
| Quadrant-wise count rates Data is divided into 100 sec bins |
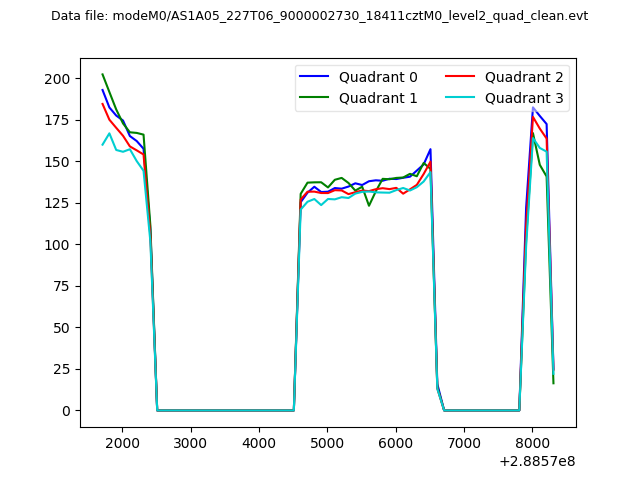 |
|
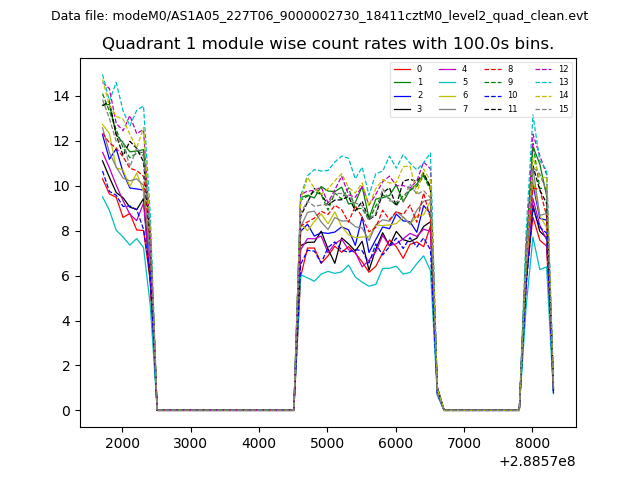
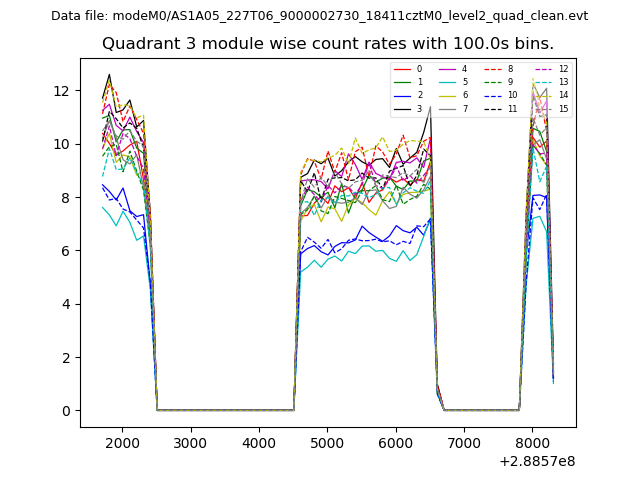
| Module-wise count rates for Quadrant A Data is divided into 100 sec bins |
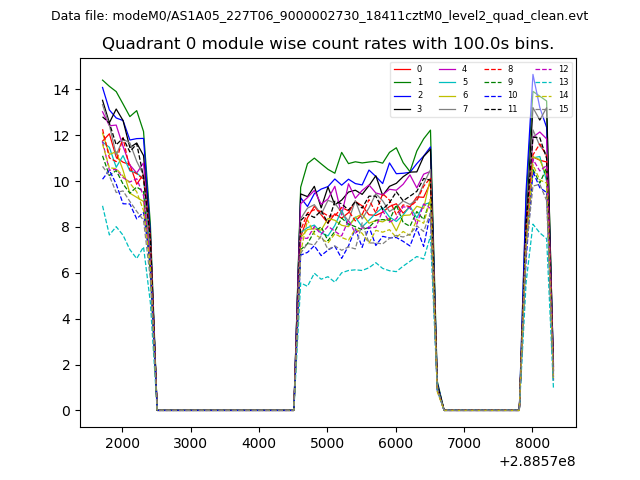 |
 |
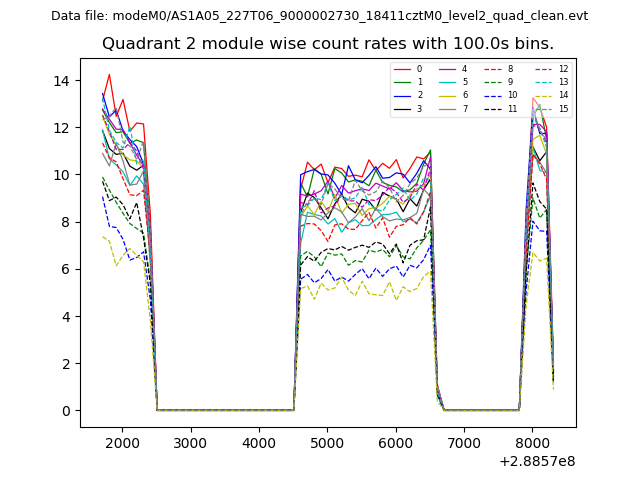
| Module-wise count rates for Quadrant B Data is divided into 100 sec bins |
 |
 |
| Module-wise count rates for Quadrant C Data is divided into 100 sec bins |
 |
 |
| Module-wise count rates for Quadrant D Data is divided into 100 sec bins |
 |
 |
| Parameter | Plot |
|---|---|
| CZT HV Monitor | 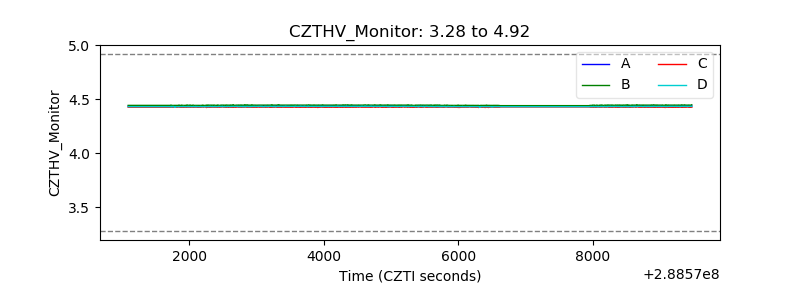 |
| D_VDD | 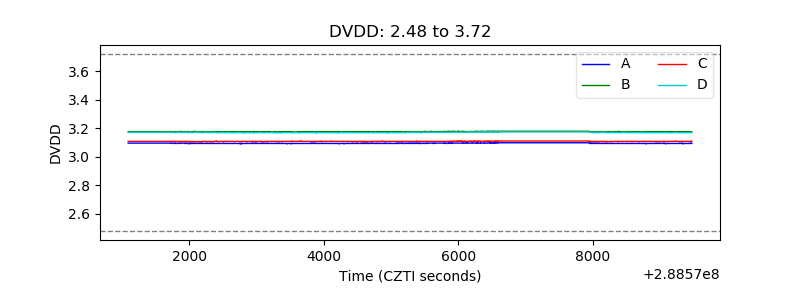 |
| Temperature 1 | 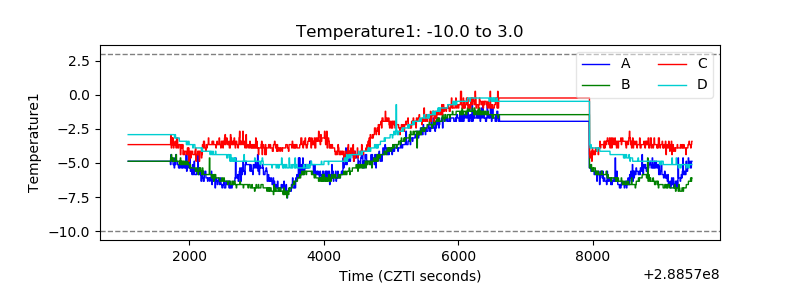 |
| Veto HV Monitor | 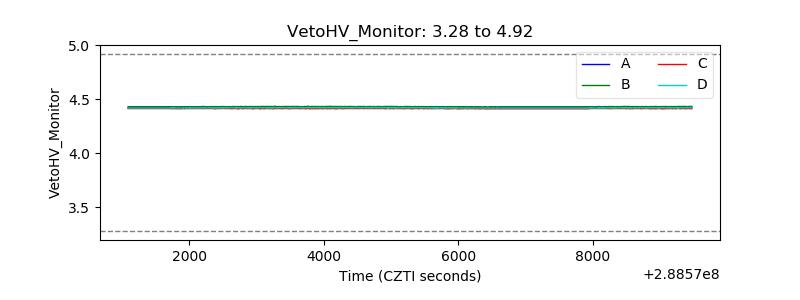 |
| Veto LLD | 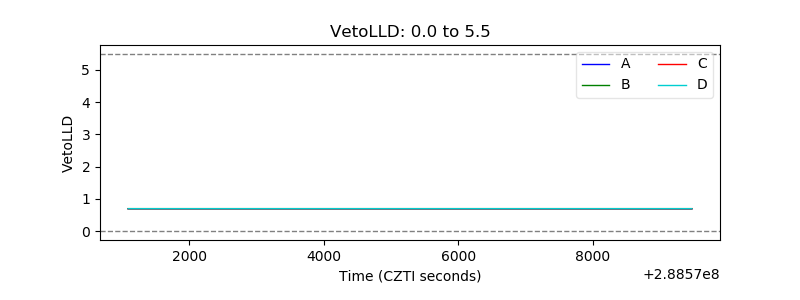 |
| Alpha Counter | 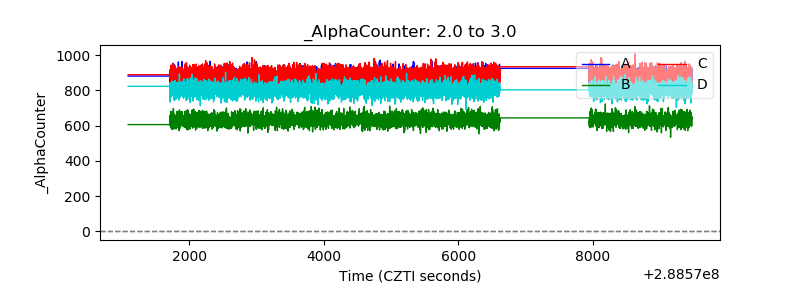 |
| _CPM_Rate | 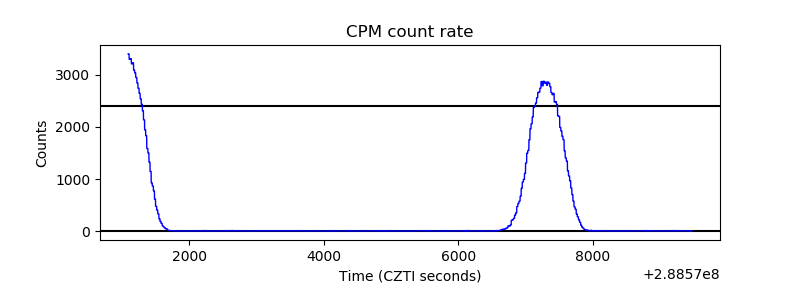 |
| CZT Counter | 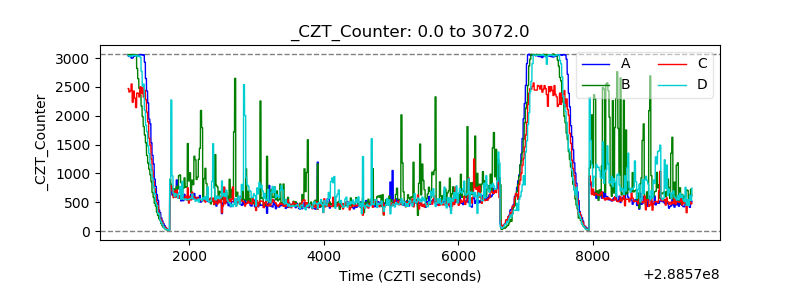 |
| +2.5 Volts monitor |  |
| +5 Volts monitor |  |
| _ROLL_ROT | 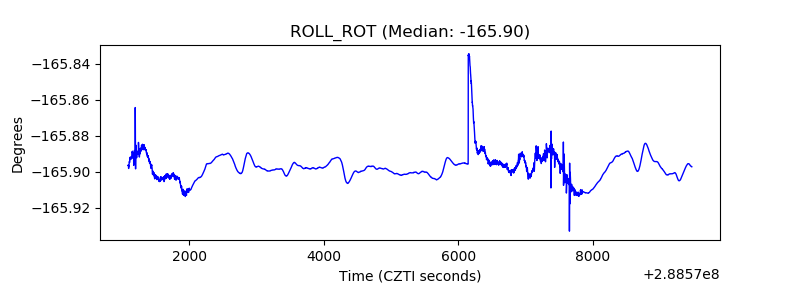 |
| _Roll_DEC | 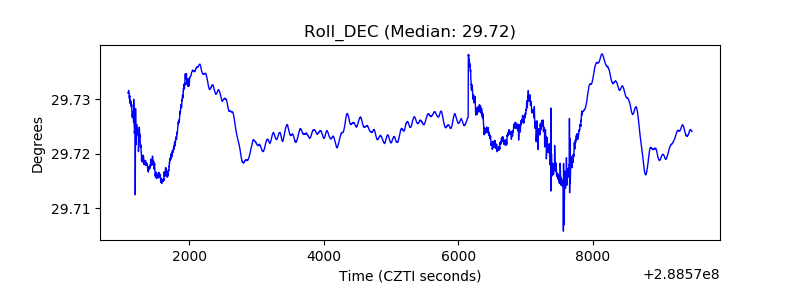 |
| _Roll_RA | 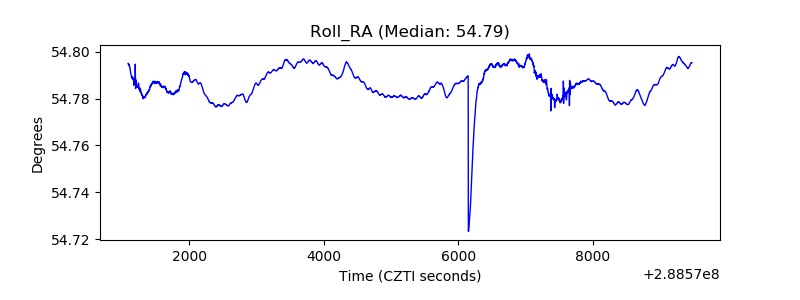 |
| Veto Counter | 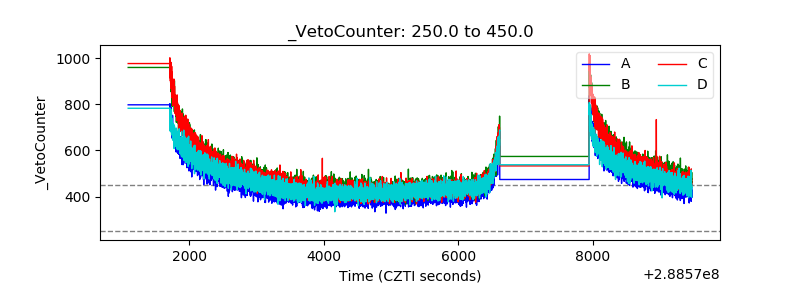 |