| Param | Original file | Final file |
|---|---|---|
| Filename | modeM0/AS1A05_227T06_9000002730_18412cztM0_level2.evt | modeM0/AS1A05_227T06_9000002730_18412cztM0_level2_quad_clean.evt |
| Size (bytes) | 491,567,040 | 56,952,000 |
| Size | 468.8 MB | 54.3 MB |
| Events in quadrant A | 2,982,301 | 336,188 |
| Events in quadrant B | 4,236,325 | 338,970 |
| Events in quadrant C | 2,994,282 | 323,530 |
| Events in quadrant D | 4,271,844 | 310,948 |
| Mode SS | |||
|---|---|---|---|
| Quadrant | BADHDUFLAG | Total packets | Discarded packets |
| A | 0 | 118 | 0 |
| B | 0 | 118 | 0 |
| C | 0 | 118 | 0 |
| D | 0 | 118 | 0 |
| Mode M0 | |||
|---|---|---|---|
| Quadrant | BADHDUFLAG | Total packets | Discarded packets |
| A | 0 | 12369 | 1 |
| B | 0 | 16546 | 1 |
| C | 0 | 12346 | 1 |
| D | 0 | 16615 | 1 |
| Mode M9 | |||
|---|---|---|---|
| Quadrant | BADHDUFLAG | Total packets | Discarded packets |
| A | 0 | 14 | 0 |
| B | 0 | 14 | 0 |
| C | 0 | 14 | 0 |
| D | 0 | 14 | 0 |
| Quadrant | Total seconds | Saturated seconds | Saturation percentage |
|---|---|---|---|
| A | 5940 | 45 | 0.757576% |
| B | 5941 | 244 | 4.107053% |
| C | 5941 | 69 | 1.161421% |
| D | 5941 | 267 | 4.494193% |
Noise dominated data is calculated using 1-second bins in cleaned event files. If a bin has >2000 counts, and if more than 50% of those come from <1% of pixels, then it is considered to be noise-dominated and hence unusable.
| Quadrant | # 1 sec bins | Bins with >0 counts | Bins with >2000 counts | High rate bins dominated by noise | Noise dominated (total time) | Noise dominated (detector-on time) | Marked lightcurve |
|---|---|---|---|---|---|---|---|
| A | 7251 | 5941 | 1 | 1 | 0.01% | 0.02% | 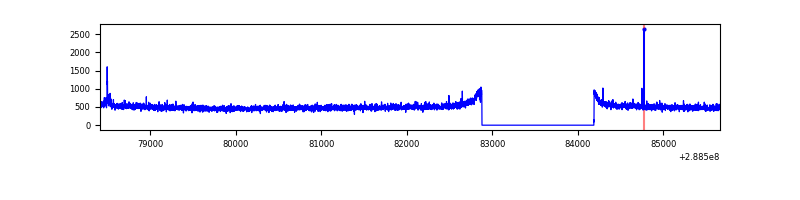 |
| B | 7252 | 5942 | 116 | 116 | 1.60% | 1.95% | 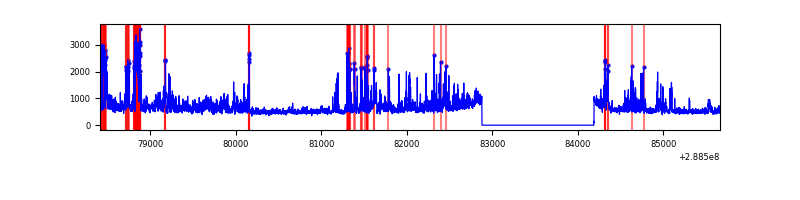 |
| C | 7252 | 5942 | 0 | 0 | 0.00% | 0.00% | 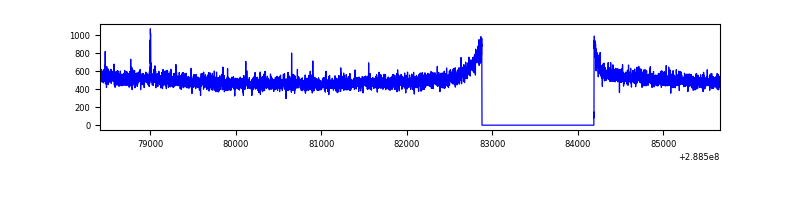 |
| D | 7252 | 5942 | 204 | 204 | 2.81% | 3.43% | 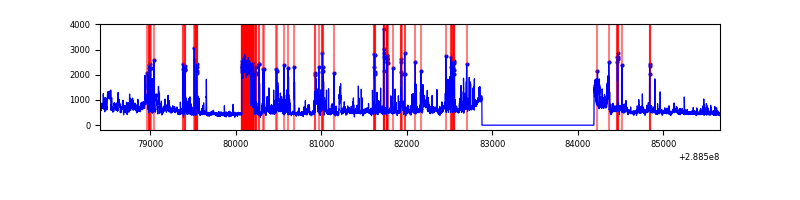 |
Top three noisy pixels from each quadrant. If the there are fewer than three noisy pixels in the level2.evt file, extra rows are filled as -1
| Pixel properties | Quadrant properties | ||||||
|---|---|---|---|---|---|---|---|
| Quadrant | DetID | PixID | Counts | Sigma | Mean | Median | Sigma |
| A | 15 | 174 | 23335 | 146.16 | 768 | 754 | 154.5 |
| A | 0 | 226 | 6564 | 37.61 | 768 | 754 | 154.5 |
| A | 3 | 137 | 5523 | 30.87 | 768 | 754 | 154.5 |
| B | 10 | 245 | 1156232 | 8056.19 | 764 | 748 | 143.4 |
| B | 7 | 220 | 42666 | 292.26 | 764 | 748 | 143.4 |
| B | 0 | 244 | 19446 | 130.36 | 764 | 748 | 143.4 |
| C | 14 | 238 | 115314 | 671.79 | 733 | 739 | 170.6 |
| C | 3 | 233 | 18791 | 105.85 | 733 | 739 | 170.6 |
| C | 13 | 61 | 5216 | 26.25 | 733 | 739 | 170.6 |
| D | 1 | 52 | 1177462 | 6663.64 | 725 | 705 | 176.6 |
| D | 8 | 230 | 256768 | 1450.01 | 725 | 705 | 176.6 |
| D | 13 | 168 | 25097 | 138.12 | 725 | 705 | 176.6 |
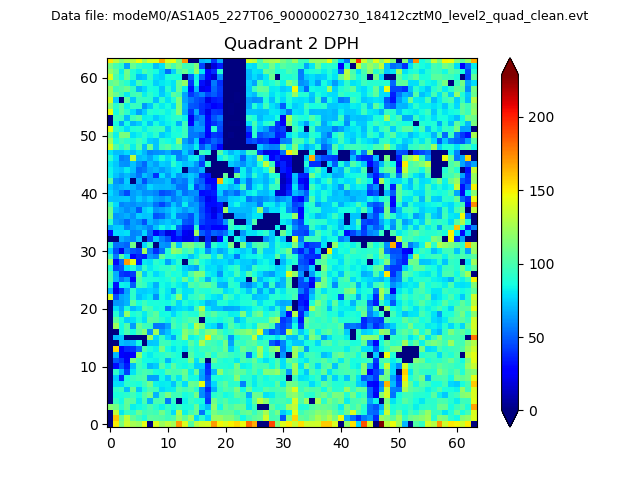
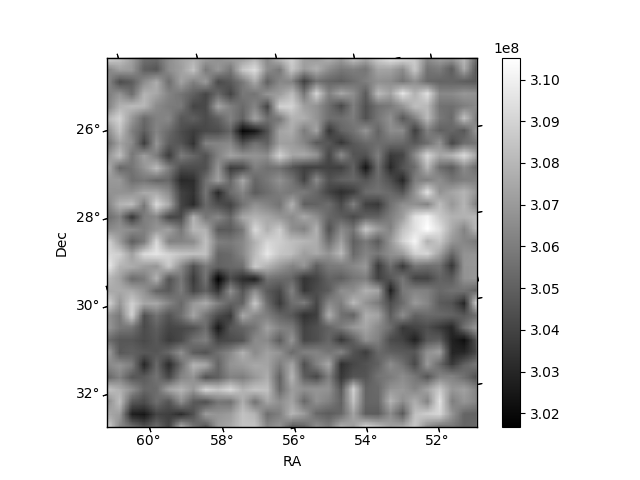
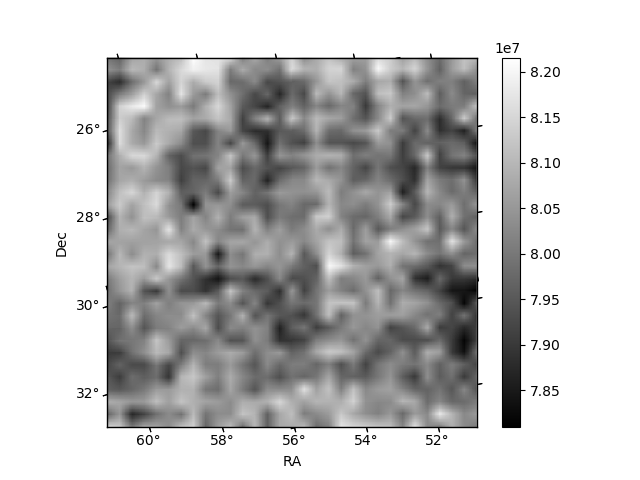
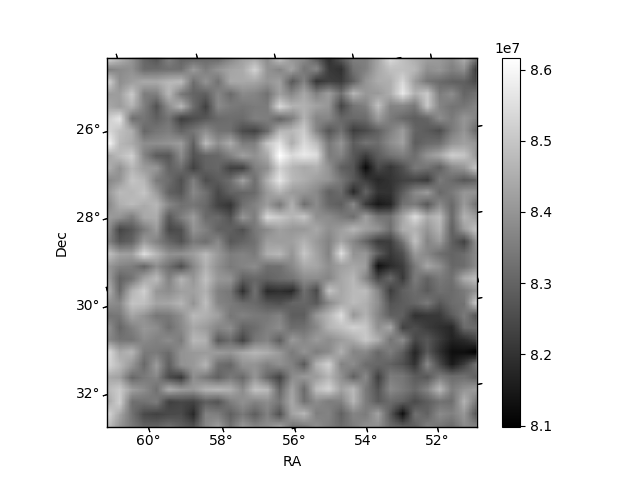
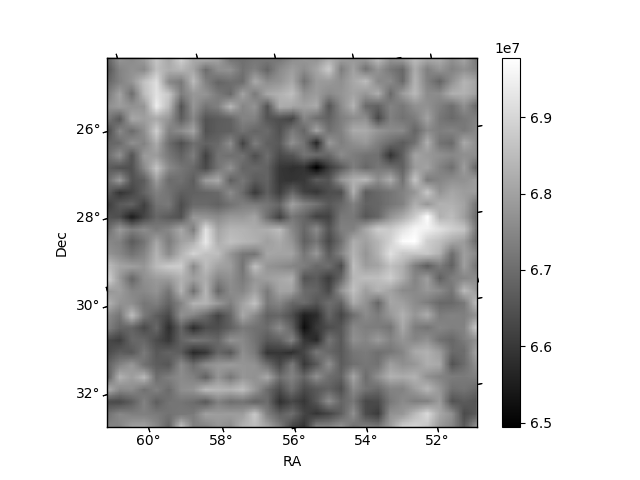
Histogram calculated using DETX and DETY for each event in the final _common_clean file
| Quadrant A | 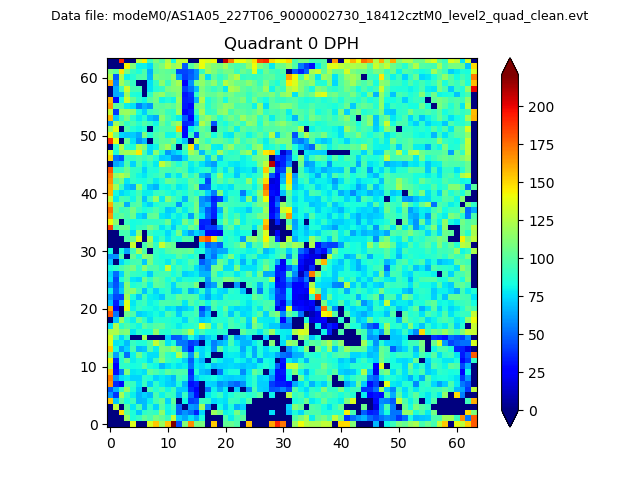 |
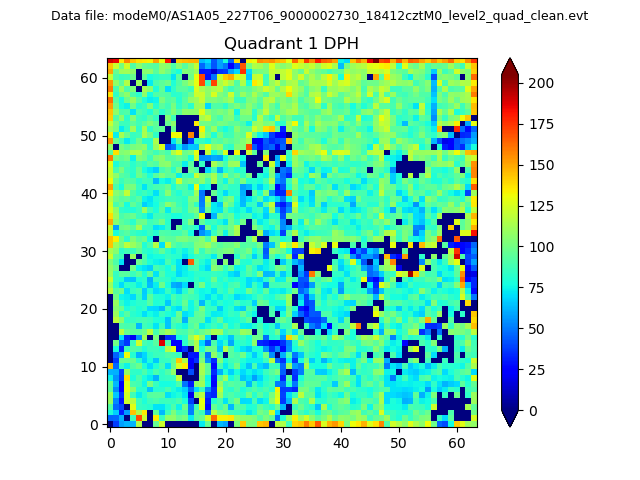 |
Quadrant B |
|---|---|---|---|
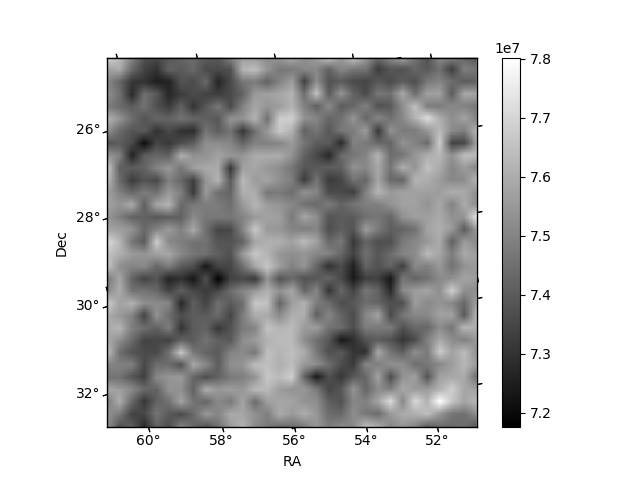
| Quadrant D | 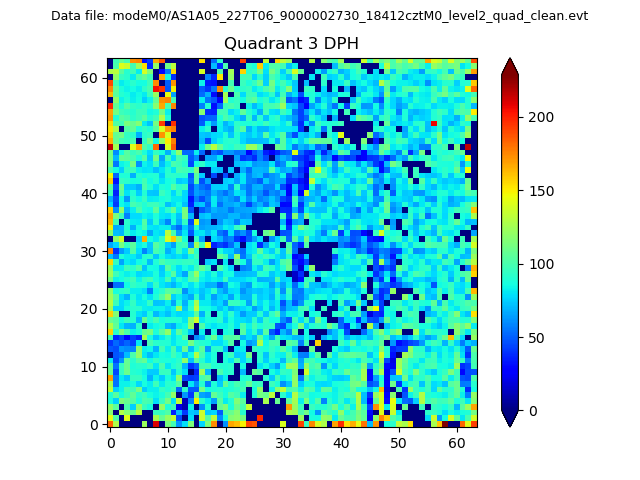 |
 |
Quadrant C |
| Plot type | Count rate plots | Images |
|---|---|---|
| Comparison with Poisson distribution Blue bars denote a histogram of data divided into 1 sec bins. Red curve is a Poisson curve with rate = median count rate of data. |
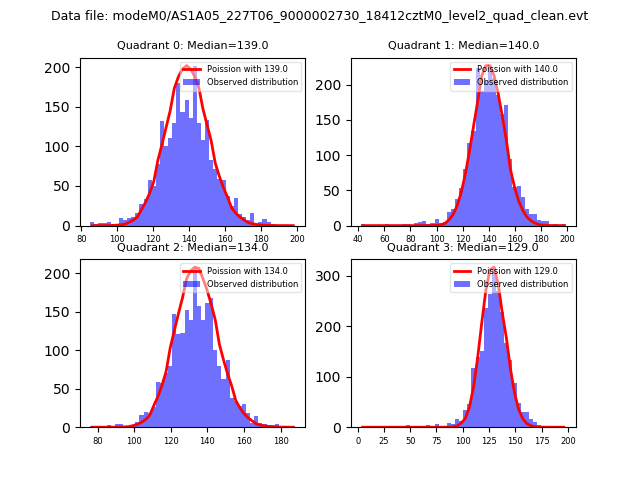 |
 |
| Quadrant-wise count rates Data is divided into 100 sec bins |
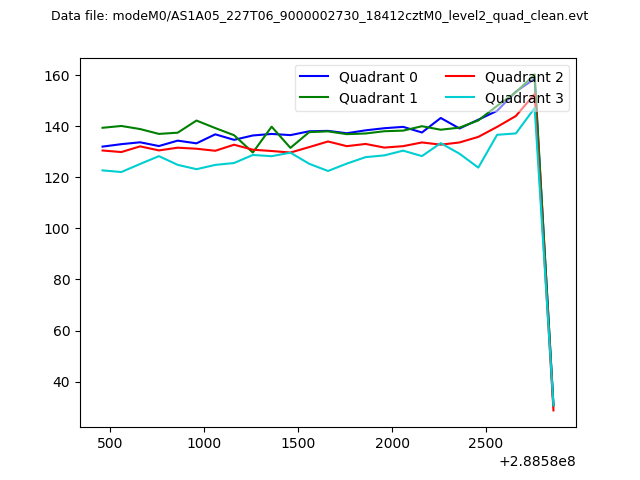 |
|
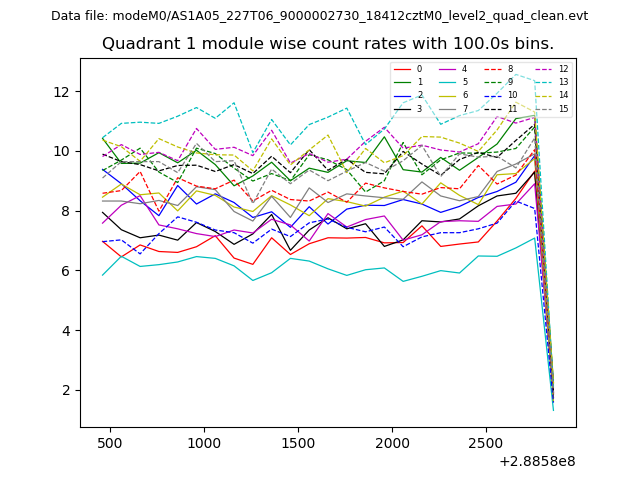
| Module-wise count rates for Quadrant A Data is divided into 100 sec bins |
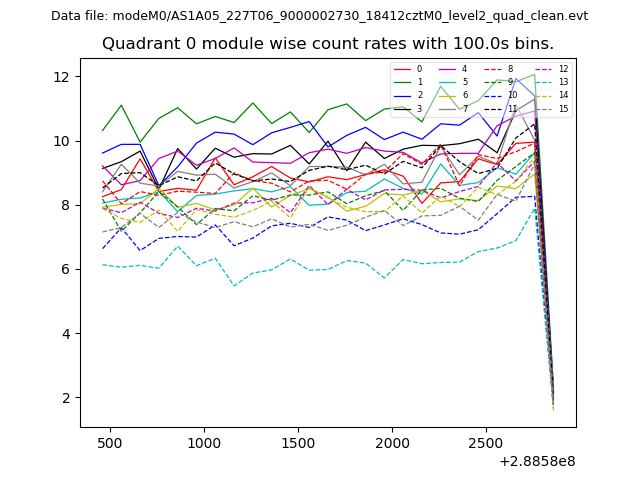 |
 |
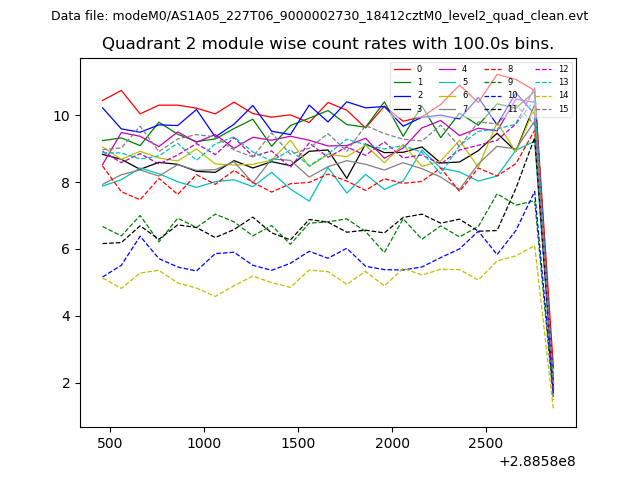
| Module-wise count rates for Quadrant B Data is divided into 100 sec bins |
 |
 |
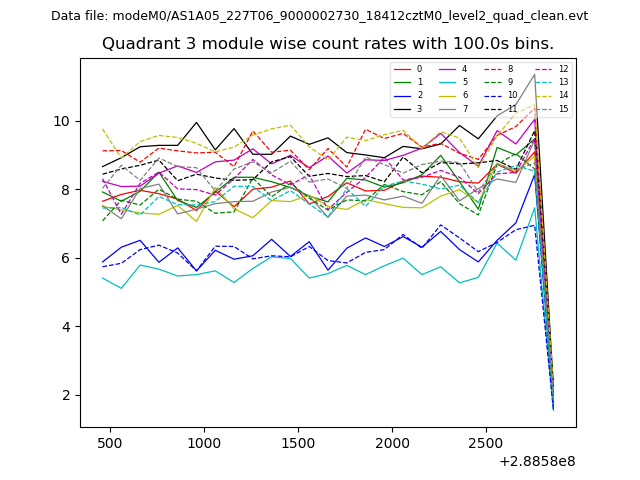
| Module-wise count rates for Quadrant C Data is divided into 100 sec bins |
 |
 |
| Module-wise count rates for Quadrant D Data is divided into 100 sec bins |
 |
 |
| Parameter | Plot |
|---|---|
| CZT HV Monitor |  |
| D_VDD | 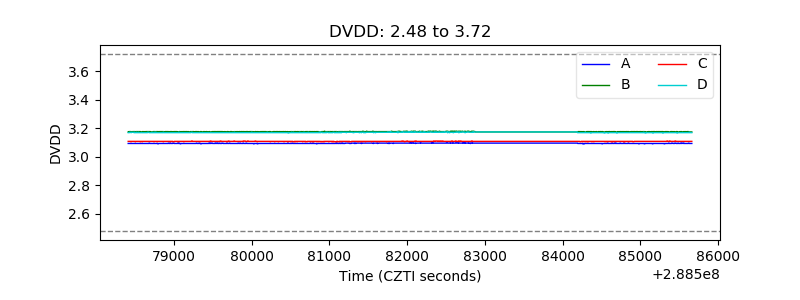 |
| Temperature 1 | 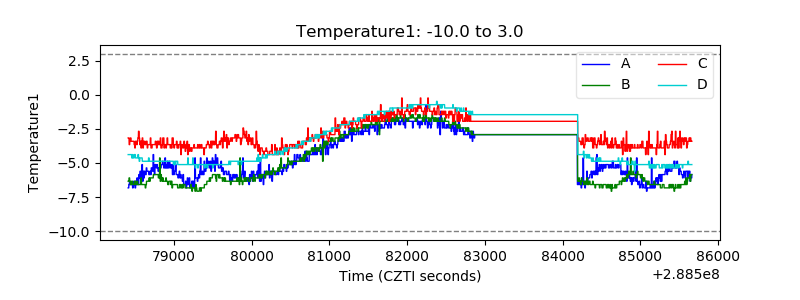 |
| Veto HV Monitor | 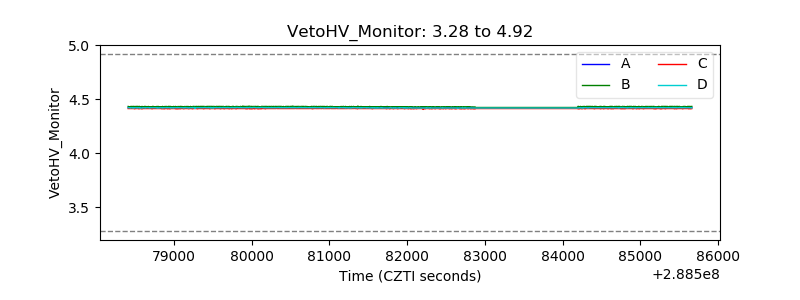 |
| Veto LLD | 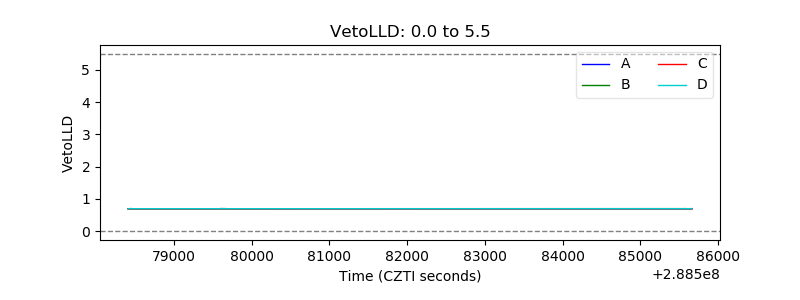 |
| Alpha Counter | 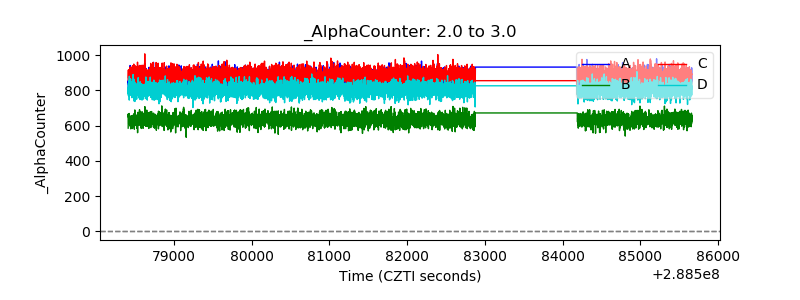 |
| _CPM_Rate | 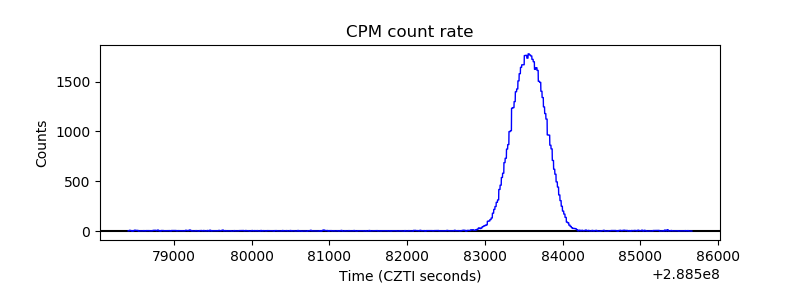 |
| CZT Counter | 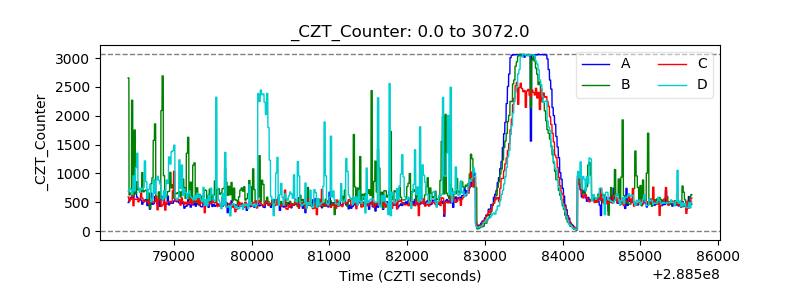 |
| +2.5 Volts monitor |  |
| +5 Volts monitor |  |
| _ROLL_ROT | 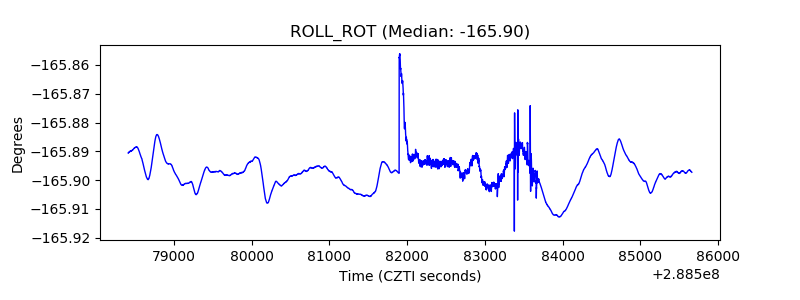 |
| _Roll_DEC | 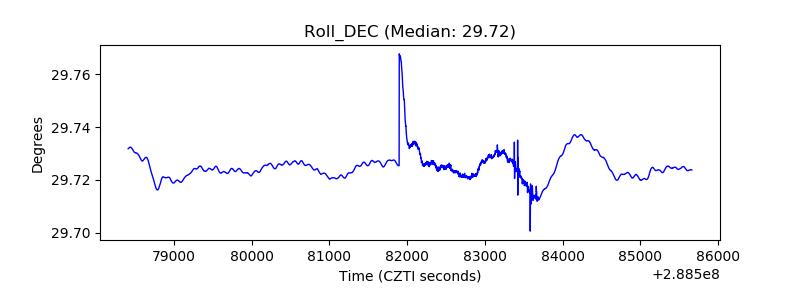 |
| _Roll_RA | 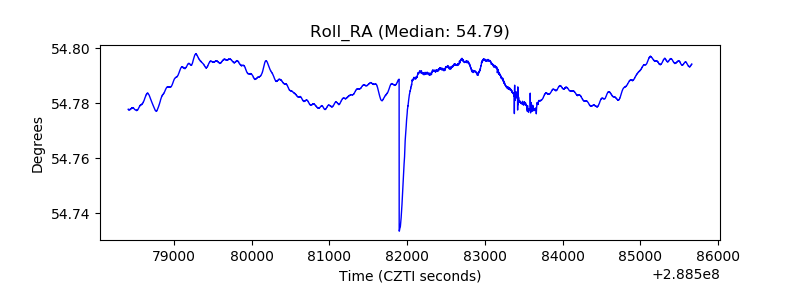 |
| Veto Counter | 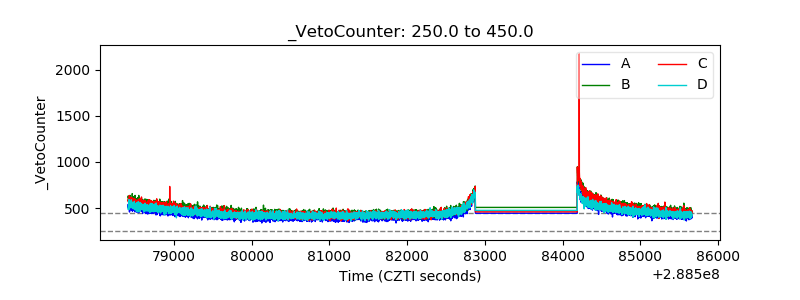 |