| Param | Original file | Final file |
|---|---|---|
| Filename | modeM0/AS1A05_227T06_9000002730_18413cztM0_level2.evt | modeM0/AS1A05_227T06_9000002730_18413cztM0_level2_quad_clean.evt |
| Size (bytes) | 498,960,000 | 66,432,960 |
| Size | 475.8 MB | 63.4 MB |
| Events in quadrant A | 3,209,008 | 400,960 |
| Events in quadrant B | 3,952,633 | 402,343 |
| Events in quadrant C | 3,203,752 | 385,525 |
| Events in quadrant D | 4,306,702 | 371,174 |
| Mode SS | |||
|---|---|---|---|
| Quadrant | BADHDUFLAG | Total packets | Discarded packets |
| A | 0 | 132 | 0 |
| B | 0 | 132 | 0 |
| C | 0 | 132 | 0 |
| D | 0 | 132 | 0 |
| Mode M0 | |||
|---|---|---|---|
| Quadrant | BADHDUFLAG | Total packets | Discarded packets |
| A | 0 | 13462 | 2 |
| B | 0 | 15693 | 2 |
| C | 0 | 13410 | 2 |
| D | 0 | 17008 | 2 |
| Mode M9 | |||
|---|---|---|---|
| Quadrant | BADHDUFLAG | Total packets | Discarded packets |
| A | 0 | 12 | 0 |
| B | 0 | 12 | 0 |
| C | 0 | 12 | 0 |
| D | 0 | 12 | 0 |
| Quadrant | Total seconds | Saturated seconds | Saturation percentage |
|---|---|---|---|
| A | 6468 | 57 | 0.881262% |
| B | 6467 | 164 | 2.535952% |
| C | 6467 | 64 | 0.989640% |
| D | 6467 | 145 | 2.242152% |
Noise dominated data is calculated using 1-second bins in cleaned event files. If a bin has >2000 counts, and if more than 50% of those come from <1% of pixels, then it is considered to be noise-dominated and hence unusable.
| Quadrant | # 1 sec bins | Bins with >0 counts | Bins with >2000 counts | High rate bins dominated by noise | Noise dominated (total time) | Noise dominated (detector-on time) | Marked lightcurve |
|---|---|---|---|---|---|---|---|
| A | 7633 | 6469 | 2 | 2 | 0.03% | 0.03% | 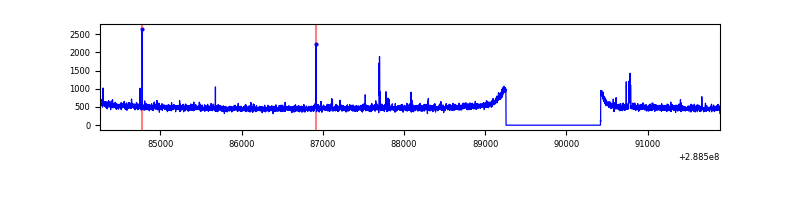 |
| B | 7632 | 6468 | 41 | 41 | 0.54% | 0.63% | 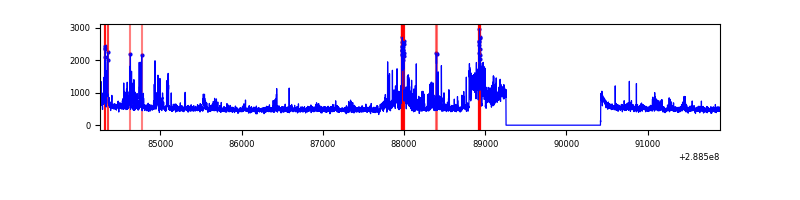 |
| C | 7632 | 6468 | 0 | 0 | 0.00% | 0.00% | 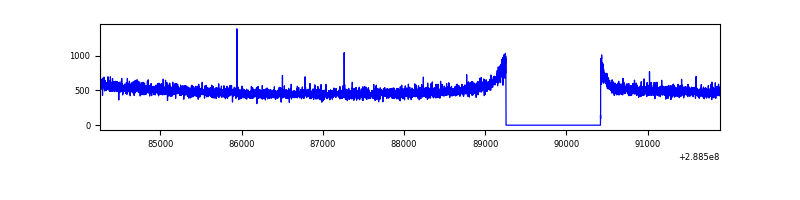 |
| D | 7632 | 6468 | 102 | 102 | 1.34% | 1.58% | 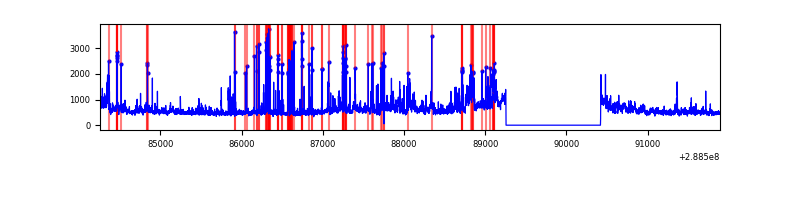 |
Top three noisy pixels from each quadrant. If the there are fewer than three noisy pixels in the level2.evt file, extra rows are filled as -1
| Pixel properties | Quadrant properties | ||||||
|---|---|---|---|---|---|---|---|
| Quadrant | DetID | PixID | Counts | Sigma | Mean | Median | Sigma |
| A | 15 | 174 | 26576 | 156.56 | 824 | 809 | 164.6 |
| A | 4 | 2 | 15591 | 89.81 | 824 | 809 | 164.6 |
| A | 0 | 226 | 7211 | 38.9 | 824 | 809 | 164.6 |
| B | 10 | 245 | 518005 | 3326.19 | 825 | 806 | 155.5 |
| B | 7 | 220 | 125253 | 800.34 | 825 | 806 | 155.5 |
| B | 0 | 228 | 38413 | 241.86 | 825 | 806 | 155.5 |
| C | 14 | 238 | 123436 | 665.74 | 787 | 791 | 184.2 |
| C | 3 | 233 | 8366 | 41.12 | 787 | 791 | 184.2 |
| C | 13 | 61 | 5569 | 25.94 | 787 | 791 | 184.2 |
| D | 1 | 52 | 533670 | 2794.62 | 784 | 762 | 190.7 |
| D | 8 | 230 | 392912 | 2056.47 | 784 | 762 | 190.7 |
| D | 7 | 238 | 222369 | 1162.13 | 784 | 762 | 190.7 |
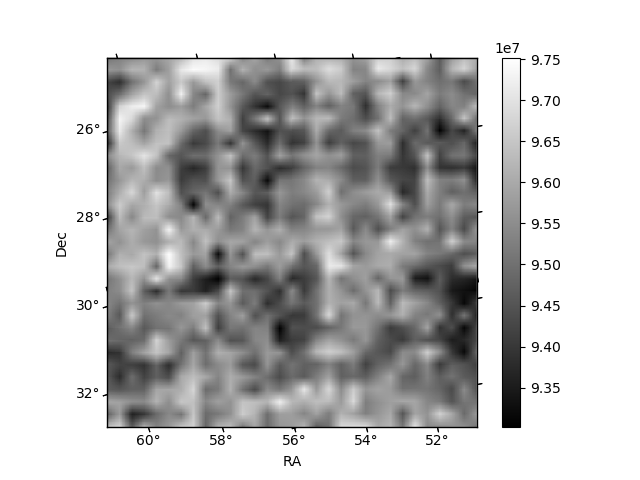
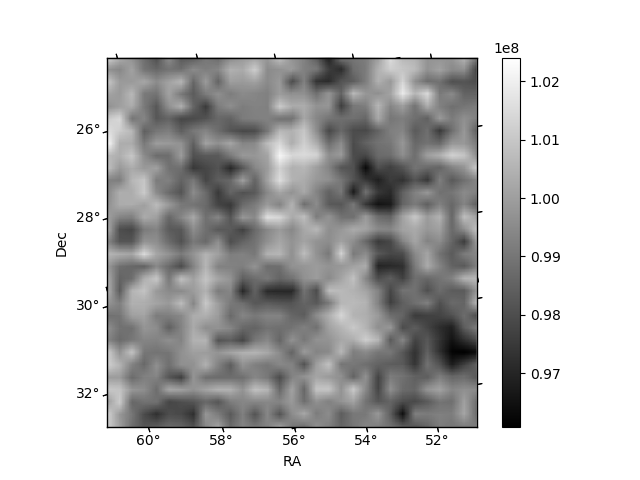
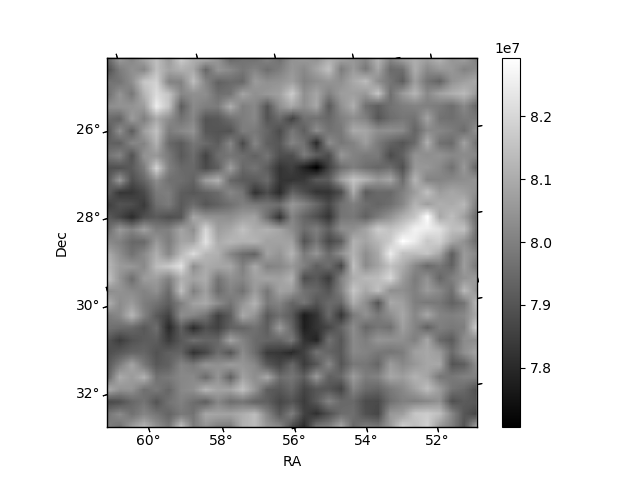
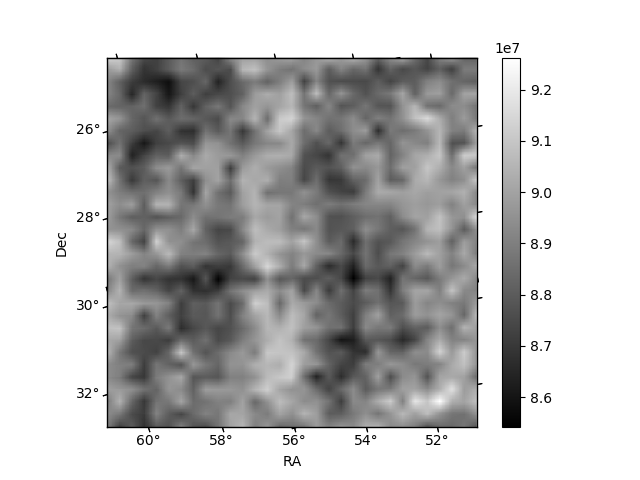
Histogram calculated using DETX and DETY for each event in the final _common_clean file
| Quadrant A | 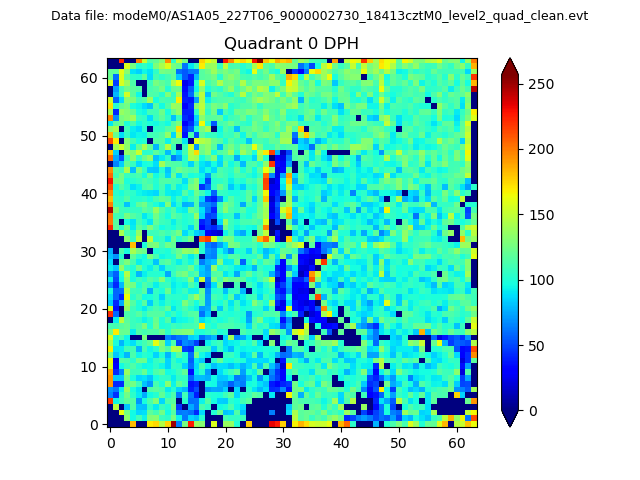 |
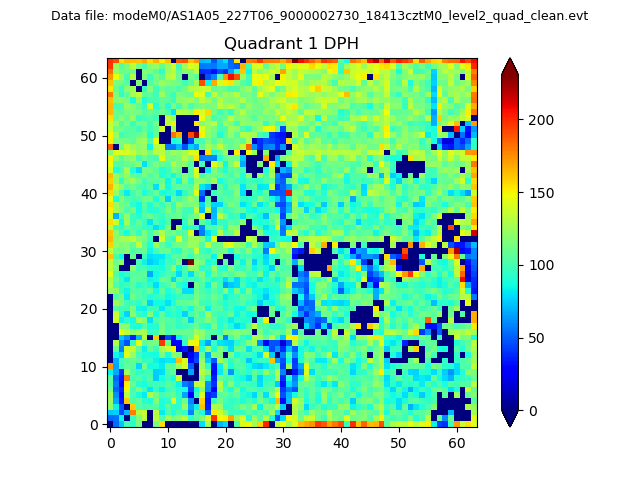 |
Quadrant B |
|---|---|---|---|
| Quadrant D | 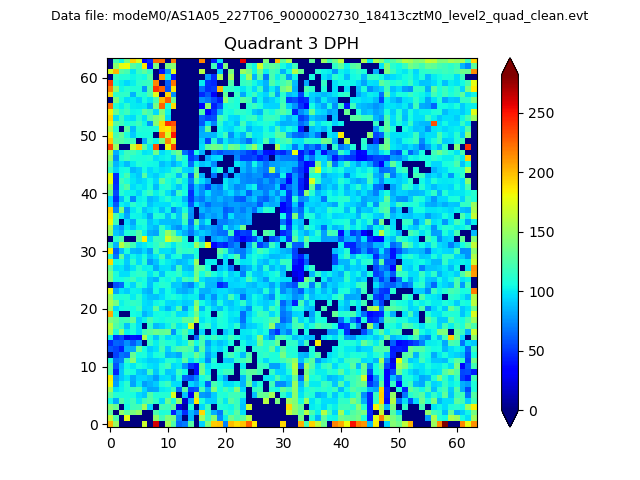 |
 |
Quadrant C |
| Plot type | Count rate plots | Images |
|---|---|---|
| Comparison with Poisson distribution Blue bars denote a histogram of data divided into 1 sec bins. Red curve is a Poisson curve with rate = median count rate of data. |
 |
 |
| Quadrant-wise count rates Data is divided into 100 sec bins |
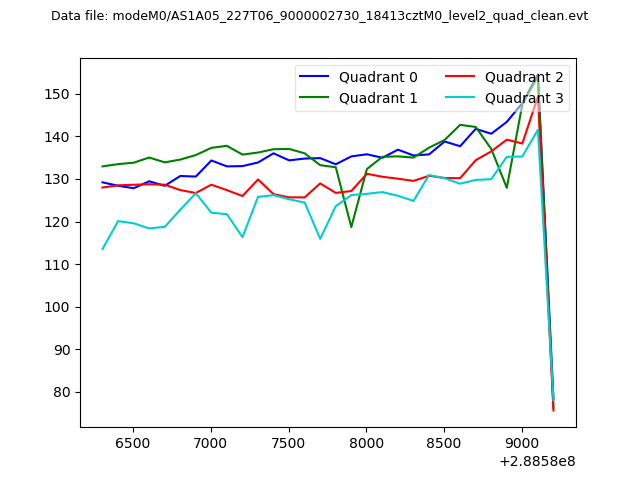 |
|
| Module-wise count rates for Quadrant A Data is divided into 100 sec bins |
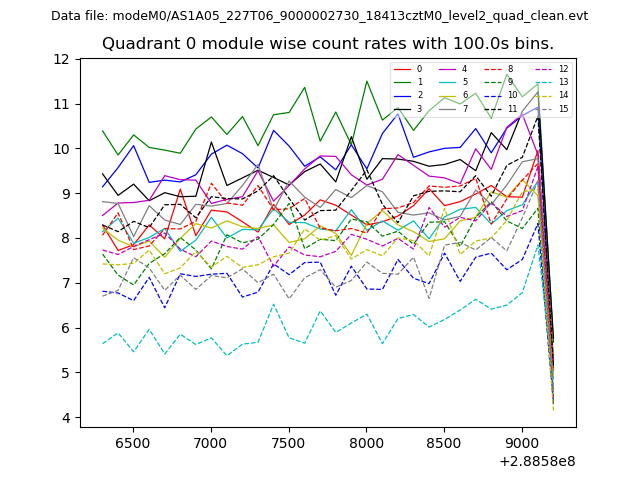 |
 |
| Module-wise count rates for Quadrant B Data is divided into 100 sec bins |
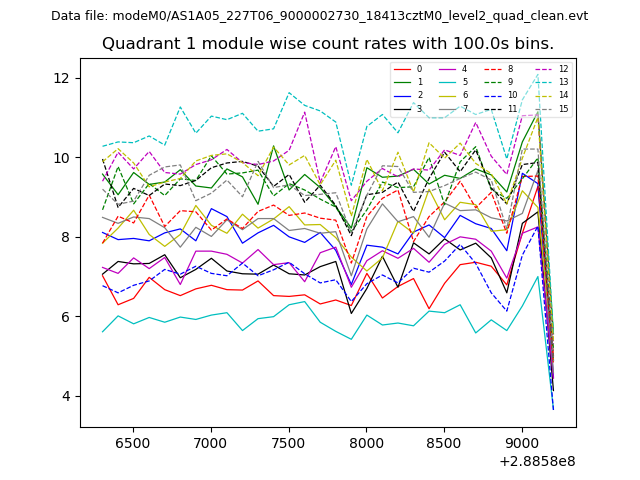 |
 |
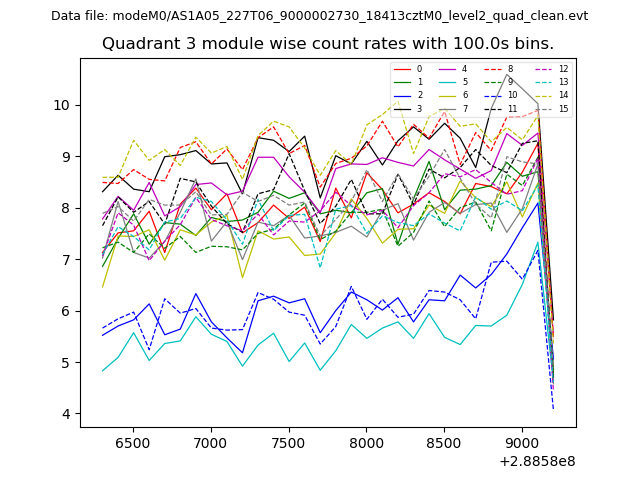
| Module-wise count rates for Quadrant C Data is divided into 100 sec bins |
 |
 |
| Module-wise count rates for Quadrant D Data is divided into 100 sec bins |
 |
 |
| Parameter | Plot |
|---|---|
| CZT HV Monitor |  |
| D_VDD | 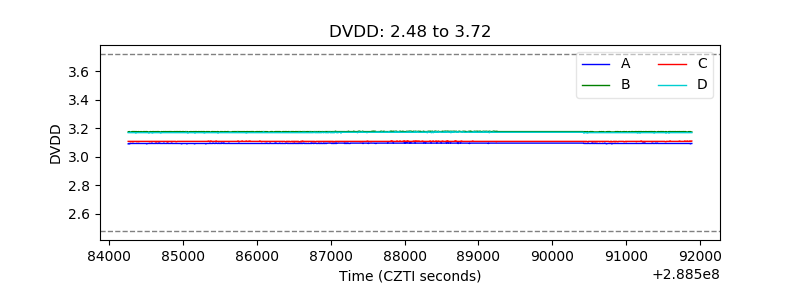 |
| Temperature 1 | 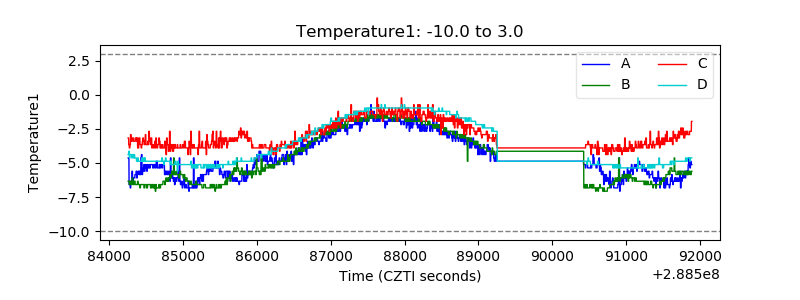 |
| Veto HV Monitor | 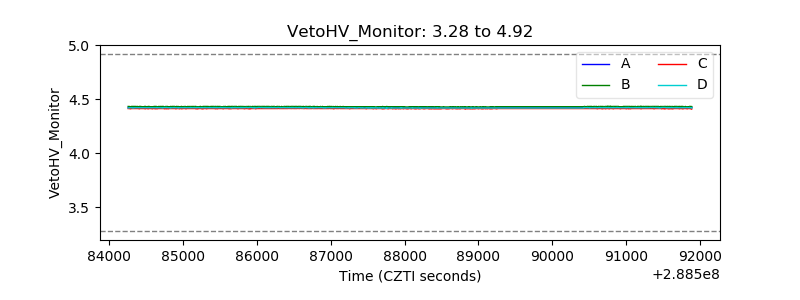 |
| Veto LLD | 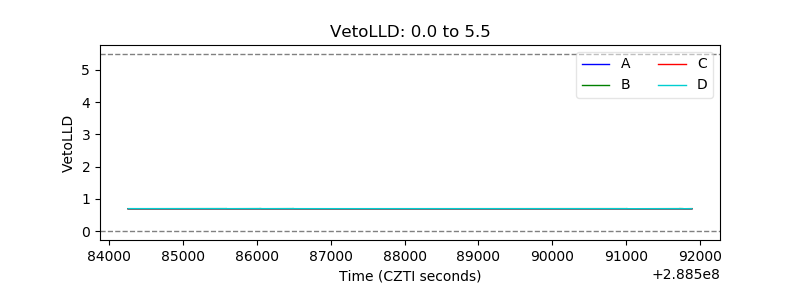 |
| Alpha Counter | 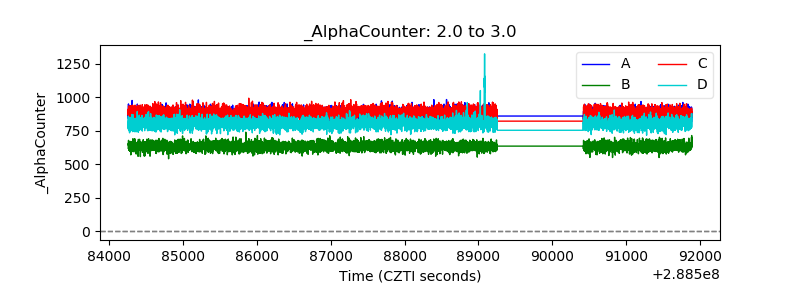 |
| _CPM_Rate | 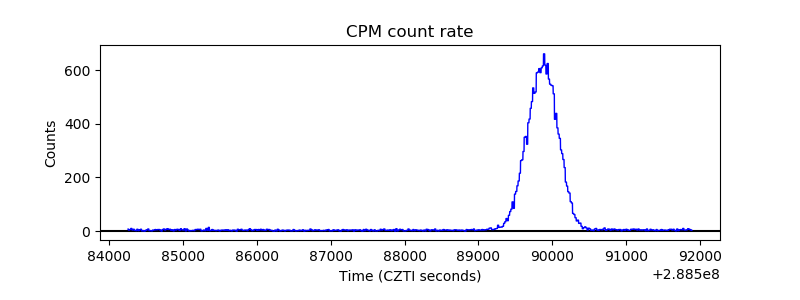 |
| CZT Counter | 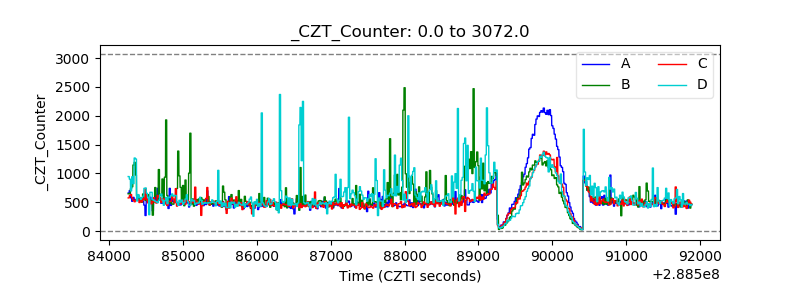 |
| +2.5 Volts monitor |  |
| +5 Volts monitor |  |
| _ROLL_ROT | 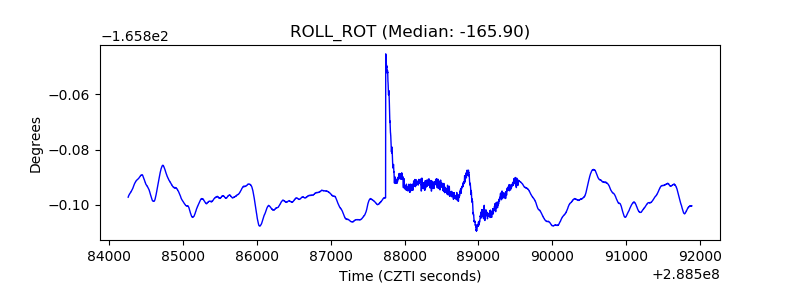 |
| _Roll_DEC | 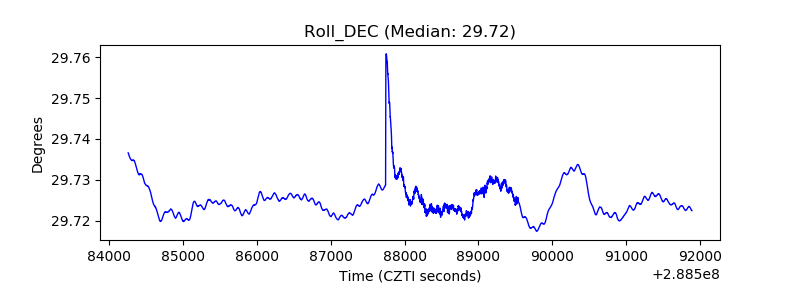 |
| _Roll_RA | 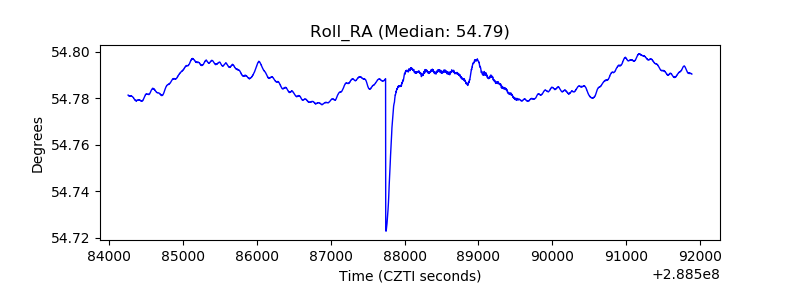 |
| Veto Counter | 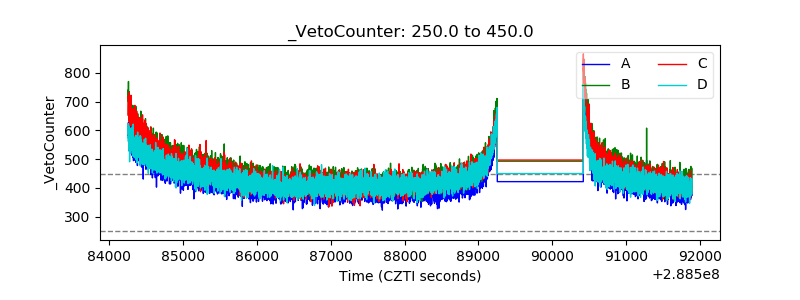 |