| Param | Original file | Final file |
|---|---|---|
| Filename | modeM0/AS1A05_227T06_9000002730_18415cztM0_level2.evt | modeM0/AS1A05_227T06_9000002730_18415cztM0_level2_quad_clean.evt |
| Size (bytes) | 277,162,560 | 61,228,800 |
| Size | 264.3 MB | 58.4 MB |
| Events in quadrant A | 2,106,531 | 398,569 |
| Events in quadrant B | 1,975,835 | 408,651 |
| Events in quadrant C | 1,924,046 | 387,168 |
| Events in quadrant D | 2,116,158 | 379,444 |
| Mode SS | |||
|---|---|---|---|
| Quadrant | BADHDUFLAG | Total packets | Discarded packets |
| A | 0 | 78 | 0 |
| B | 0 | 78 | 0 |
| C | 0 | 78 | 0 |
| D | 0 | 78 | 0 |
| Mode M0 | |||
|---|---|---|---|
| Quadrant | BADHDUFLAG | Total packets | Discarded packets |
| A | 0 | 8846 | 0 |
| B | 0 | 8371 | 0 |
| C | 0 | 8284 | 0 |
| D | 0 | 8763 | 0 |
| Quadrant | Total seconds | Saturated seconds | Saturation percentage |
|---|---|---|---|
| A | 3974 | 109 | 2.742828% |
| B | 3975 | 21 | 0.528302% |
| C | 3975 | 21 | 0.528302% |
| D | 3975 | 11 | 0.276730% |
Noise dominated data is calculated using 1-second bins in cleaned event files. If a bin has >2000 counts, and if more than 50% of those come from <1% of pixels, then it is considered to be noise-dominated and hence unusable.
| Quadrant | # 1 sec bins | Bins with >0 counts | Bins with >2000 counts | High rate bins dominated by noise | Noise dominated (total time) | Noise dominated (detector-on time) | Marked lightcurve |
|---|---|---|---|---|---|---|---|
| A | 3974 | 3974 | 78 | 78 | 1.96% | 1.96% | 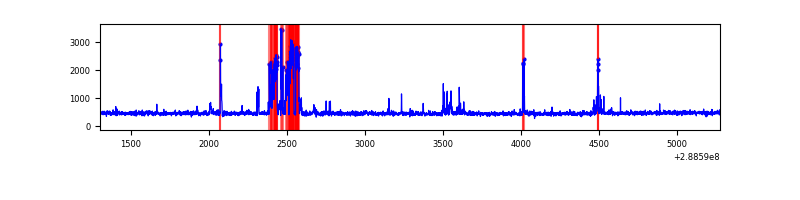 |
| B | 3975 | 3975 | 14 | 14 | 0.35% | 0.35% | 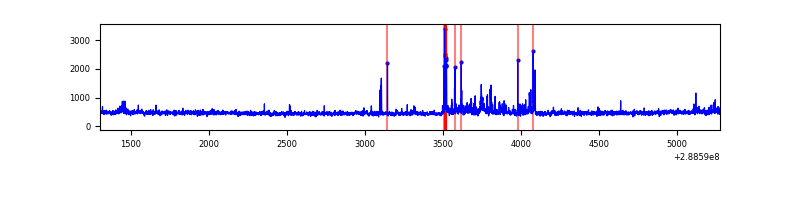 |
| C | 3975 | 3975 | 0 | 0 | 0.00% | 0.00% | 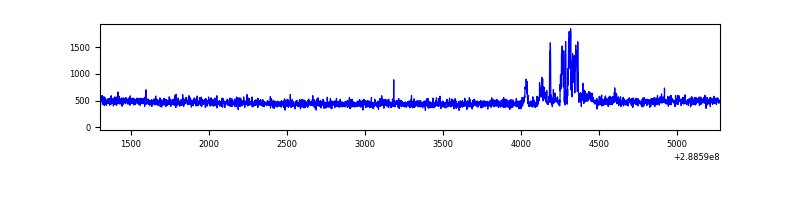 |
| D | 3975 | 3975 | 10 | 10 | 0.25% | 0.25% | 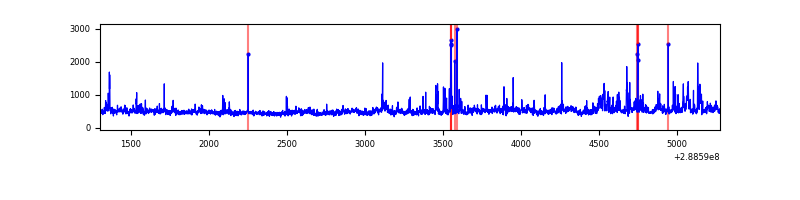 |
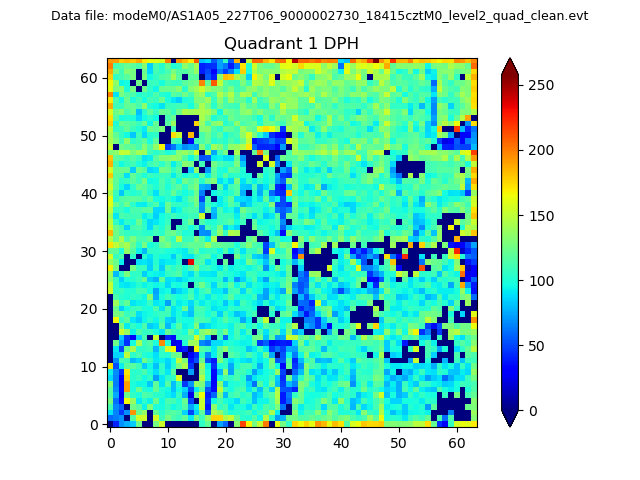
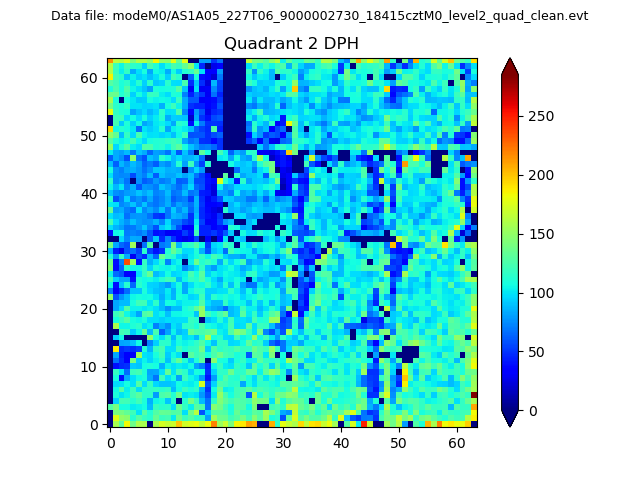
Top three noisy pixels from each quadrant. If the there are fewer than three noisy pixels in the level2.evt file, extra rows are filled as -1
| Pixel properties | Quadrant properties | ||||||
|---|---|---|---|---|---|---|---|
| Quadrant | DetID | PixID | Counts | Sigma | Mean | Median | Sigma |
| A | 15 | 174 | 273090 | 2881.0 | 463 | 453 | 94.6 |
| A | 4 | 2 | 51708 | 541.62 | 463 | 453 | 94.6 |
| A | 0 | 226 | 4177 | 39.35 | 463 | 453 | 94.6 |
| B | 7 | 220 | 94552 | 1040.99 | 466 | 455 | 90.4 |
| B | 0 | 189 | 21877 | 236.99 | 466 | 455 | 90.4 |
| B | 0 | 245 | 10909 | 115.65 | 466 | 455 | 90.4 |
| C | 3 | 233 | 125900 | 1203.82 | 443 | 446 | 104.2 |
| C | 14 | 238 | 69579 | 663.38 | 443 | 446 | 104.2 |
| C | 13 | 61 | 3170 | 26.14 | 443 | 446 | 104.2 |
| D | 8 | 230 | 168791 | 1523.59 | 451 | 438 | 110.5 |
| D | 1 | 52 | 144071 | 1299.88 | 451 | 438 | 110.5 |
| D | 13 | 232 | 30222 | 269.54 | 451 | 438 | 110.5 |
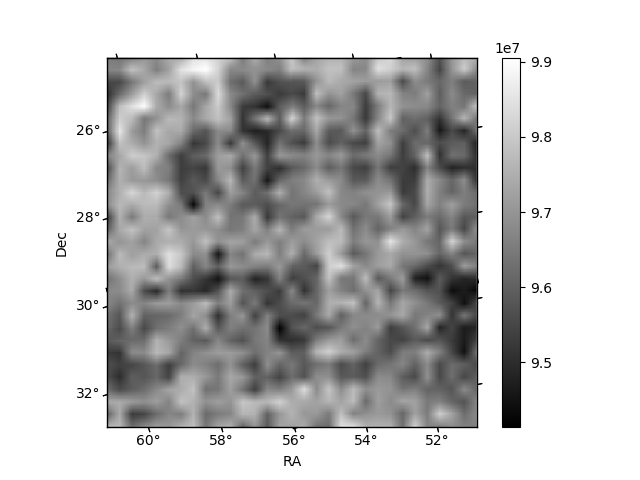
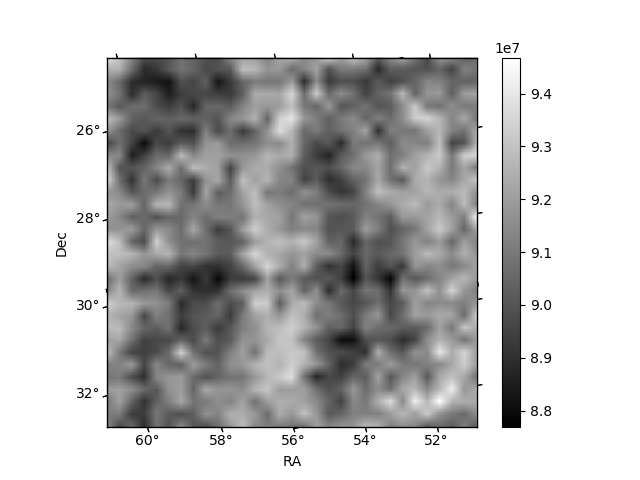
Histogram calculated using DETX and DETY for each event in the final _common_clean file
| Quadrant A | 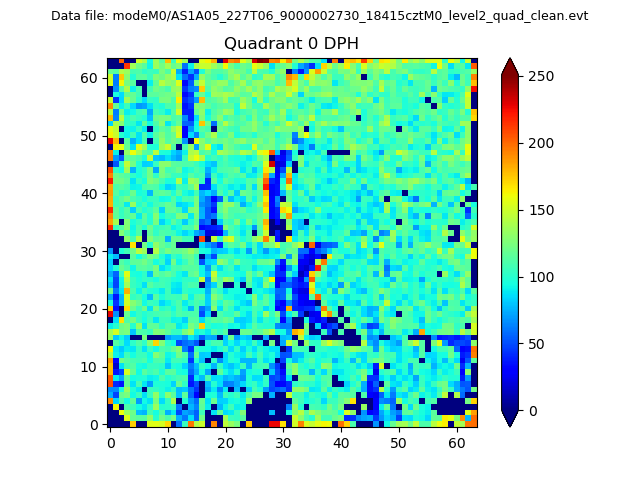 |
 |
Quadrant B |
|---|---|---|---|
| Quadrant D | 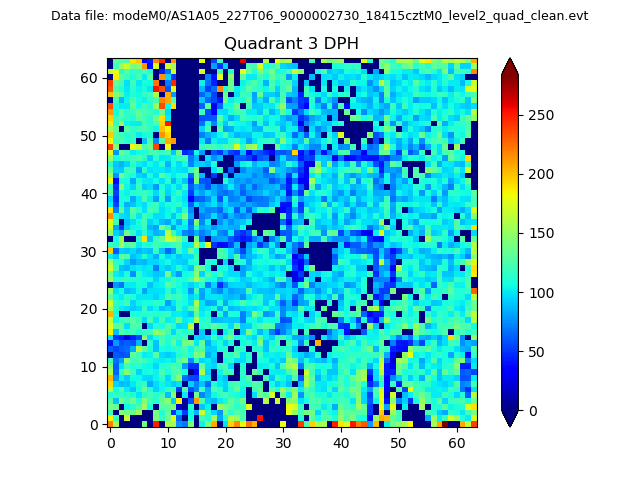 |
 |
Quadrant C |
| Plot type | Count rate plots | Images |
|---|---|---|
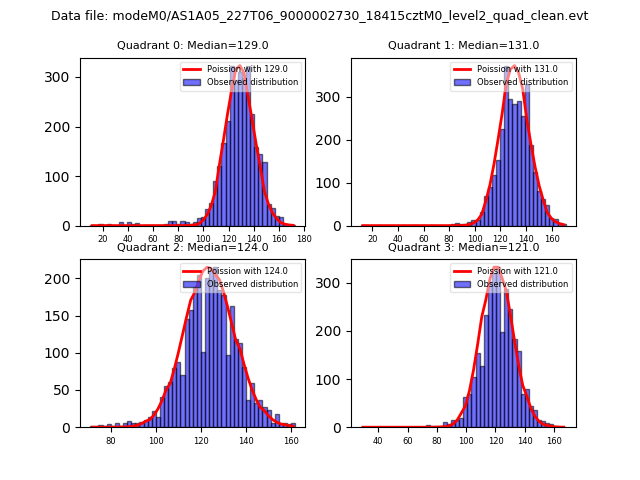
| Comparison with Poisson distribution Blue bars denote a histogram of data divided into 1 sec bins. Red curve is a Poisson curve with rate = median count rate of data. |
 |
 |
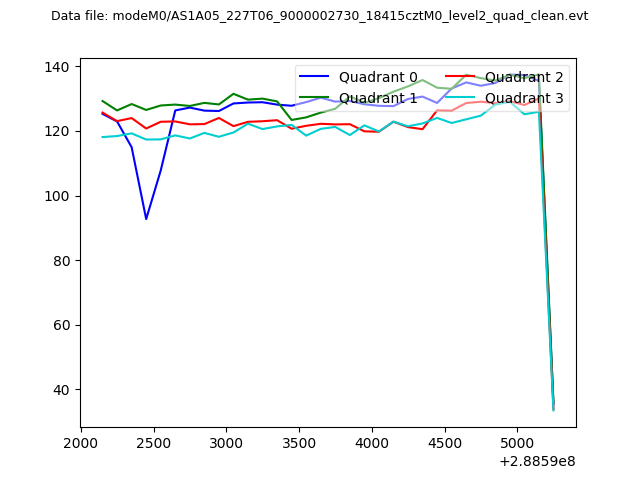
| Quadrant-wise count rates Data is divided into 100 sec bins |
 |
|
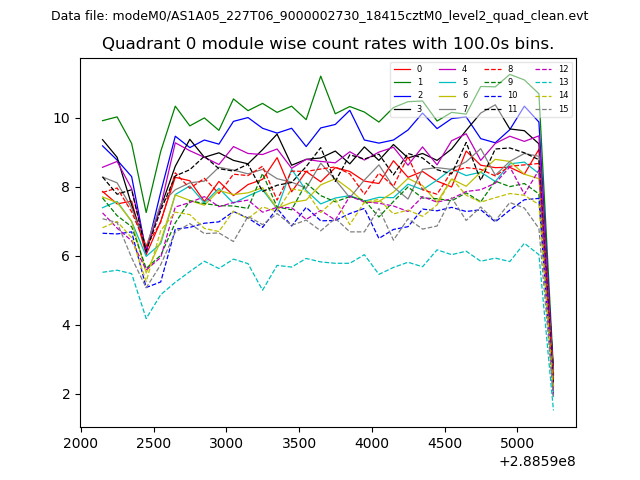
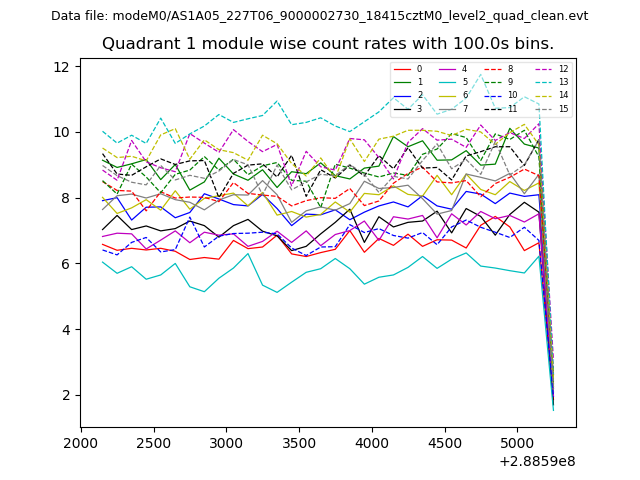
| Module-wise count rates for Quadrant A Data is divided into 100 sec bins |
 |
 |
| Module-wise count rates for Quadrant B Data is divided into 100 sec bins |
 |
 |
| Module-wise count rates for Quadrant C Data is divided into 100 sec bins |
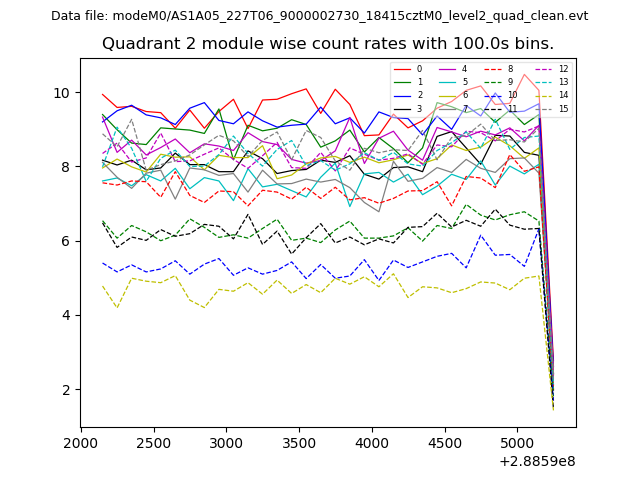 |
 |
| Module-wise count rates for Quadrant D Data is divided into 100 sec bins |
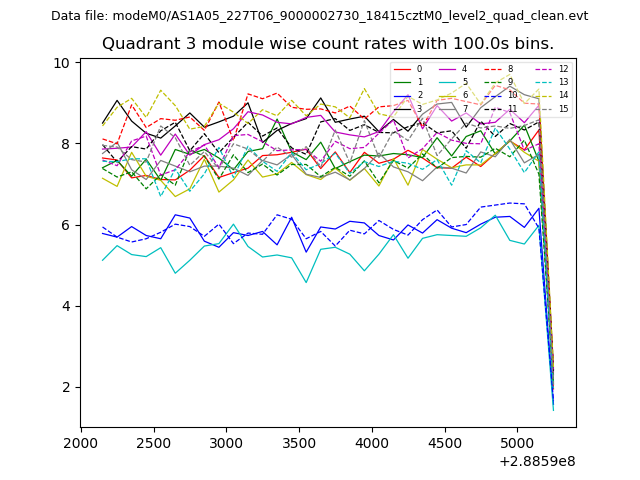 |
 |
| Parameter | Plot |
|---|---|
| CZT HV Monitor | 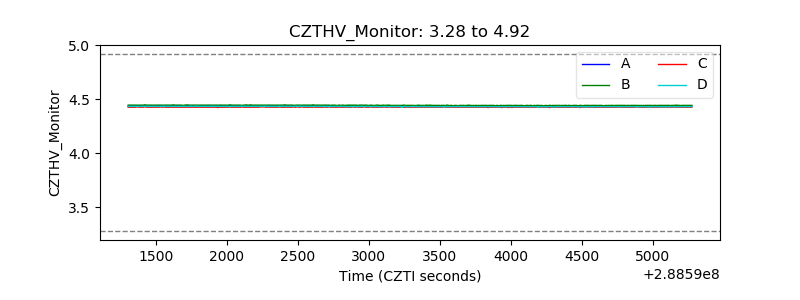 |
| D_VDD | 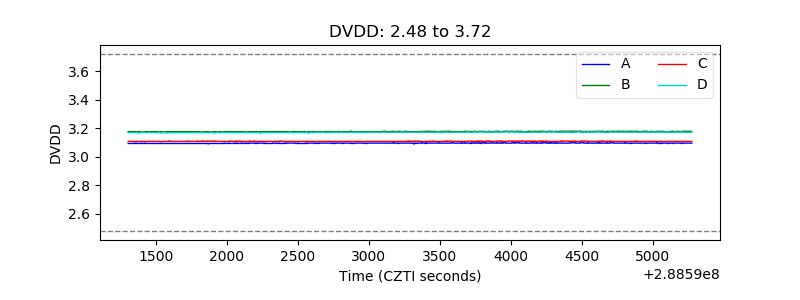 |
| Temperature 1 | 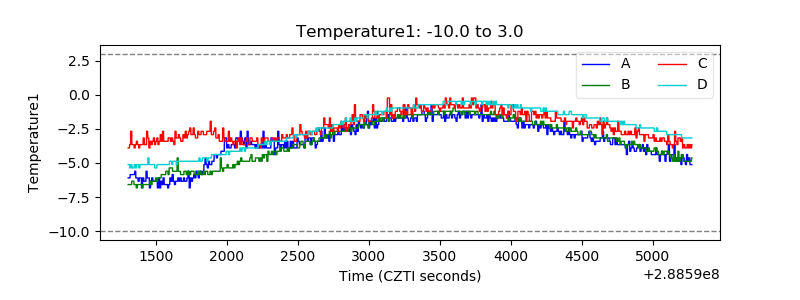 |
| Veto HV Monitor | 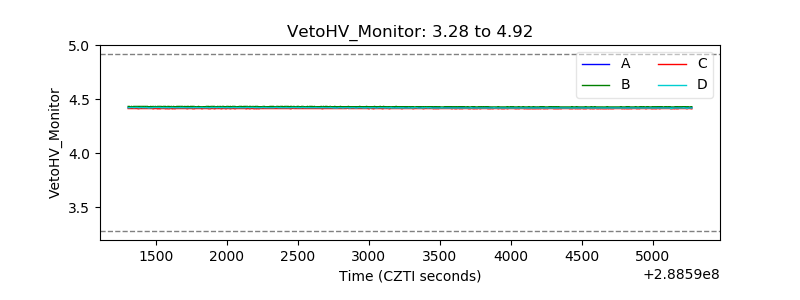 |
| Veto LLD | 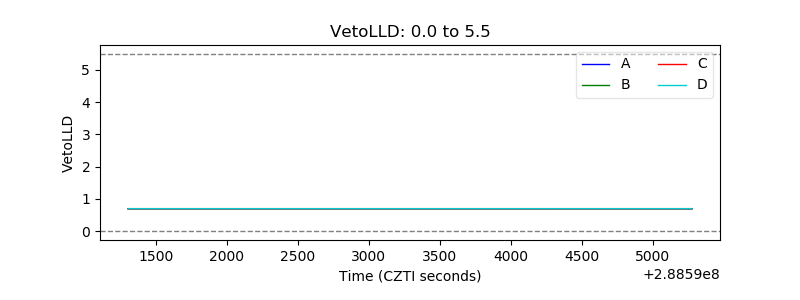 |
| Alpha Counter |  |
| _CPM_Rate |  |
| CZT Counter | 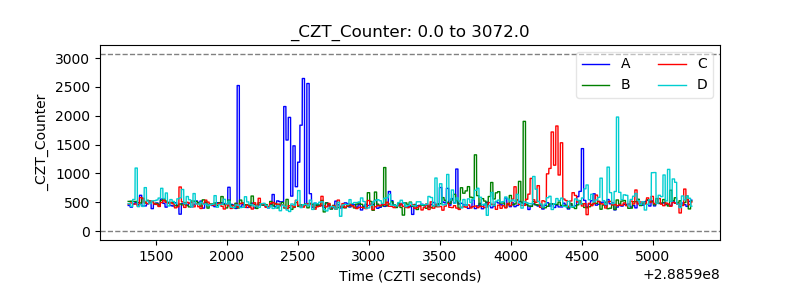 |
| +2.5 Volts monitor |  |
| +5 Volts monitor |  |
| _ROLL_ROT | 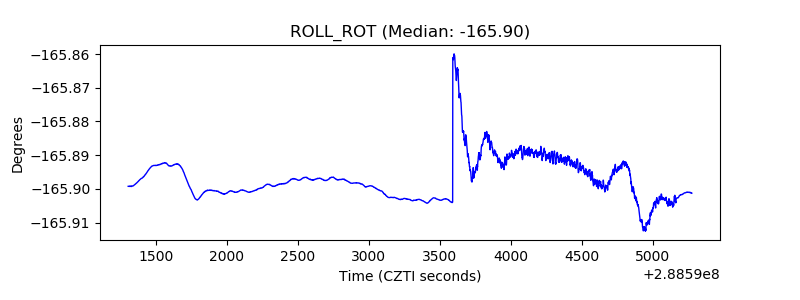 |
| _Roll_DEC | 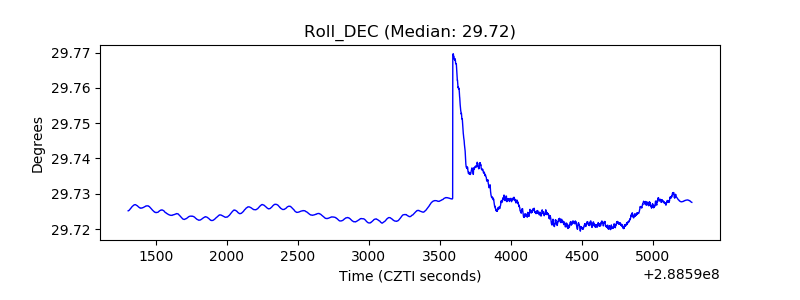 |
| _Roll_RA |  |
| Veto Counter | 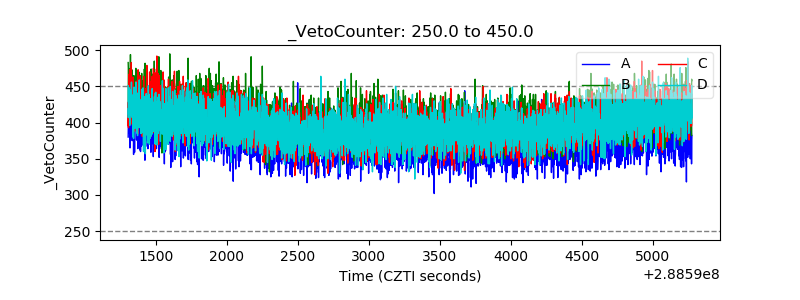 |