| Param | Original file | Final file |
|---|---|---|
| Filename | modeM0/AS1T03_083T01_9000002728cztM0_level2.fits | modeM0/AS1T03_083T01_9000002728cztM0_level2_quad_clean.evt |
| Size (bytes) | 261,656,640 | 316,160,640 |
| Size | 249.5 MB | 301.5 MB |
| Events in quadrant A | 1,606,468 | 2,045,908 |
| Events in quadrant B | 1,518,842 | 1,991,111 |
| Events in quadrant C | 1,558,048 | 1,907,180 |
| Events in quadrant D | 1,334,344 | 1,725,192 |
| Mode M0 | |||
|---|---|---|---|
| Quadrant | BADHDUFLAG | Total packets | Discarded packets |
| A | 0 | 57961 | 0 |
| B | 0 | 75674 | 0 |
| C | 0 | 57586 | 0 |
| D | 0 | 68771 | 0 |
| Mode SS | |||
|---|---|---|---|
| Quadrant | BADHDUFLAG | Total packets | Discarded packets |
| A | 0 | 562 | 0 |
| B | 0 | 562 | 0 |
| C | 0 | 562 | 0 |
| D | 0 | 562 | 0 |
| Mode M9 | |||
|---|---|---|---|
| Quadrant | BADHDUFLAG | Total packets | Discarded packets |
| A | 0 | 48 | 0 |
| B | 0 | 48 | 0 |
| C | 0 | 48 | 0 |
| D | 0 | 48 | 0 |
| Quadrant | Total seconds | Saturated seconds | Saturation percentage |
|---|---|---|---|
| A | 27731 | 305 | 1.099852% |
| B | 27731 | 935 | 3.371678% |
| C | 27731 | 321 | 1.157549% |
| D | 27731 | 842 | 3.036313% |
Noise dominated data is calculated using 1-second bins in cleaned event files. If a bin has >2000 counts, and if more than 50% of those come from <1% of pixels, then it is considered to be noise-dominated and hence unusable.
| Quadrant | # 1 sec bins | Bins with >0 counts | Bins with >2000 counts | High rate bins dominated by noise | Noise dominated (total time) | Noise dominated (detector-on time) | Marked lightcurve |
|---|---|---|---|---|---|---|---|
| A | 32380 | 27730 | 0 | 0 | 0.00% | 0.00% | 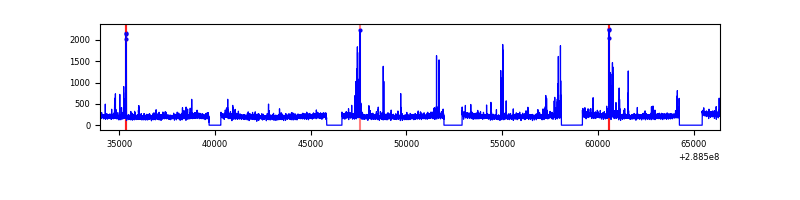 |
| B | 32380 | 27730 | 0 | 0 | 0.00% | 0.00% |  |
| C | 32379 | 27730 | 0 | 0 | 0.00% | 0.00% |  |
| D | 32380 | 27679 | 0 | 0 | 0.00% | 0.00% |  |
Top three noisy pixels from each quadrant. If the there are fewer than three noisy pixels in the level2.evt file, extra rows are filled as -1
| Pixel properties | Quadrant properties | ||||||
|---|---|---|---|---|---|---|---|
| Quadrant | DetID | PixID | Counts | Sigma | Mean | Median | Sigma |
| A | 0 | 29 | 1588 | 11.25 | 418 | 392 | 106.3 |
| A | 0 | 30 | 1306 | 8.6 | 418 | 392 | 106.3 |
| A | 7 | 110 | 1305 | 8.59 | 418 | 392 | 106.3 |
| B | 2 | 9 | 1231 | 10.68 | 401 | 383 | 79.4 |
| B | 14 | 254 | 1065 | 8.59 | 401 | 383 | 79.4 |
| B | 2 | 8 | 1011 | 7.91 | 401 | 383 | 79.4 |
| C | 12 | 250 | 1053 | 6.22 | 411 | 384 | 107.5 |
| C | 2 | 191 | 1043 | 6.13 | 411 | 384 | 107.5 |
| C | 12 | 249 | 1042 | 6.12 | 411 | 384 | 107.5 |
| D | 3 | 14 | 975 | 6.16 | 380 | 348 | 101.9 |
| D | 10 | 190 | 956 | 5.97 | 380 | 348 | 101.9 |
| D | 7 | 3 | 948 | 5.89 | 380 | 348 | 101.9 |
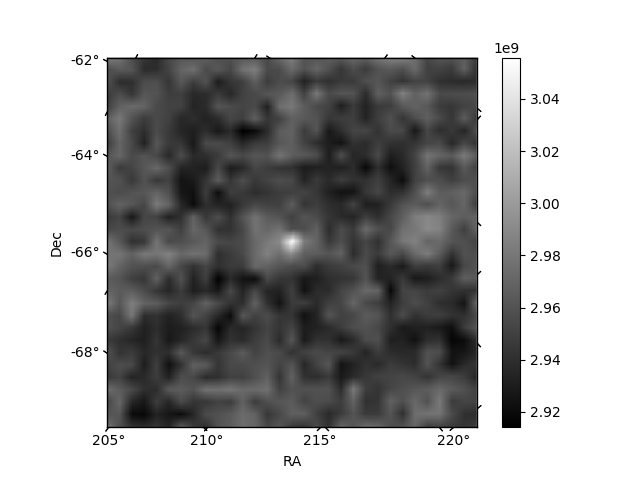
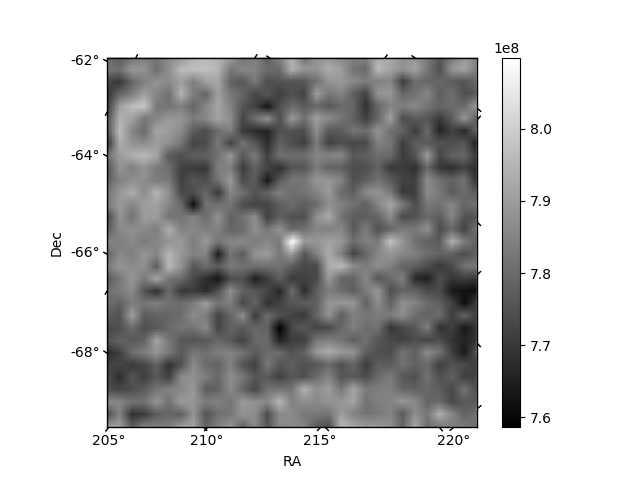
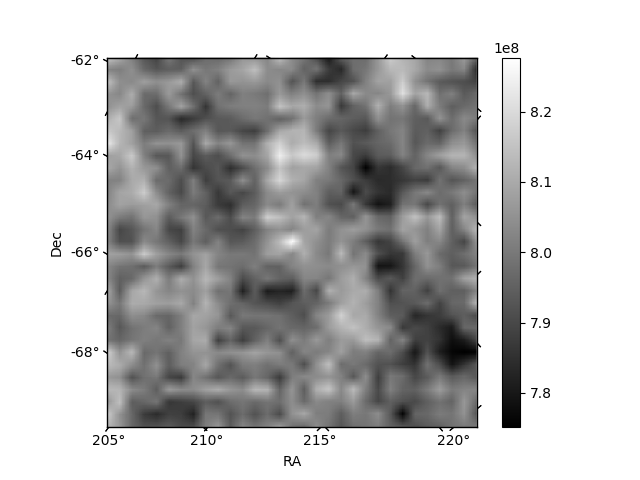
Histogram calculated using DETX and DETY for each event in the final _common_clean file
| Quadrant A | 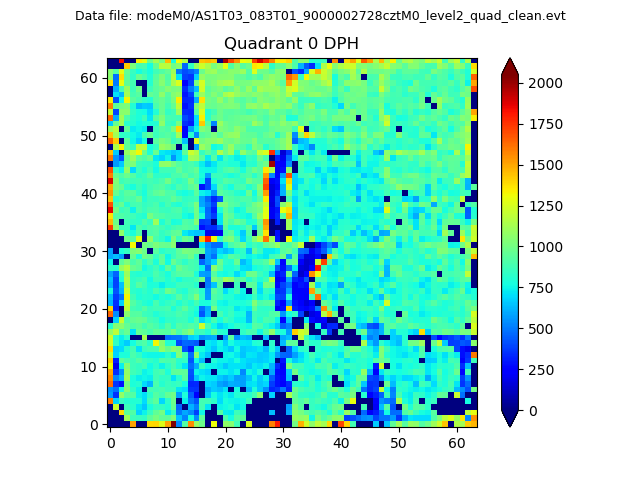 |
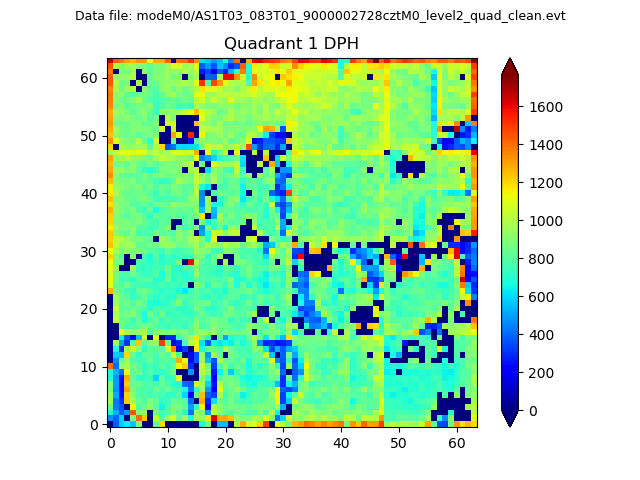 |
Quadrant B |
|---|---|---|---|
| Quadrant D | 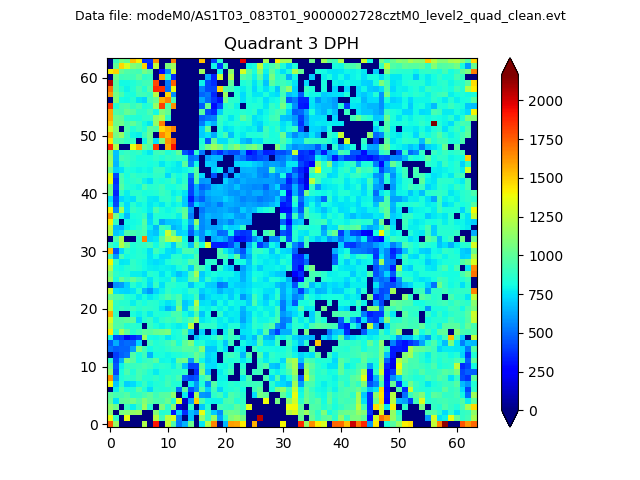 |
 |
Quadrant C |
| Plot type | Count rate plots | Images |
|---|---|---|
| Comparison with Poisson distribution Blue bars denote a histogram of data divided into 1 sec bins. Red curve is a Poisson curve with rate = median count rate of data. |
 |
 |
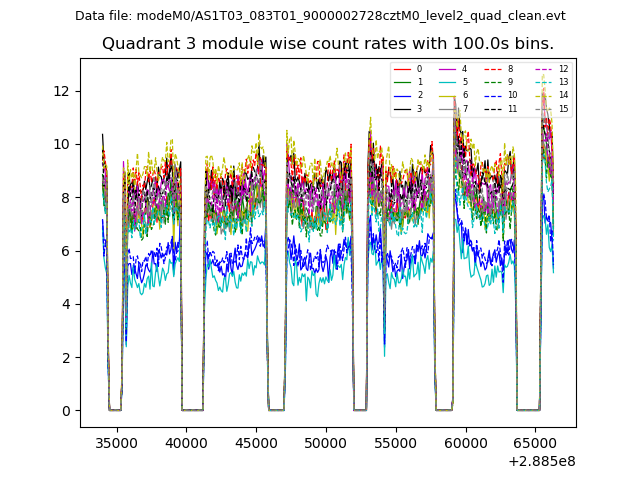
| Quadrant-wise count rates Data is divided into 100 sec bins |
 |
|
| Module-wise count rates for Quadrant A Data is divided into 100 sec bins |
 |
 |
| Module-wise count rates for Quadrant B Data is divided into 100 sec bins |
 |
 |
| Module-wise count rates for Quadrant C Data is divided into 100 sec bins |
 |
 |
| Module-wise count rates for Quadrant D Data is divided into 100 sec bins |
 |
 |
| Parameter | Plot |
|---|---|
| CZT HV Monitor |  |
| D_VDD | 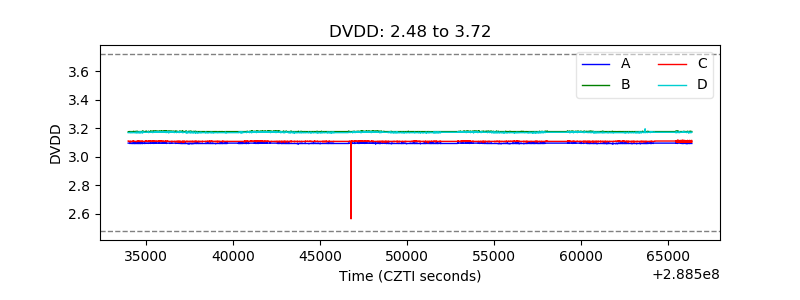 |
| Temperature 1 |  |
| Veto HV Monitor |  |
| Veto LLD | 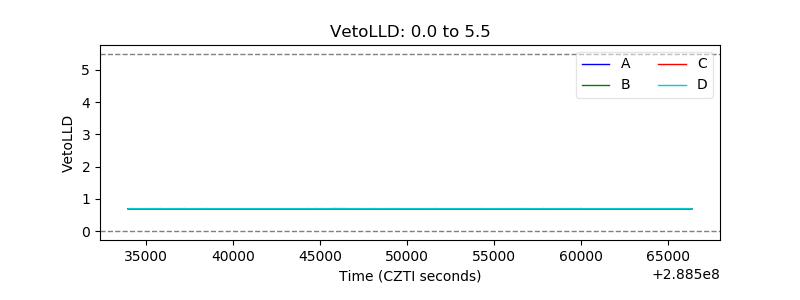 |
| Alpha Counter | 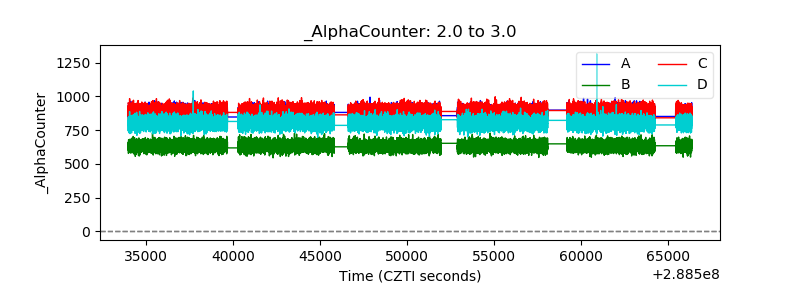 |
| _CPM_Rate | 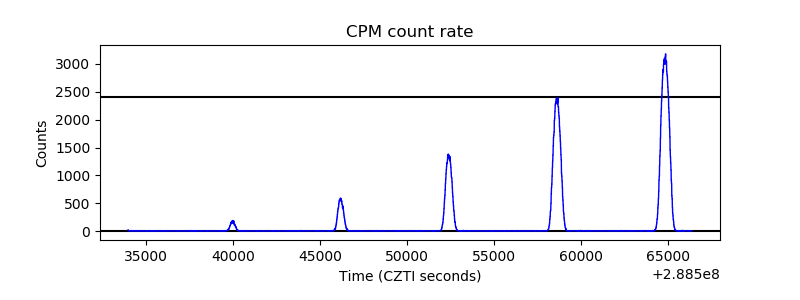 |
| CZT Counter |  |
| +2.5 Volts monitor |  |
| +5 Volts monitor |  |
| _ROLL_ROT |  |
| _Roll_DEC |  |
| _Roll_RA | 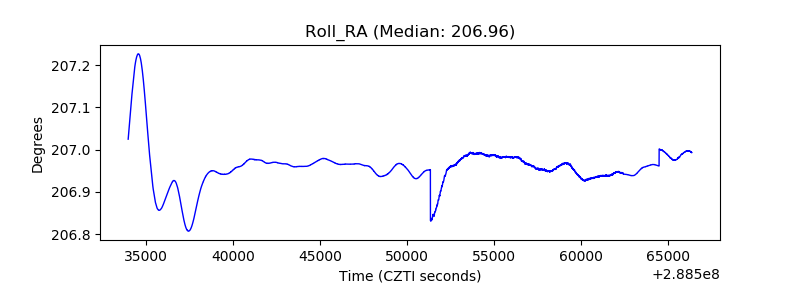 |
| Veto Counter | 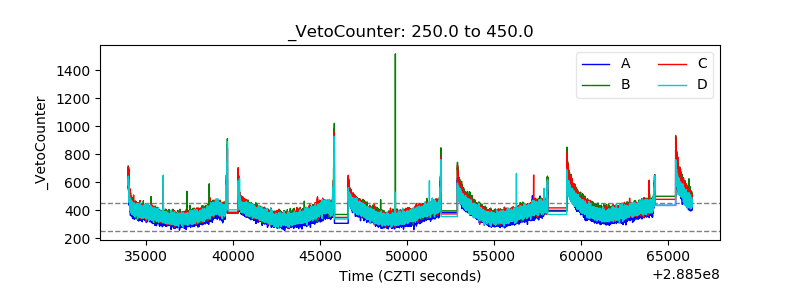 |