| Param | Original file | Final file |
|---|---|---|
| Filename | modeM0/AS1T03_083T01_9000002728_18405cztM0_level2.evt | modeM0/AS1T03_083T01_9000002728_18405cztM0_level2_quad_clean.evt |
| Size (bytes) | 583,626,240 | 105,589,440 |
| Size | 556.6 MB | 100.7 MB |
| Events in quadrant A | 3,542,595 | 691,628 |
| Events in quadrant B | 4,960,383 | 677,649 |
| Events in quadrant C | 3,654,371 | 670,396 |
| Events in quadrant D | 5,014,160 | 641,056 |
| Mode M0 | |||
|---|---|---|---|
| Quadrant | BADHDUFLAG | Total packets | Discarded packets |
| A | 0 | 15425 | 2 |
| B | 0 | 19676 | 2 |
| C | 0 | 15445 | 2 |
| D | 0 | 19705 | 2 |
| Mode SS | |||
|---|---|---|---|
| Quadrant | BADHDUFLAG | Total packets | Discarded packets |
| A | 0 | 150 | 0 |
| B | 0 | 150 | 0 |
| C | 0 | 150 | 0 |
| D | 0 | 150 | 0 |
| Mode M9 | |||
|---|---|---|---|
| Quadrant | BADHDUFLAG | Total packets | Discarded packets |
| A | 0 | 7 | 0 |
| B | 0 | 7 | 0 |
| C | 0 | 7 | 0 |
| D | 0 | 7 | 0 |
| Quadrant | Total seconds | Saturated seconds | Saturation percentage |
|---|---|---|---|
| A | 7430 | 106 | 1.426649% |
| B | 7430 | 353 | 4.751009% |
| C | 7430 | 113 | 1.520861% |
| D | 7430 | 360 | 4.845222% |
Noise dominated data is calculated using 1-second bins in cleaned event files. If a bin has >2000 counts, and if more than 50% of those come from <1% of pixels, then it is considered to be noise-dominated and hence unusable.
| Quadrant | # 1 sec bins | Bins with >0 counts | Bins with >2000 counts | High rate bins dominated by noise | Noise dominated (total time) | Noise dominated (detector-on time) | Marked lightcurve |
|---|---|---|---|---|---|---|---|
| A | 8045 | 7431 | 14 | 14 | 0.17% | 0.19% | 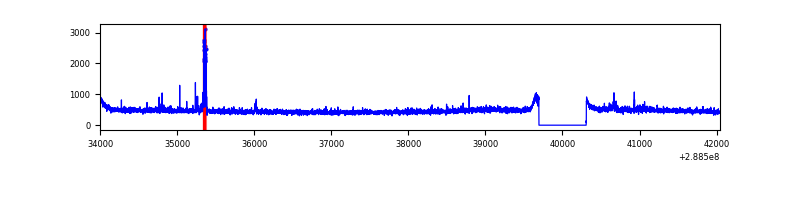 |
| B | 8045 | 7431 | 174 | 174 | 2.16% | 2.34% | 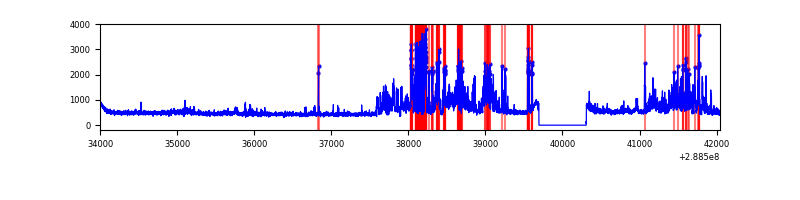 |
| C | 8045 | 7431 | 0 | 0 | 0.00% | 0.00% | 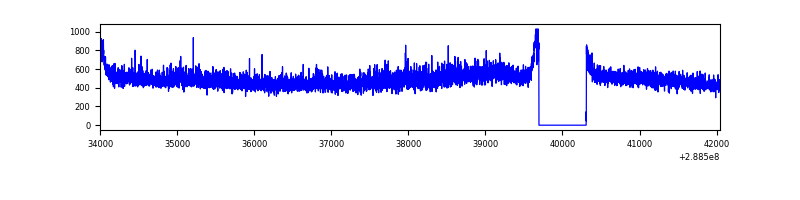 |
| D | 8045 | 7431 | 262 | 262 | 3.26% | 3.53% | 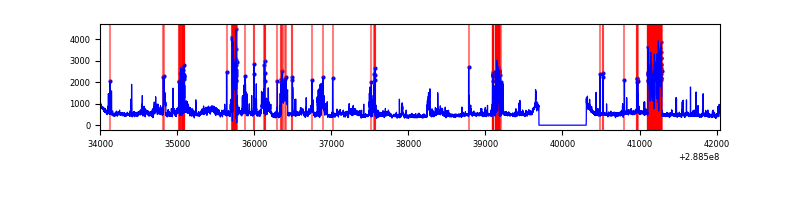 |
Top three noisy pixels from each quadrant. If the there are fewer than three noisy pixels in the level2.evt file, extra rows are filled as -1
| Pixel properties | Quadrant properties | ||||||
|---|---|---|---|---|---|---|---|
| Quadrant | DetID | PixID | Counts | Sigma | Mean | Median | Sigma |
| A | 15 | 174 | 87662 | 474.07 | 897 | 878 | 183.1 |
| A | 0 | 226 | 7887 | 38.28 | 897 | 878 | 183.1 |
| A | 3 | 137 | 6707 | 31.84 | 897 | 878 | 183.1 |
| B | 10 | 245 | 1320133 | 7878.28 | 880 | 858 | 167.5 |
| B | 7 | 220 | 103086 | 610.47 | 880 | 858 | 167.5 |
| B | 0 | 189 | 31133 | 180.79 | 880 | 858 | 167.5 |
| C | 3 | 233 | 144840 | 714.57 | 860 | 865 | 201.5 |
| C | 14 | 238 | 134465 | 663.08 | 860 | 865 | 201.5 |
| C | 0 | 207 | 22346 | 106.61 | 860 | 865 | 201.5 |
| D | 7 | 238 | 735902 | 3536.93 | 851 | 826 | 207.8 |
| D | 1 | 52 | 670508 | 3222.28 | 851 | 826 | 207.8 |
| D | 12 | 110 | 245794 | 1178.7 | 851 | 826 | 207.8 |
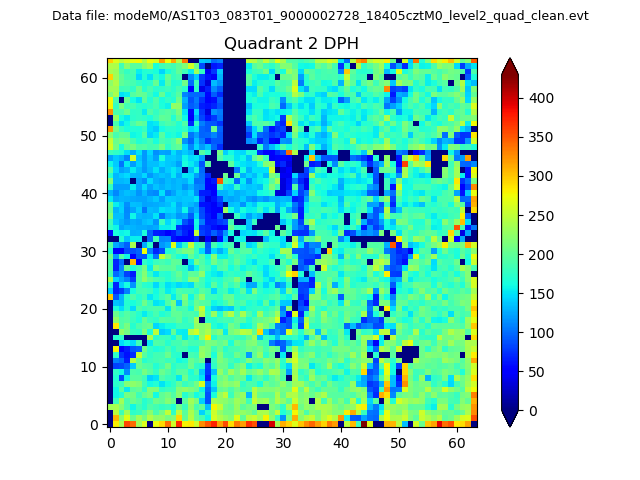
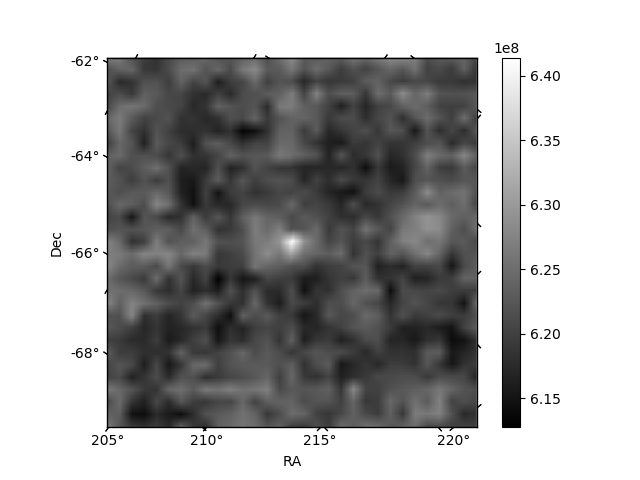
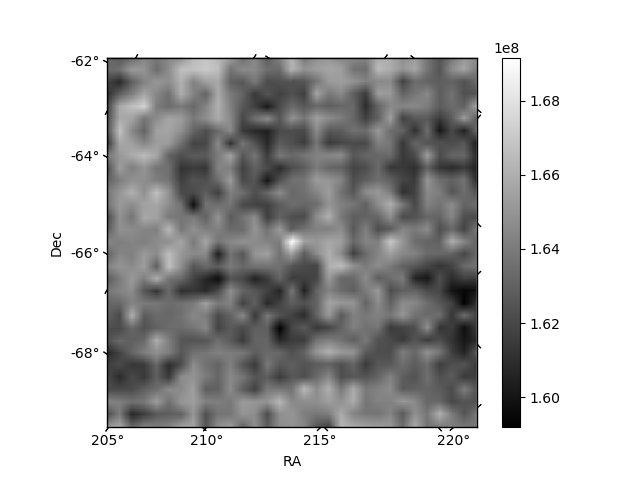
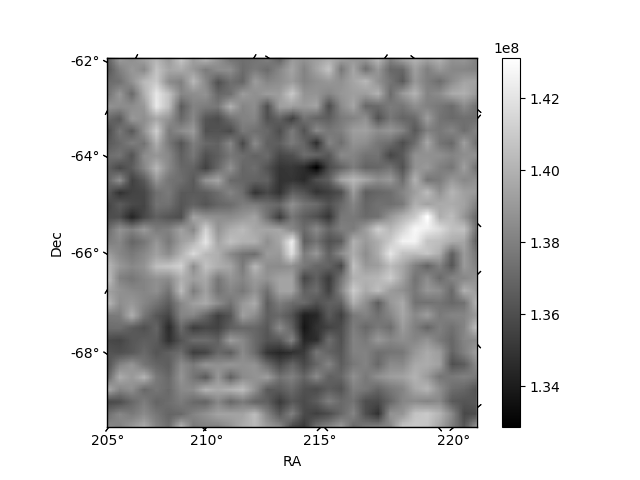
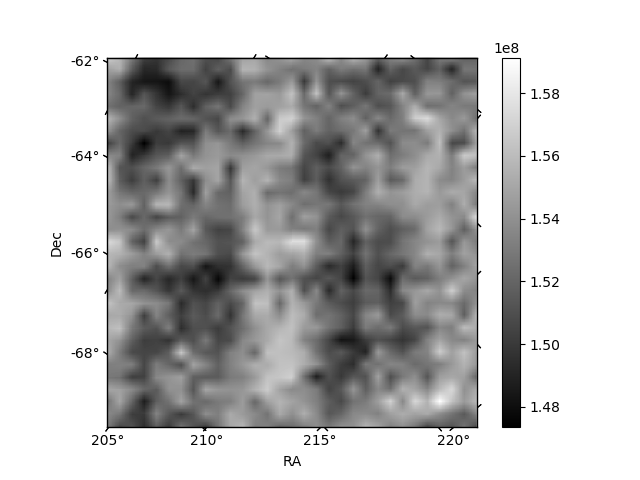
Histogram calculated using DETX and DETY for each event in the final _common_clean file
| Quadrant A | 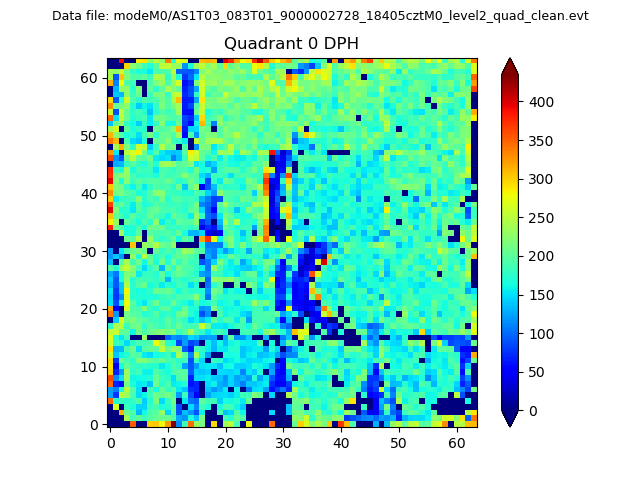 |
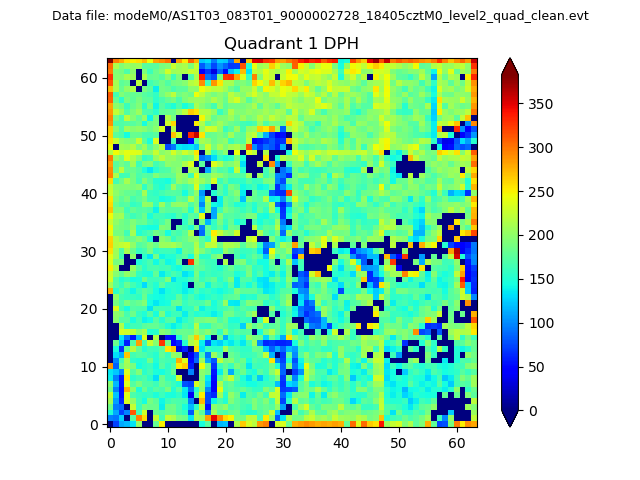 |
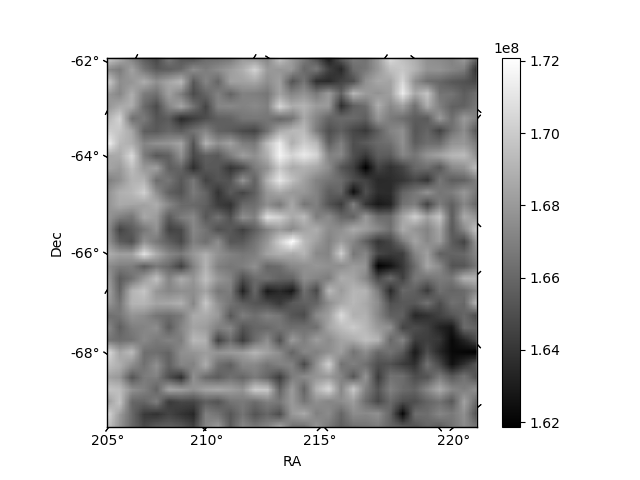
Quadrant B |
|---|---|---|---|
| Quadrant D | 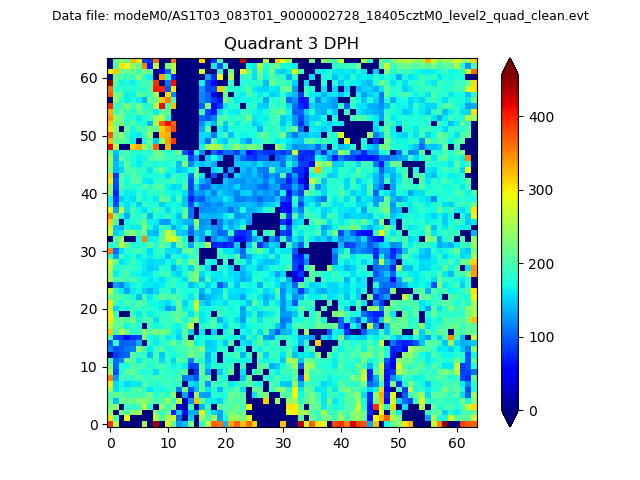 |
 |
Quadrant C |
| Plot type | Count rate plots | Images |
|---|---|---|
| Comparison with Poisson distribution Blue bars denote a histogram of data divided into 1 sec bins. Red curve is a Poisson curve with rate = median count rate of data. |
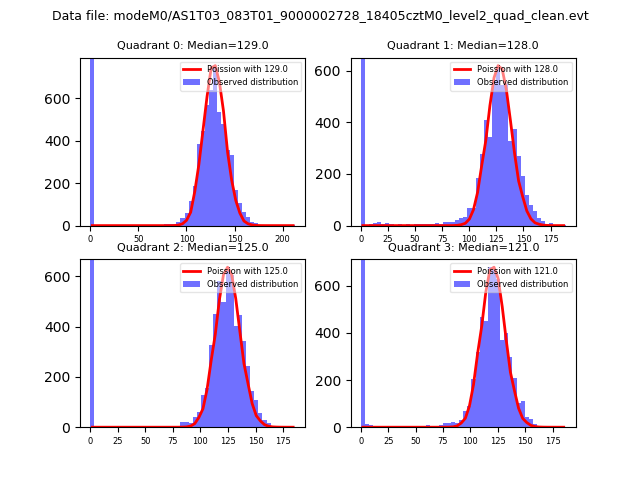 |
 |
| Quadrant-wise count rates Data is divided into 100 sec bins |
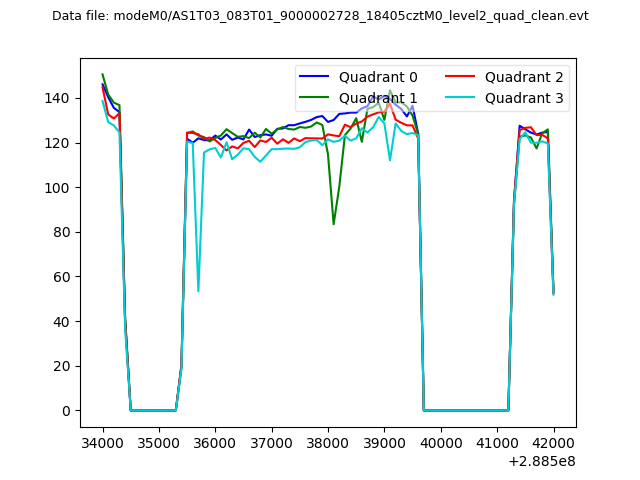 |
|
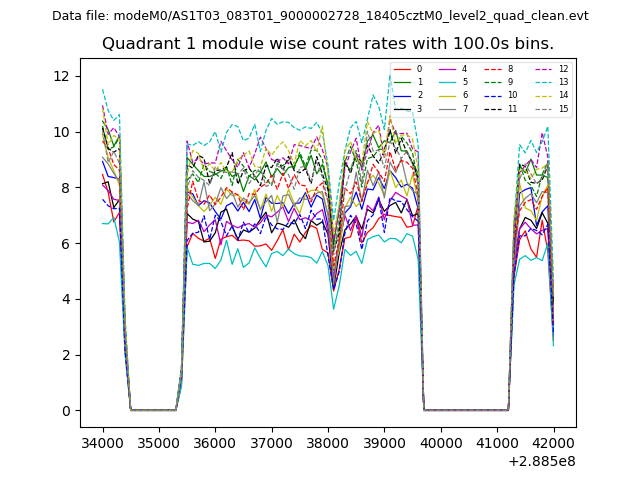
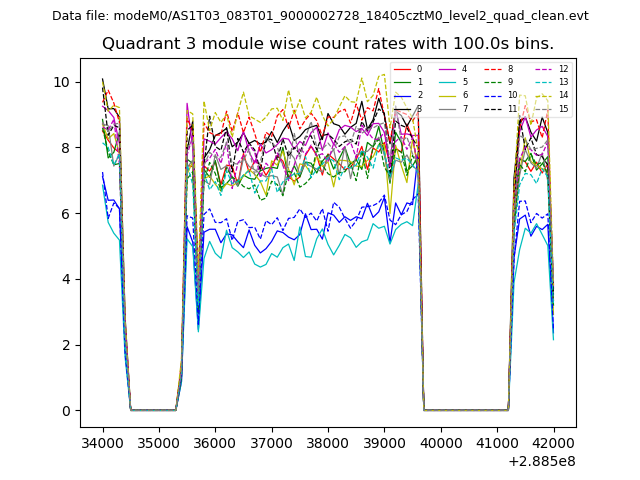
| Module-wise count rates for Quadrant A Data is divided into 100 sec bins |
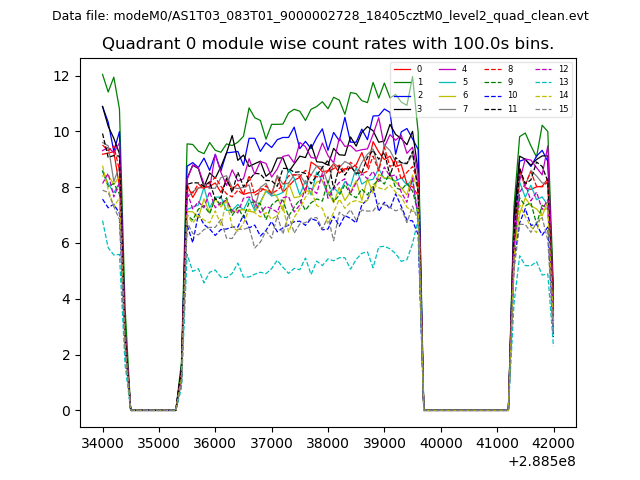 |
 |
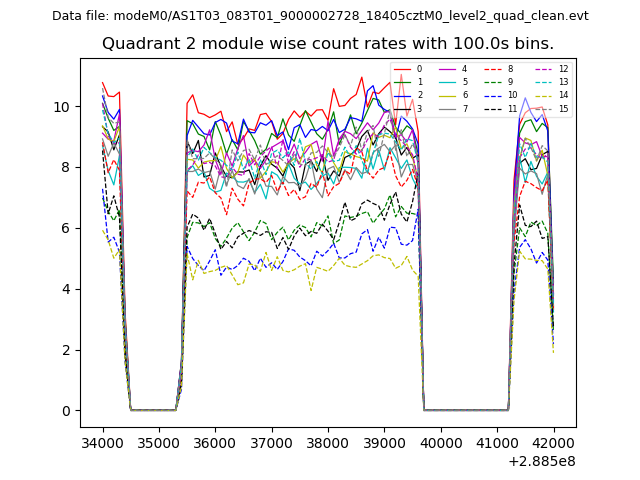
| Module-wise count rates for Quadrant B Data is divided into 100 sec bins |
 |
 |
| Module-wise count rates for Quadrant C Data is divided into 100 sec bins |
 |
 |
| Module-wise count rates for Quadrant D Data is divided into 100 sec bins |
 |
 |
| Parameter | Plot |
|---|---|
| CZT HV Monitor | 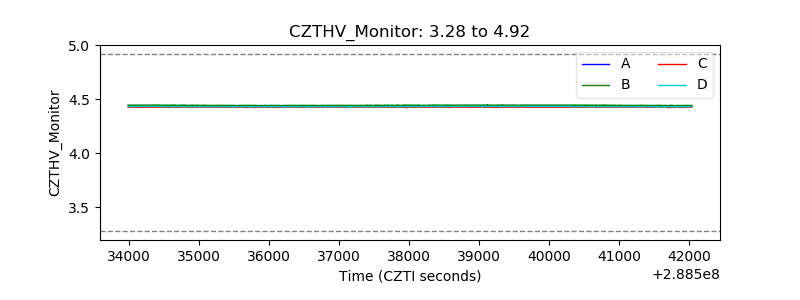 |
| D_VDD | 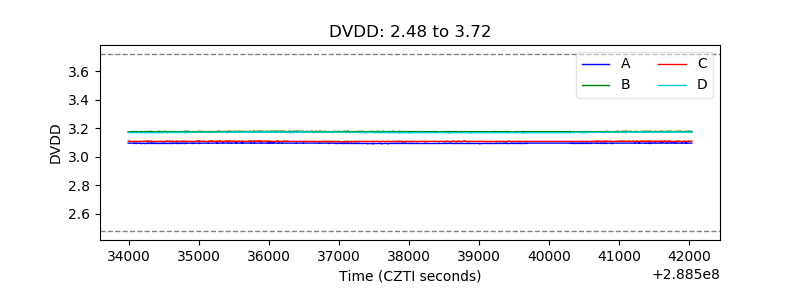 |
| Temperature 1 | 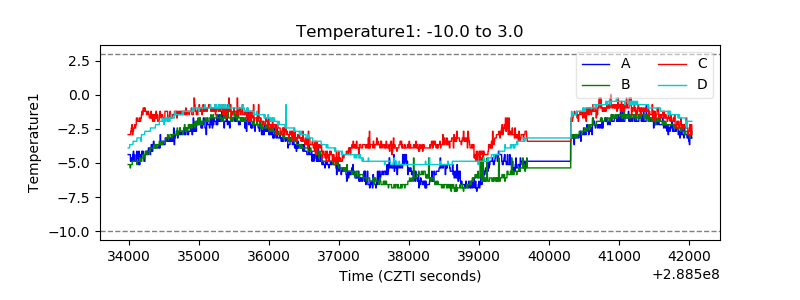 |
| Veto HV Monitor | 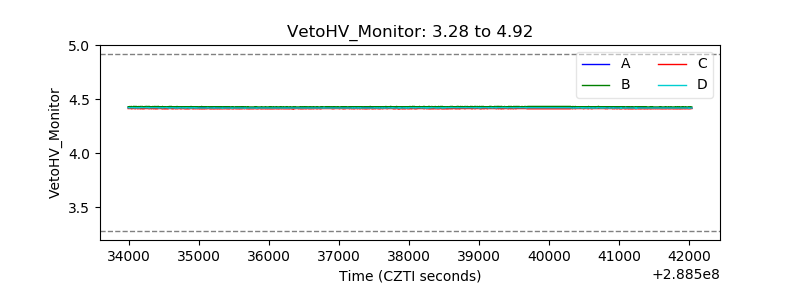 |
| Veto LLD | 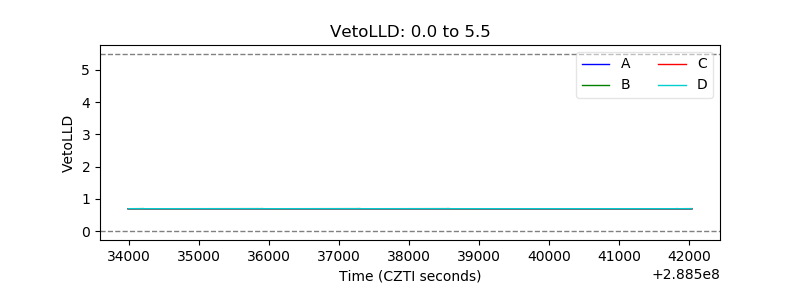 |
| Alpha Counter | 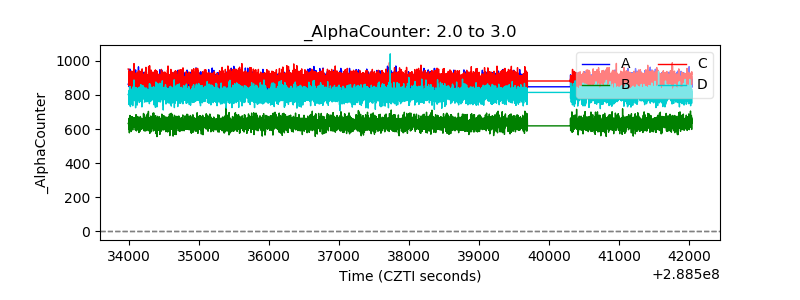 |
| _CPM_Rate | 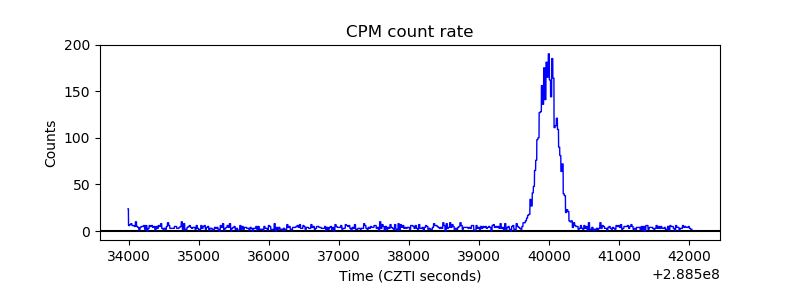 |
| CZT Counter | 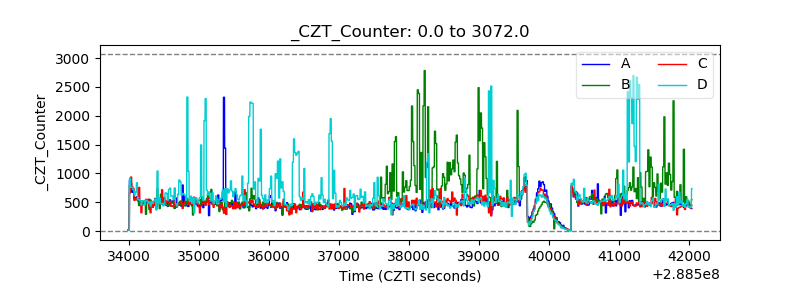 |
| +2.5 Volts monitor |  |
| +5 Volts monitor | 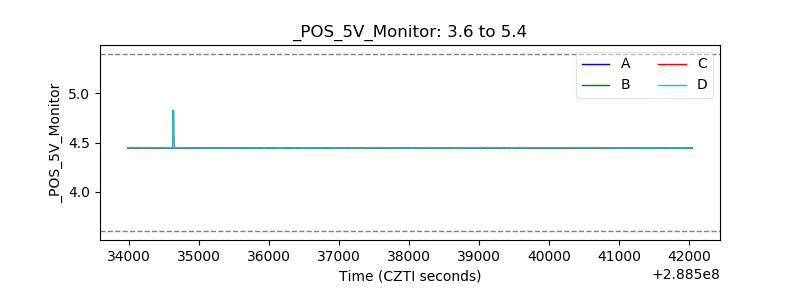 |
| _ROLL_ROT | 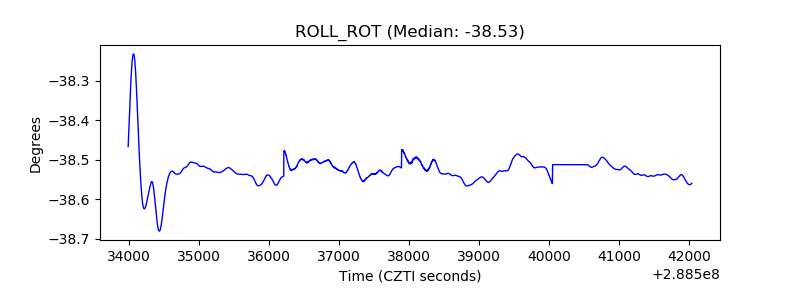 |
| _Roll_DEC | 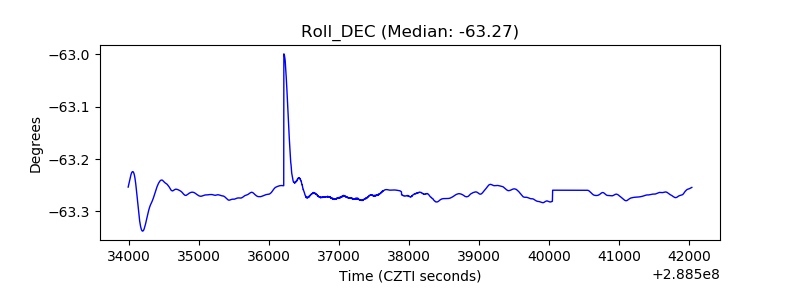 |
| _Roll_RA | 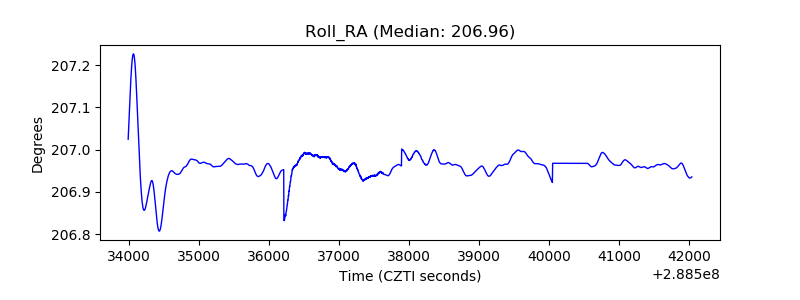 |
| Veto Counter | 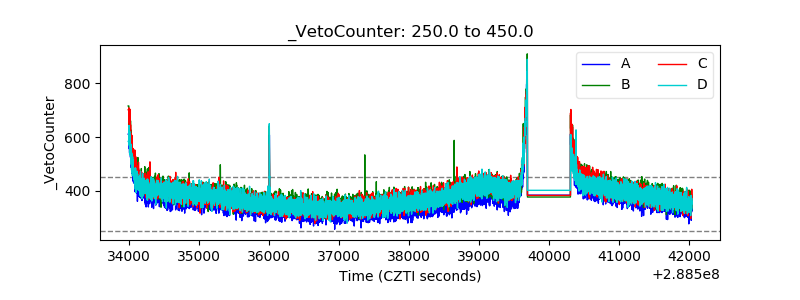 |