| Param | Original file | Final file |
|---|---|---|
| Filename | modeM0/AS1T03_083T01_9000002728_18406cztM0_level2.evt | modeM0/AS1T03_083T01_9000002728_18406cztM0_level2_quad_clean.evt |
| Size (bytes) | 829,537,920 | 204,557,760 |
| Size | 791.1 MB | 195.1 MB |
| Events in quadrant A | 5,231,158 | 1,399,889 |
| Events in quadrant B | 6,982,271 | 1,393,249 |
| Events in quadrant C | 5,361,646 | 1,339,829 |
| Events in quadrant D | 6,787,821 | 1,286,118 |
| Mode M0 | |||
|---|---|---|---|
| Quadrant | BADHDUFLAG | Total packets | Discarded packets |
| A | 0 | 23096 | 2 |
| B | 0 | 27971 | 2 |
| C | 0 | 23345 | 2 |
| D | 0 | 27881 | 3 |
| Mode SS | |||
|---|---|---|---|
| Quadrant | BADHDUFLAG | Total packets | Discarded packets |
| A | 0 | 228 | 0 |
| B | 0 | 228 | 0 |
| C | 0 | 228 | 0 |
| D | 0 | 228 | 0 |
| Mode M9 | |||
|---|---|---|---|
| Quadrant | BADHDUFLAG | Total packets | Discarded packets |
| A | 0 | 18 | 0 |
| B | 0 | 18 | 0 |
| C | 0 | 18 | 0 |
| D | 0 | 18 | 0 |
| Quadrant | Total seconds | Saturated seconds | Saturation percentage |
|---|---|---|---|
| A | 11225 | 108 | 0.962138% |
| B | 11225 | 322 | 2.868597% |
| C | 11225 | 148 | 1.318486% |
| D | 11225 | 385 | 3.429844% |
Noise dominated data is calculated using 1-second bins in cleaned event files. If a bin has >2000 counts, and if more than 50% of those come from <1% of pixels, then it is considered to be noise-dominated and hence unusable.
| Quadrant | # 1 sec bins | Bins with >0 counts | Bins with >2000 counts | High rate bins dominated by noise | Noise dominated (total time) | Noise dominated (detector-on time) | Marked lightcurve |
|---|---|---|---|---|---|---|---|
| A | 12965 | 11227 | 6 | 6 | 0.05% | 0.05% | 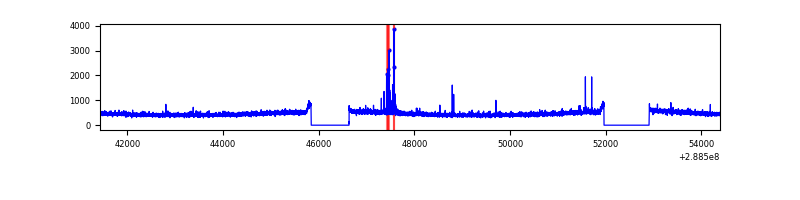 |
| B | 12965 | 11227 | 110 | 110 | 0.85% | 0.98% | 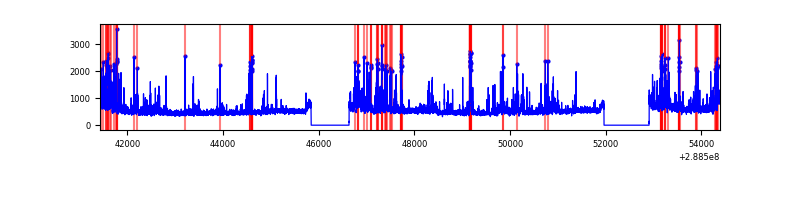 |
| C | 12965 | 11227 | 10 | 10 | 0.08% | 0.09% | 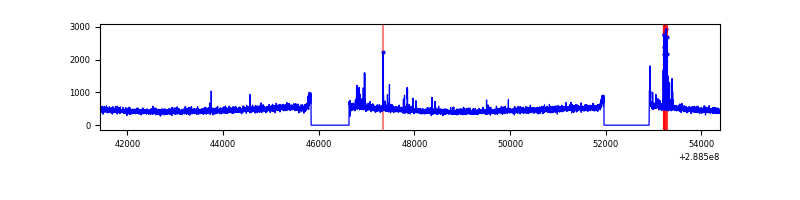 |
| D | 12965 | 11227 | 221 | 221 | 1.70% | 1.97% | 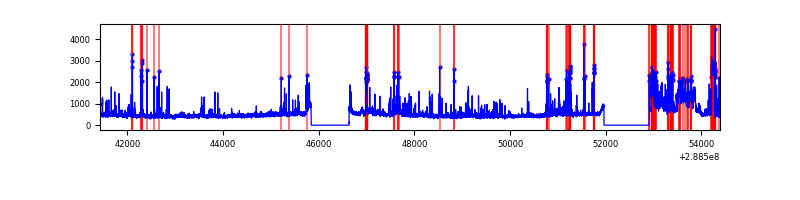 |
Top three noisy pixels from each quadrant. If the there are fewer than three noisy pixels in the level2.evt file, extra rows are filled as -1
| Pixel properties | Quadrant properties | ||||||
|---|---|---|---|---|---|---|---|
| Quadrant | DetID | PixID | Counts | Sigma | Mean | Median | Sigma |
| A | 4 | 2 | 58933 | 212.88 | 1343 | 1317 | 270.7 |
| A | 0 | 226 | 11518 | 37.69 | 1343 | 1317 | 270.7 |
| A | 3 | 137 | 9926 | 31.81 | 1343 | 1317 | 270.7 |
| B | 10 | 245 | 1414717 | 5551.94 | 1337 | 1306 | 254.6 |
| B | 7 | 220 | 127546 | 495.88 | 1337 | 1306 | 254.6 |
| B | 0 | 189 | 50949 | 195.0 | 1337 | 1306 | 254.6 |
| C | 14 | 238 | 199078 | 661.54 | 1280 | 1289 | 299.0 |
| C | 0 | 207 | 105867 | 349.78 | 1280 | 1289 | 299.0 |
| C | 3 | 233 | 65210 | 213.8 | 1280 | 1289 | 299.0 |
| D | 7 | 238 | 696891 | 2245.73 | 1277 | 1240 | 309.8 |
| D | 1 | 52 | 475589 | 1531.32 | 1277 | 1240 | 309.8 |
| D | 8 | 230 | 306941 | 986.88 | 1277 | 1240 | 309.8 |
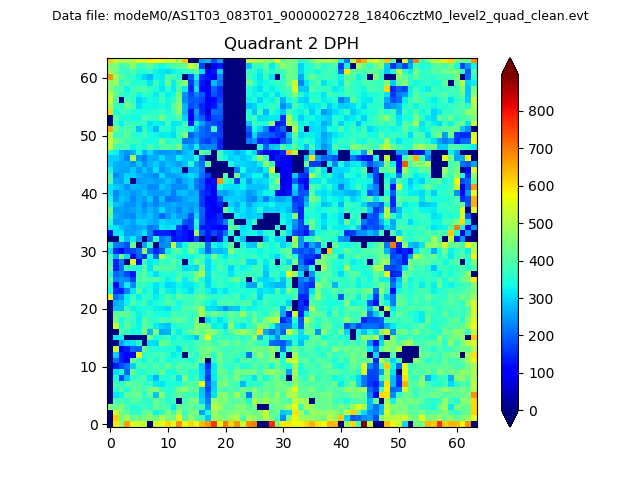
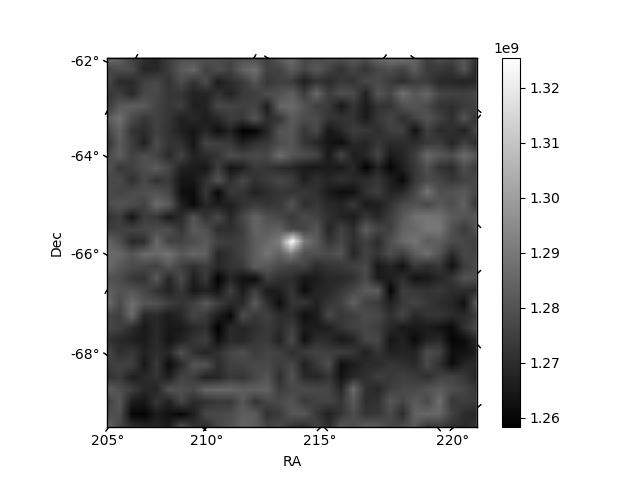
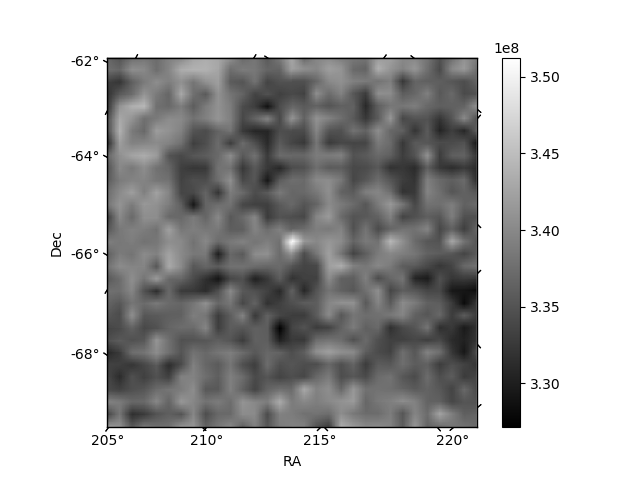
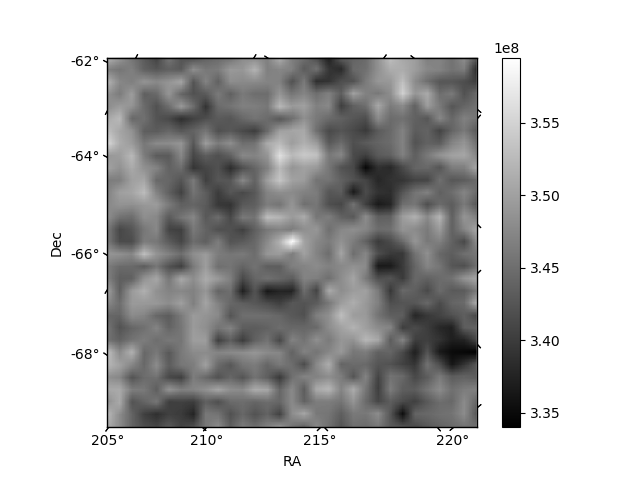
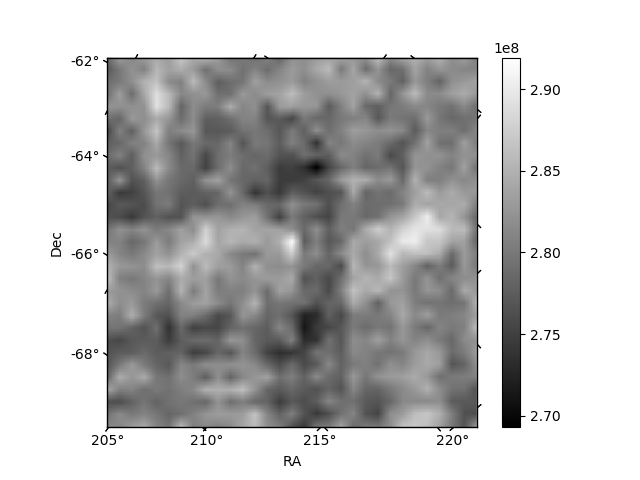
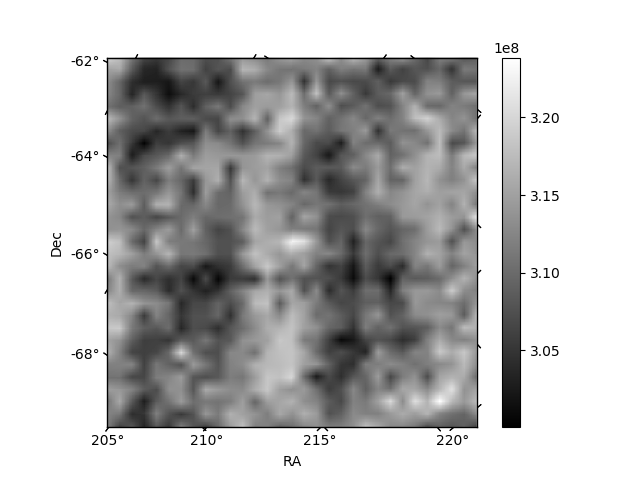
Histogram calculated using DETX and DETY for each event in the final _common_clean file
| Quadrant A | 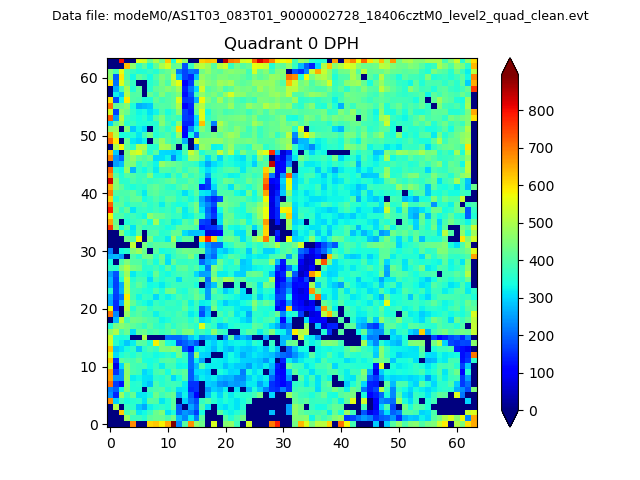 |
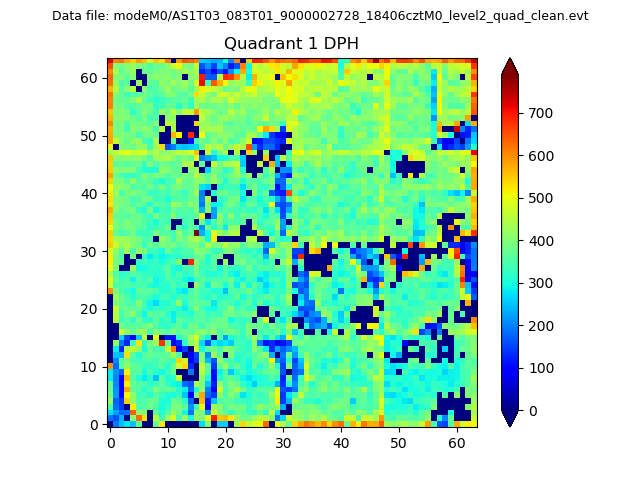 |
Quadrant B |
|---|---|---|---|
| Quadrant D | 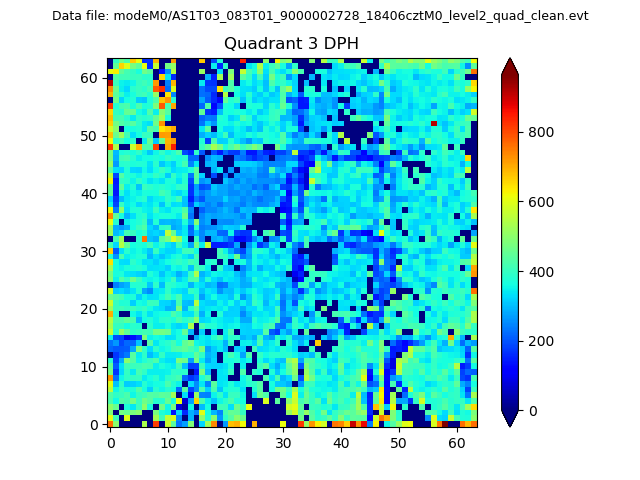 |
 |
Quadrant C |
| Plot type | Count rate plots | Images |
|---|---|---|
| Comparison with Poisson distribution Blue bars denote a histogram of data divided into 1 sec bins. Red curve is a Poisson curve with rate = median count rate of data. |
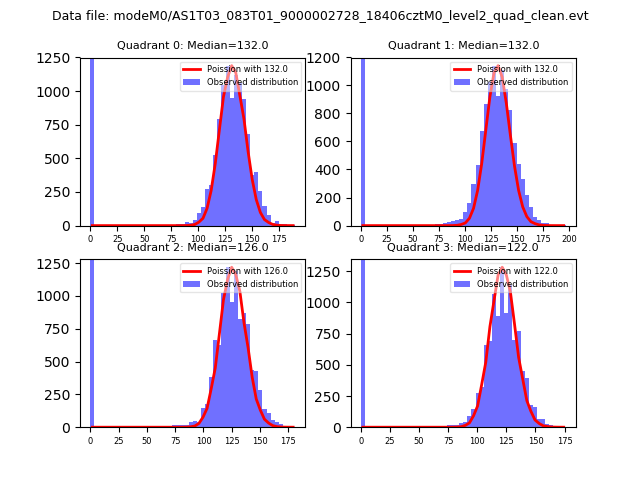 |
 |
| Quadrant-wise count rates Data is divided into 100 sec bins |
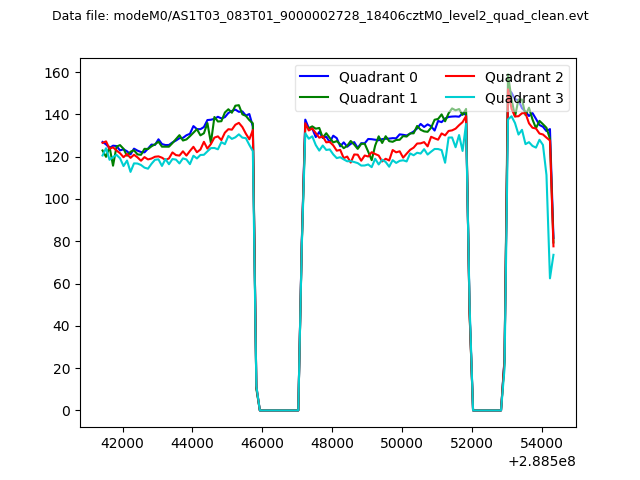 |
|
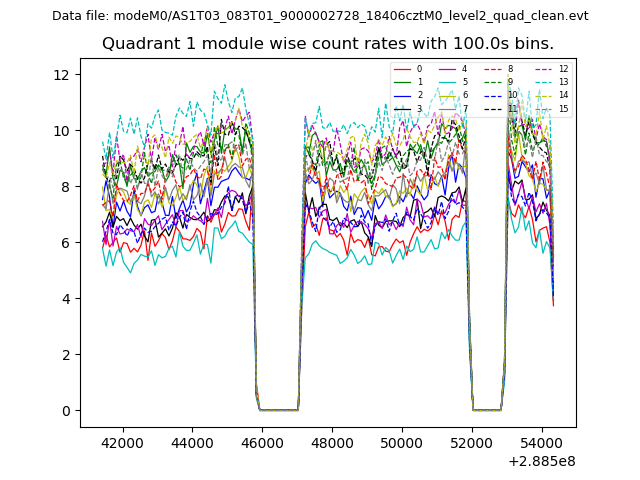
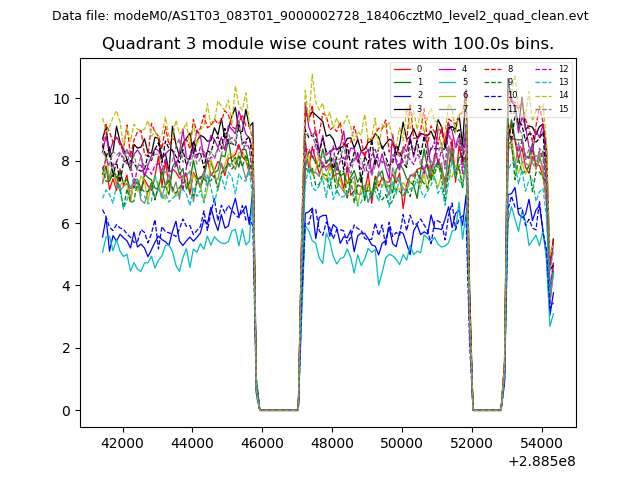
| Module-wise count rates for Quadrant A Data is divided into 100 sec bins |
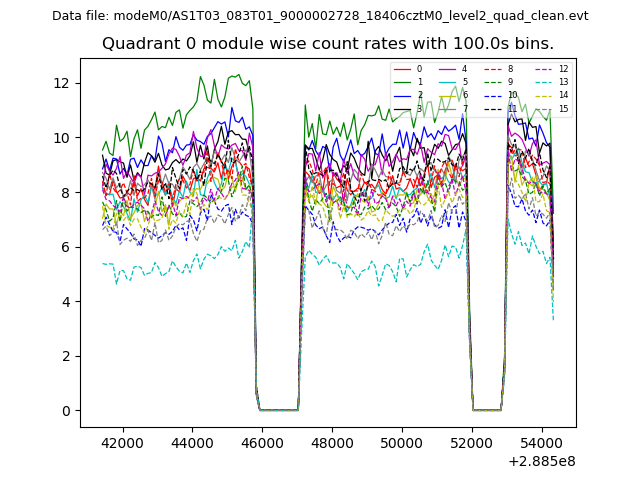 |
 |
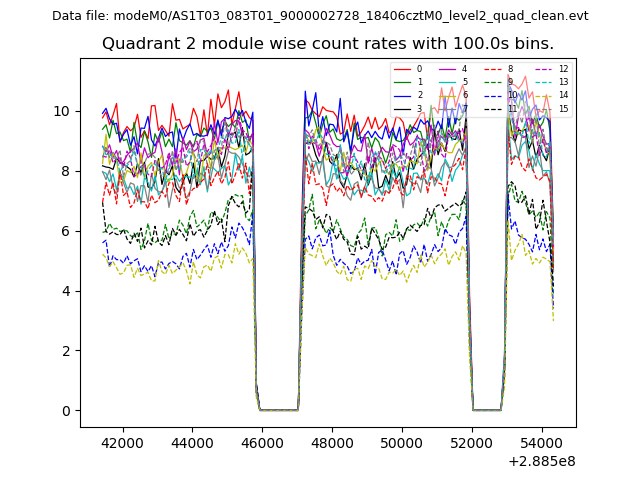
| Module-wise count rates for Quadrant B Data is divided into 100 sec bins |
 |
 |
| Module-wise count rates for Quadrant C Data is divided into 100 sec bins |
 |
 |
| Module-wise count rates for Quadrant D Data is divided into 100 sec bins |
 |
 |
| Parameter | Plot |
|---|---|
| CZT HV Monitor | 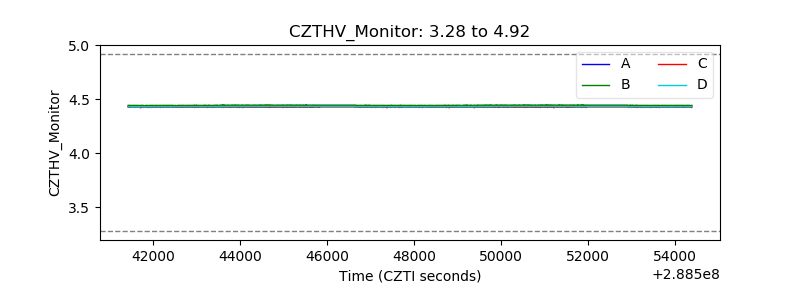 |
| D_VDD | 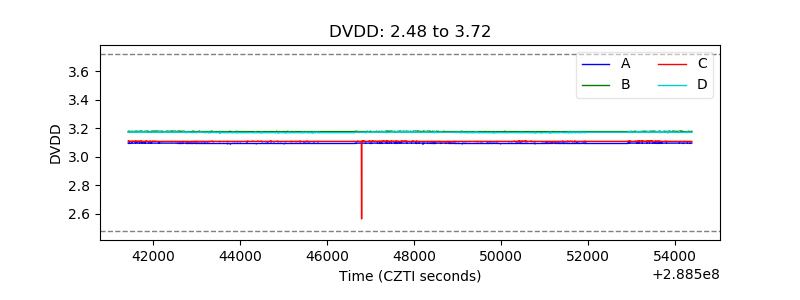 |
| Temperature 1 | 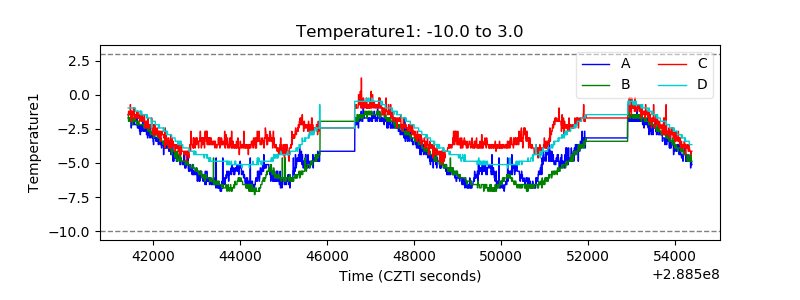 |
| Veto HV Monitor | 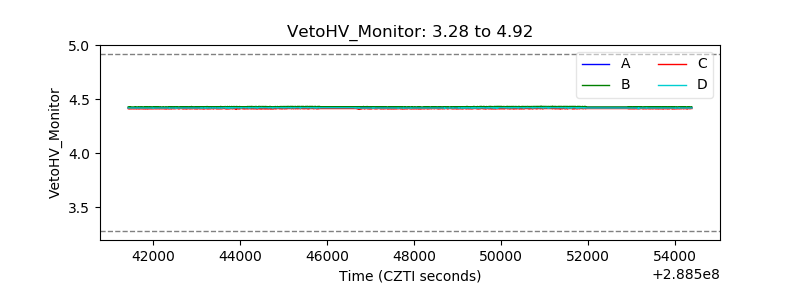 |
| Veto LLD | 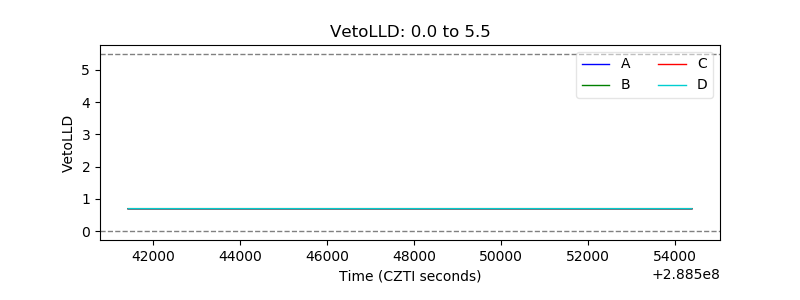 |
| Alpha Counter | 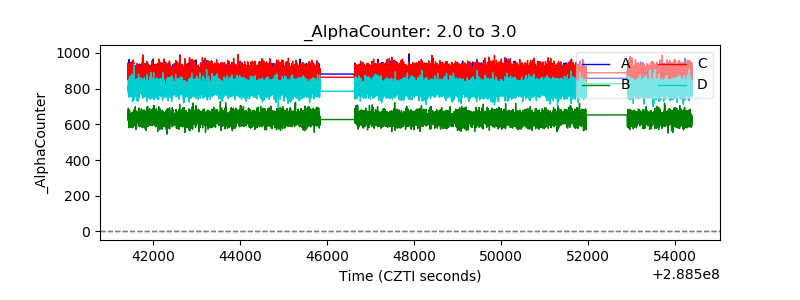 |
| _CPM_Rate | 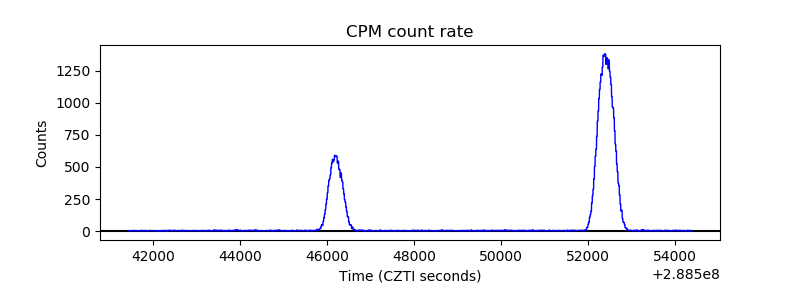 |
| CZT Counter |  |
| +2.5 Volts monitor |  |
| +5 Volts monitor |  |
| _ROLL_ROT |  |
| _Roll_DEC |  |
| _Roll_RA | 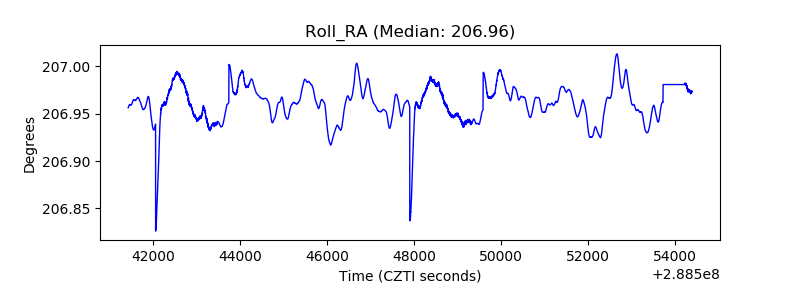 |
| Veto Counter |  |