| Param | Original file | Final file |
|---|---|---|
| Filename | modeM0/AS1T03_083T01_9000002728_18410cztM0_level2.evt | modeM0/AS1T03_083T01_9000002728_18410cztM0_level2_quad_clean.evt |
| Size (bytes) | 487,431,360 | 110,684,160 |
| Size | 464.9 MB | 105.6 MB |
| Events in quadrant A | 3,002,788 | 759,649 |
| Events in quadrant B | 5,041,802 | 759,321 |
| Events in quadrant C | 2,856,953 | 728,315 |
| Events in quadrant D | 3,462,195 | 694,494 |
| Mode M0 | |||
|---|---|---|---|
| Quadrant | BADHDUFLAG | Total packets | Discarded packets |
| A | 0 | 12686 | 1 |
| B | 0 | 19185 | 1 |
| C | 0 | 12207 | 1 |
| D | 0 | 14100 | 1 |
| Mode SS | |||
|---|---|---|---|
| Quadrant | BADHDUFLAG | Total packets | Discarded packets |
| A | 0 | 118 | 0 |
| B | 0 | 118 | 0 |
| C | 0 | 118 | 0 |
| D | 0 | 118 | 0 |
| Mode M9 | |||
|---|---|---|---|
| Quadrant | BADHDUFLAG | Total packets | Discarded packets |
| A | 0 | 12 | 0 |
| B | 0 | 12 | 0 |
| C | 0 | 12 | 0 |
| D | 0 | 12 | 0 |
| Quadrant | Total seconds | Saturated seconds | Saturation percentage |
|---|---|---|---|
| A | 5880 | 55 | 0.935374% |
| B | 5881 | 183 | 3.111716% |
| C | 5881 | 33 | 0.561129% |
| D | 5881 | 79 | 1.343309% |
Noise dominated data is calculated using 1-second bins in cleaned event files. If a bin has >2000 counts, and if more than 50% of those come from <1% of pixels, then it is considered to be noise-dominated and hence unusable.
| Quadrant | # 1 sec bins | Bins with >0 counts | Bins with >2000 counts | High rate bins dominated by noise | Noise dominated (total time) | Noise dominated (detector-on time) | Marked lightcurve |
|---|---|---|---|---|---|---|---|
| A | 7075 | 5881 | 31 | 31 | 0.44% | 0.53% | 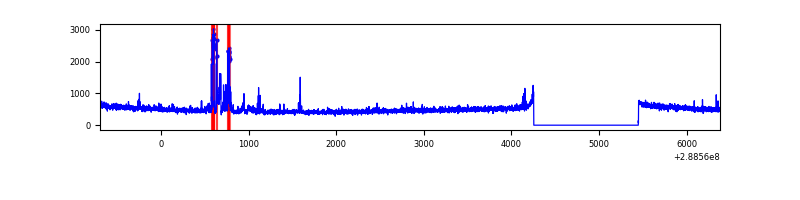 |
| B | 7076 | 5882 | 30 | 30 | 0.42% | 0.51% | 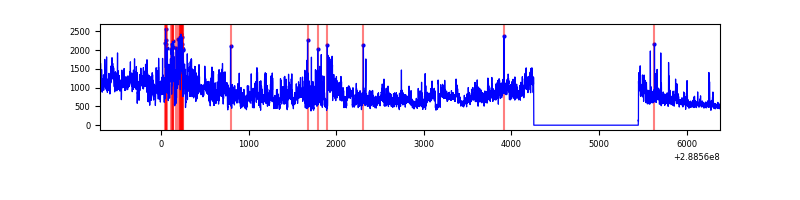 |
| C | 7076 | 5882 | 0 | 0 | 0.00% | 0.00% | 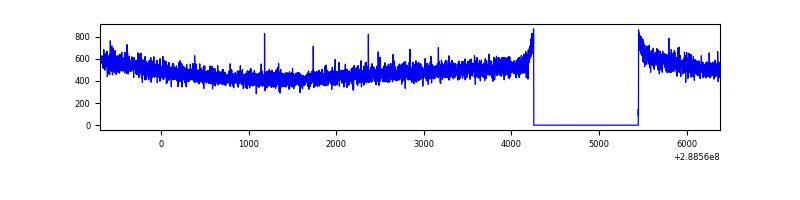 |
| D | 7076 | 5882 | 51 | 51 | 0.72% | 0.87% | 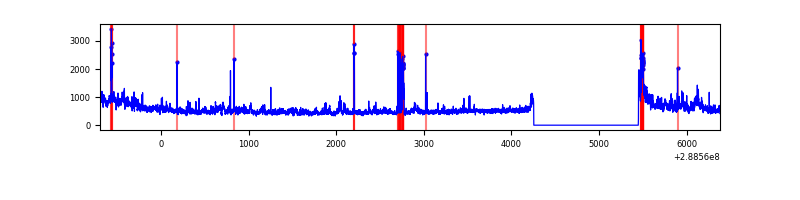 |
Top three noisy pixels from each quadrant. If the there are fewer than three noisy pixels in the level2.evt file, extra rows are filled as -1
| Pixel properties | Quadrant properties | ||||||
|---|---|---|---|---|---|---|---|
| Quadrant | DetID | PixID | Counts | Sigma | Mean | Median | Sigma |
| A | 15 | 174 | 173696 | 1168.64 | 732 | 719 | 148.0 |
| A | 4 | 2 | 19999 | 130.26 | 732 | 719 | 148.0 |
| A | 0 | 226 | 6352 | 38.06 | 732 | 719 | 148.0 |
| B | 10 | 245 | 2098303 | 15257.42 | 732 | 716 | 137.5 |
| B | 0 | 189 | 34547 | 246.08 | 732 | 716 | 137.5 |
| B | 0 | 197 | 23511 | 165.81 | 732 | 716 | 137.5 |
| C | 14 | 238 | 108659 | 657.18 | 703 | 709 | 164.3 |
| C | 13 | 61 | 4920 | 25.64 | 703 | 709 | 164.3 |
| C | 8 | 128 | 3380 | 16.26 | 703 | 709 | 164.3 |
| D | 8 | 230 | 279957 | 1651.09 | 697 | 678 | 169.1 |
| D | 12 | 110 | 232943 | 1373.15 | 697 | 678 | 169.1 |
| D | 7 | 238 | 151832 | 893.62 | 697 | 678 | 169.1 |
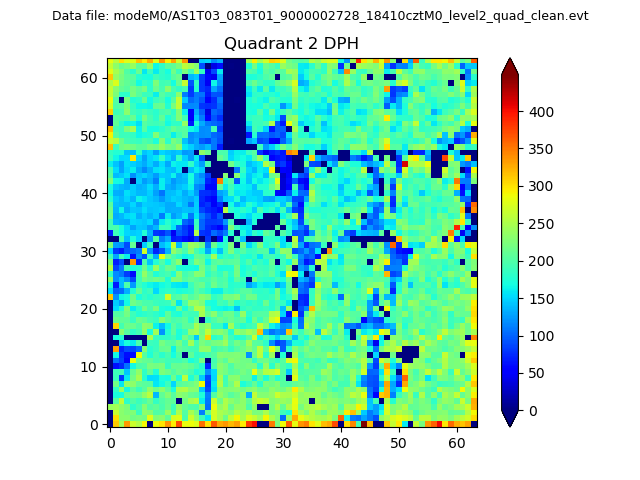
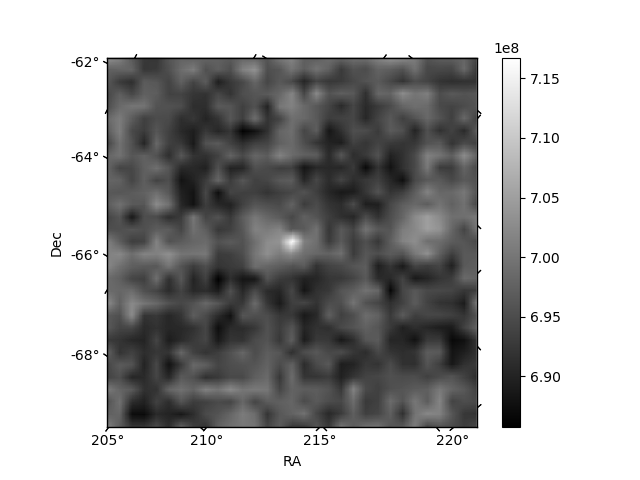
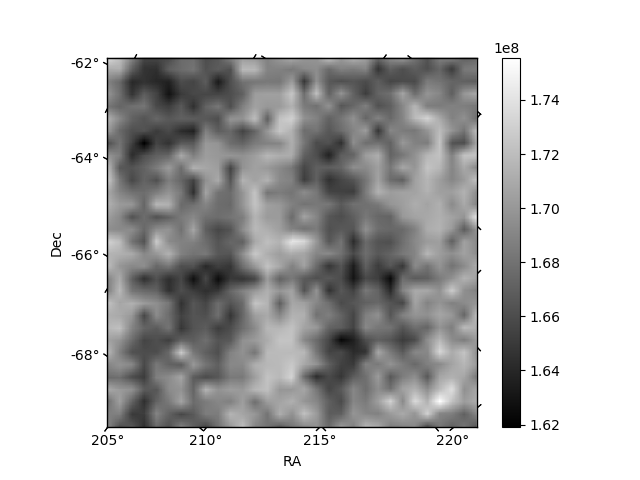
Histogram calculated using DETX and DETY for each event in the final _common_clean file
| Quadrant A | 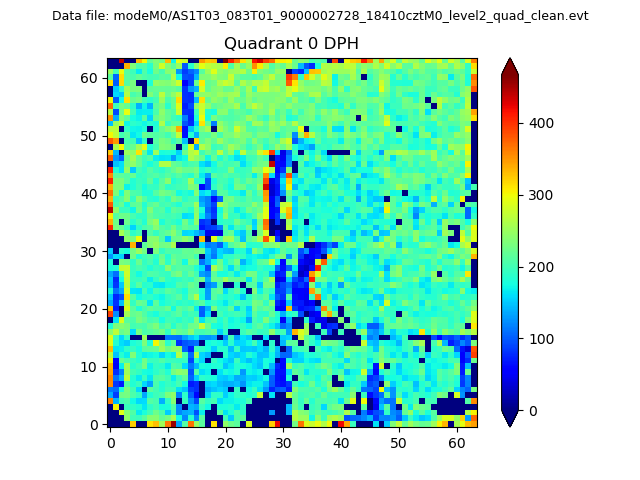 |
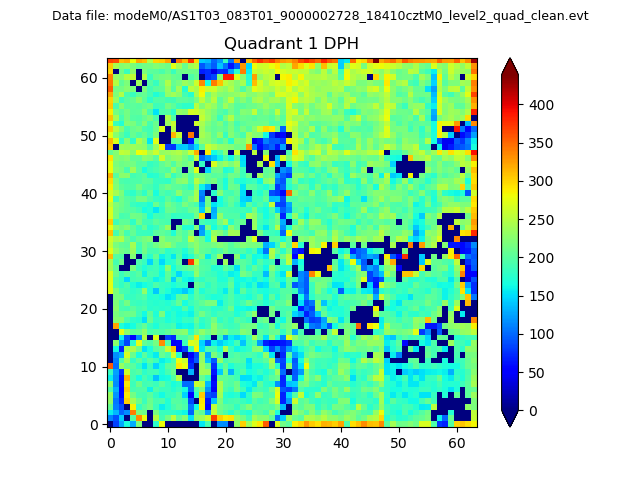 |
Quadrant B |
|---|---|---|---|
| Quadrant D | 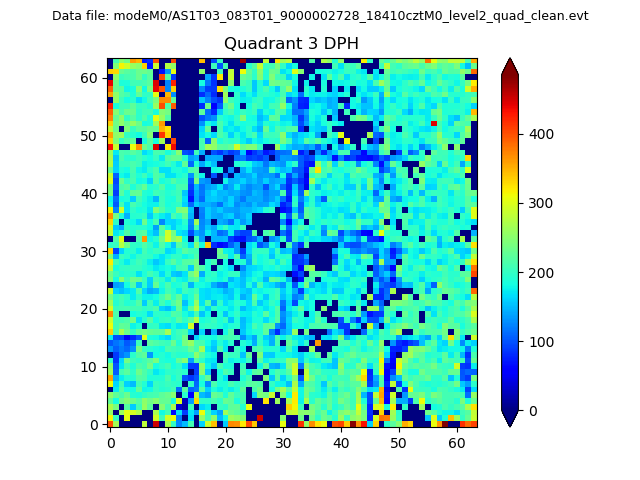 |
 |
Quadrant C |
| Plot type | Count rate plots | Images |
|---|---|---|
| Comparison with Poisson distribution Blue bars denote a histogram of data divided into 1 sec bins. Red curve is a Poisson curve with rate = median count rate of data. |
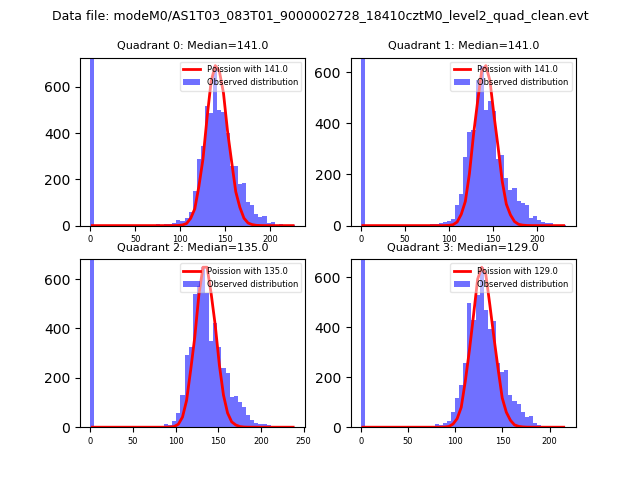 |
 |
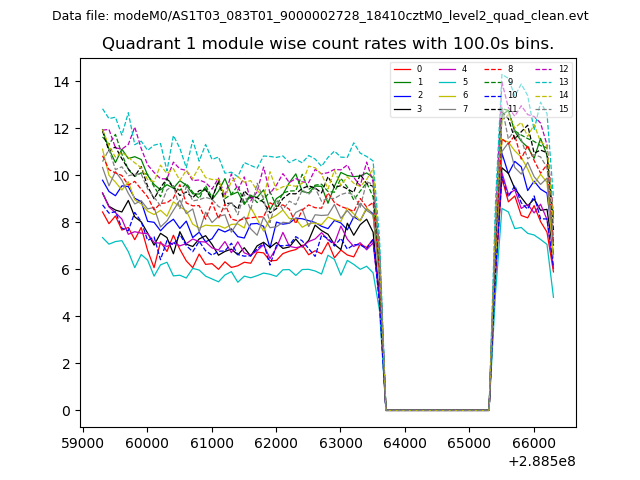
| Quadrant-wise count rates Data is divided into 100 sec bins |
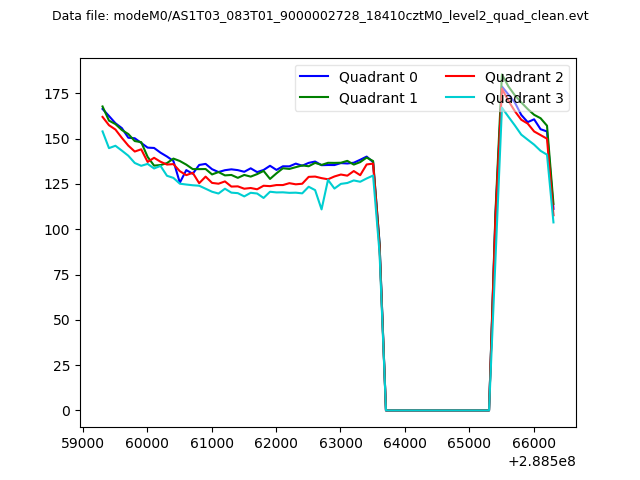 |
|
| Module-wise count rates for Quadrant A Data is divided into 100 sec bins |
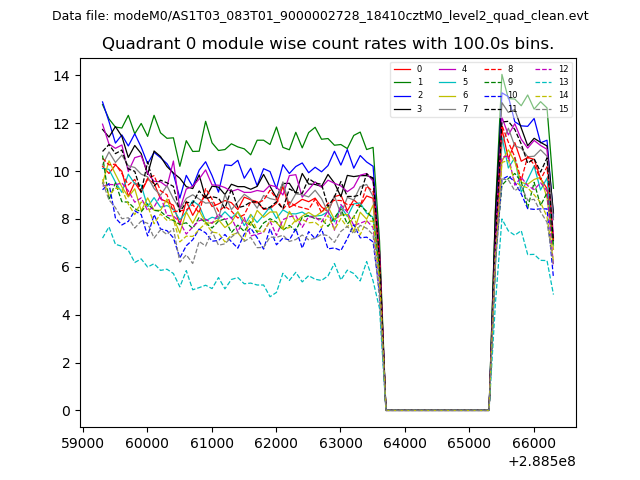 |
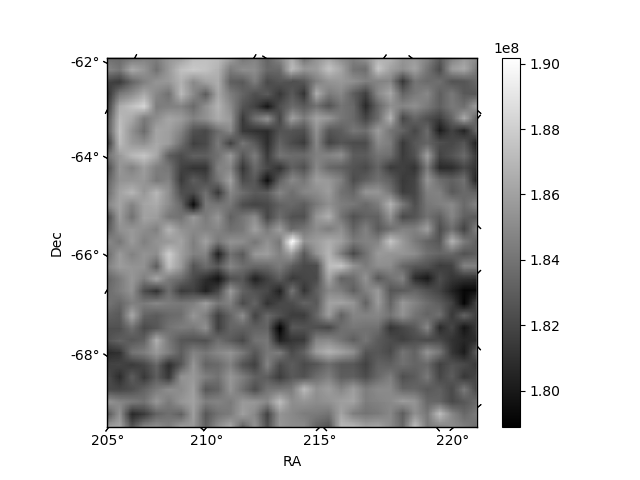 |
| Module-wise count rates for Quadrant B Data is divided into 100 sec bins |
 |
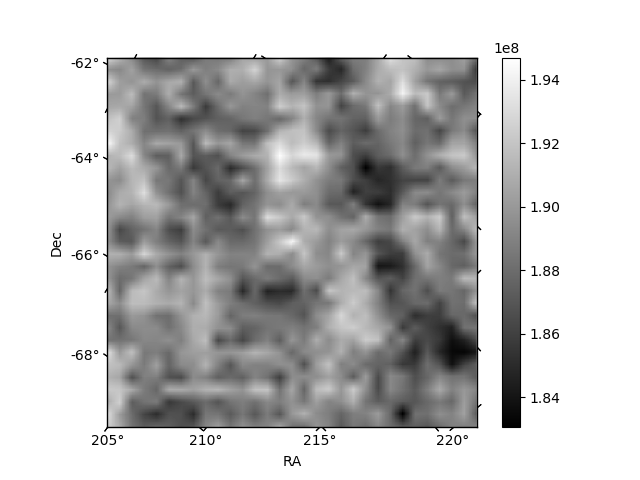 |
| Module-wise count rates for Quadrant C Data is divided into 100 sec bins |
 |
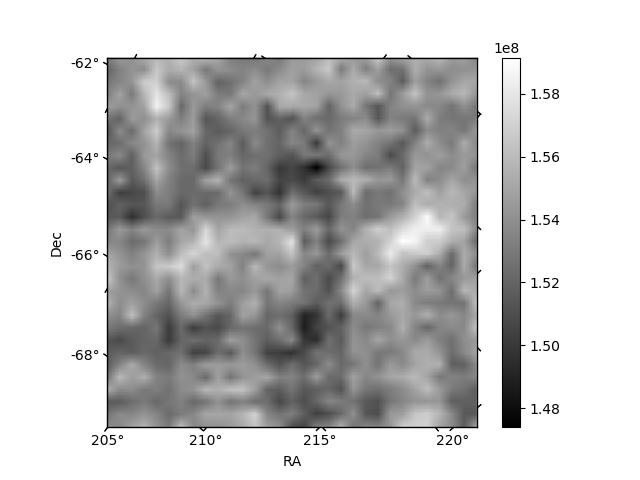 |
| Module-wise count rates for Quadrant D Data is divided into 100 sec bins |
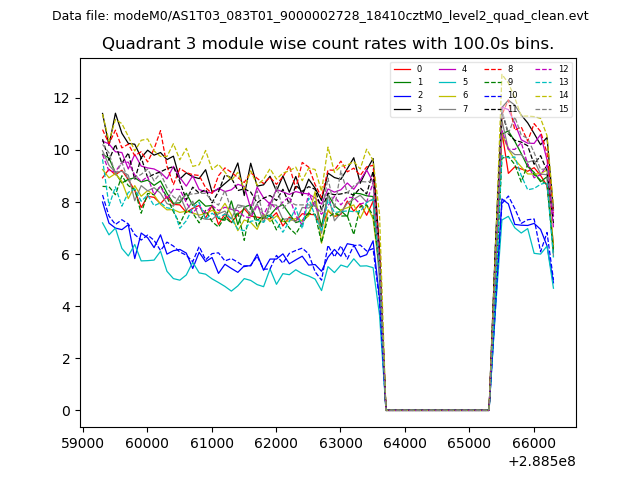 |
 |
| Parameter | Plot |
|---|---|
| CZT HV Monitor | 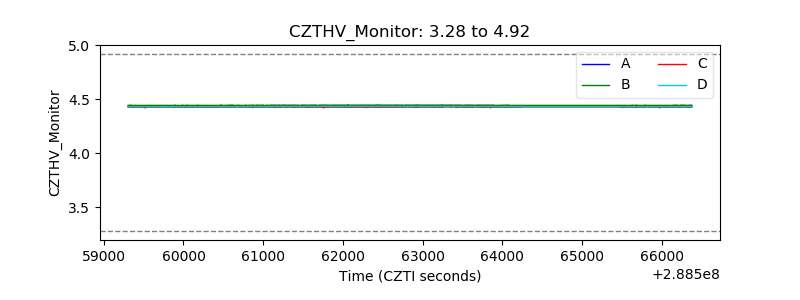 |
| D_VDD | 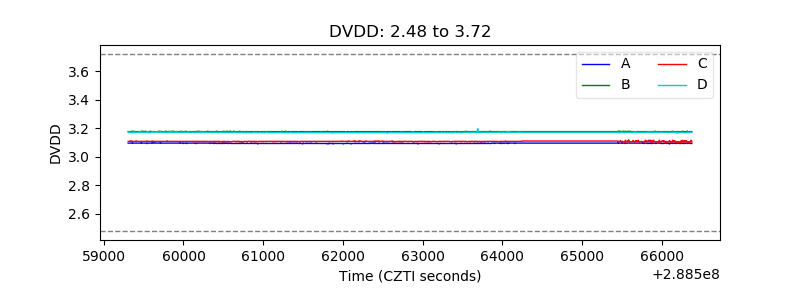 |
| Temperature 1 | 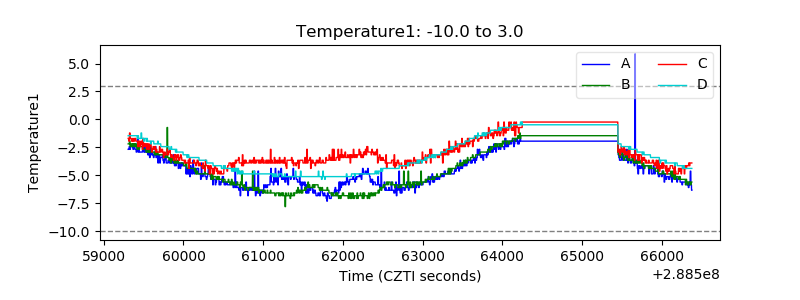 |
| Veto HV Monitor | 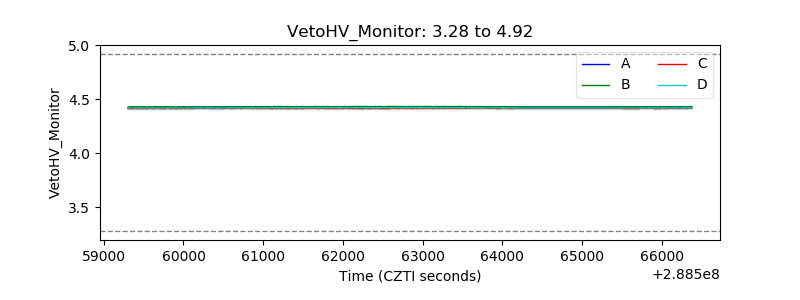 |
| Veto LLD | 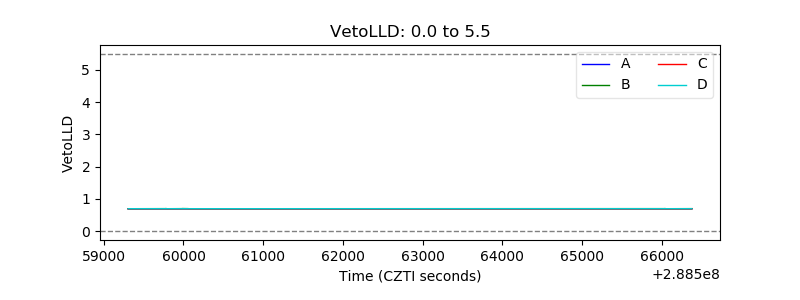 |
| Alpha Counter | 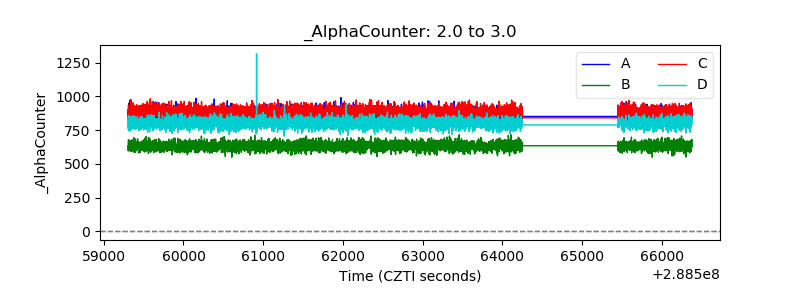 |
| _CPM_Rate | 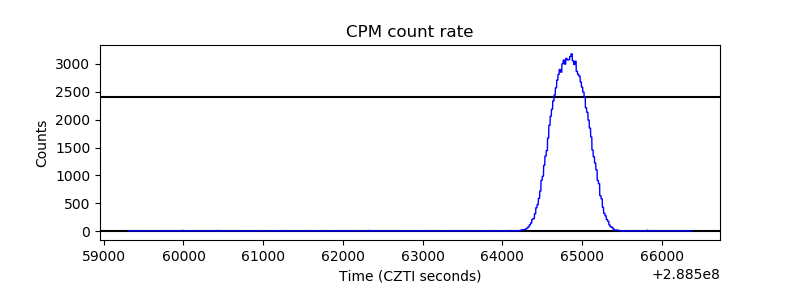 |
| CZT Counter | 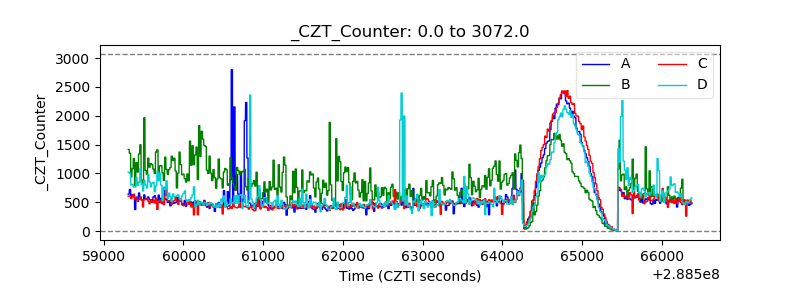 |
| +2.5 Volts monitor |  |
| +5 Volts monitor |  |
| _ROLL_ROT | 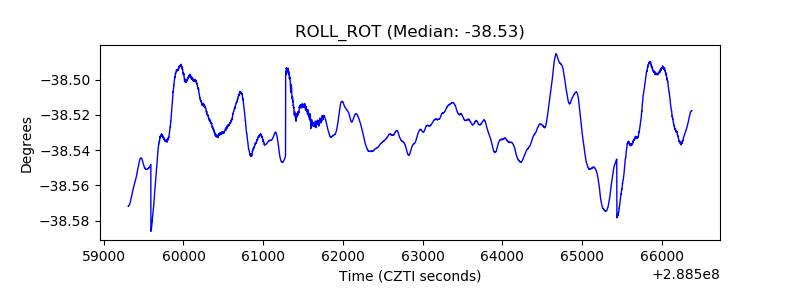 |
| _Roll_DEC | 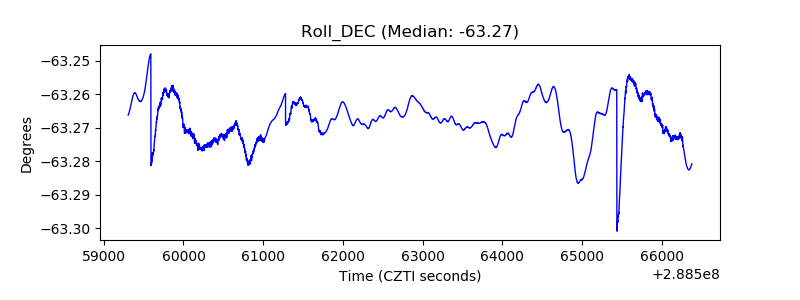 |
| _Roll_RA | 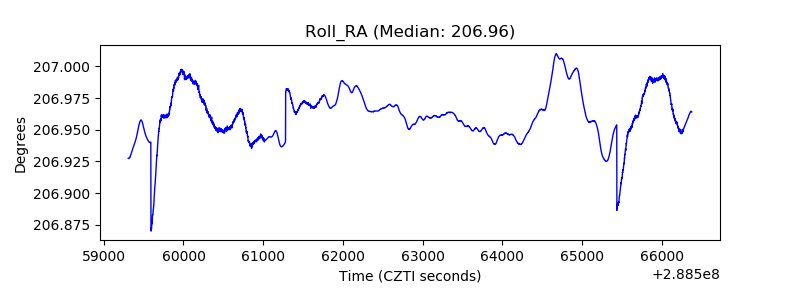 |
| Veto Counter | 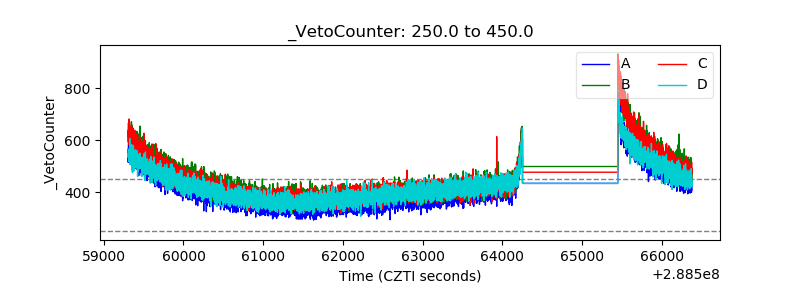 |