| Param | Original file | Final file |
|---|---|---|
| Filename | modeM0/AS1A05_199T01_9000002732_18415cztM0_level2.evt | modeM0/AS1A05_199T01_9000002732_18415cztM0_level2_quad_clean.evt |
| Size (bytes) | 495,385,920 | 98,092,800 |
| Size | 472.4 MB | 93.5 MB |
| Events in quadrant A | 3,682,675 | 614,851 |
| Events in quadrant B | 3,570,460 | 631,126 |
| Events in quadrant C | 3,533,566 | 608,216 |
| Events in quadrant D | 3,705,797 | 593,921 |
| Mode M0 | |||
|---|---|---|---|
| Quadrant | BADHDUFLAG | Total packets | Discarded packets |
| A | 0 | 15839 | 2 |
| B | 0 | 15482 | 2 |
| C | 0 | 15410 | 2 |
| D | 0 | 16101 | 3 |
| Mode SS | |||
|---|---|---|---|
| Quadrant | BADHDUFLAG | Total packets | Discarded packets |
| A | 0 | 152 | 0 |
| B | 0 | 152 | 0 |
| C | 0 | 152 | 0 |
| D | 0 | 152 | 0 |
| Mode M9 | |||
|---|---|---|---|
| Quadrant | BADHDUFLAG | Total packets | Discarded packets |
| A | 0 | 7 | 0 |
| B | 0 | 7 | 0 |
| C | 0 | 7 | 0 |
| D | 0 | 7 | 0 |
| Quadrant | Total seconds | Saturated seconds | Saturation percentage |
|---|---|---|---|
| A | 7506 | 165 | 2.198241% |
| B | 7506 | 157 | 2.091660% |
| C | 7506 | 142 | 1.891820% |
| D | 7505 | 141 | 1.878748% |
Noise dominated data is calculated using 1-second bins in cleaned event files. If a bin has >2000 counts, and if more than 50% of those come from <1% of pixels, then it is considered to be noise-dominated and hence unusable.
| Quadrant | # 1 sec bins | Bins with >0 counts | Bins with >2000 counts | High rate bins dominated by noise | Noise dominated (total time) | Noise dominated (detector-on time) | Marked lightcurve |
|---|---|---|---|---|---|---|---|
| A | 7881 | 7507 | 13 | 13 | 0.16% | 0.17% | 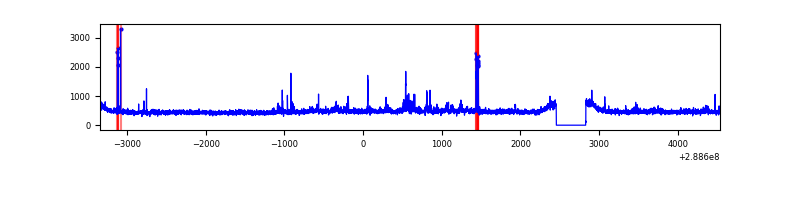 |
| B | 7881 | 7507 | 0 | 0 | 0.00% | 0.00% | 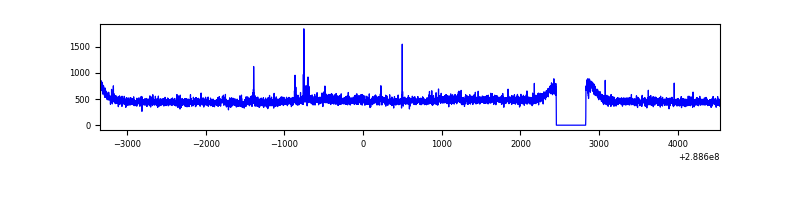 |
| C | 7881 | 7507 | 0 | 0 | 0.00% | 0.00% | 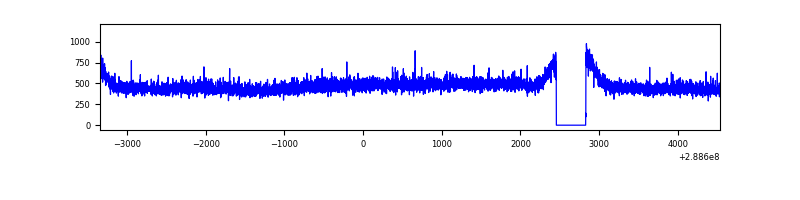 |
| D | 7880 | 7506 | 40 | 40 | 0.51% | 0.53% | 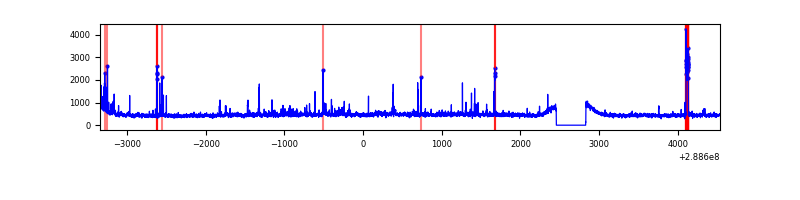 |
Top three noisy pixels from each quadrant. If the there are fewer than three noisy pixels in the level2.evt file, extra rows are filled as -1
| Pixel properties | Quadrant properties | ||||||
|---|---|---|---|---|---|---|---|
| Quadrant | DetID | PixID | Counts | Sigma | Mean | Median | Sigma |
| A | 15 | 174 | 205105 | 1128.57 | 898 | 877 | 181.0 |
| A | 4 | 2 | 23603 | 125.58 | 898 | 877 | 181.0 |
| A | 0 | 226 | 7878 | 38.69 | 898 | 877 | 181.0 |
| B | 0 | 189 | 30993 | 173.78 | 898 | 874 | 173.3 |
| B | 12 | 111 | 20842 | 115.21 | 898 | 874 | 173.3 |
| B | 11 | 111 | 17789 | 97.59 | 898 | 874 | 173.3 |
| C | 14 | 238 | 132852 | 654.34 | 858 | 862 | 201.7 |
| C | 3 | 233 | 53616 | 261.53 | 858 | 862 | 201.7 |
| C | 13 | 61 | 6104 | 25.99 | 858 | 862 | 201.7 |
| D | 1 | 52 | 130547 | 615.79 | 867 | 840 | 210.6 |
| D | 7 | 238 | 108064 | 509.05 | 867 | 840 | 210.6 |
| D | 8 | 230 | 58116 | 271.92 | 867 | 840 | 210.6 |
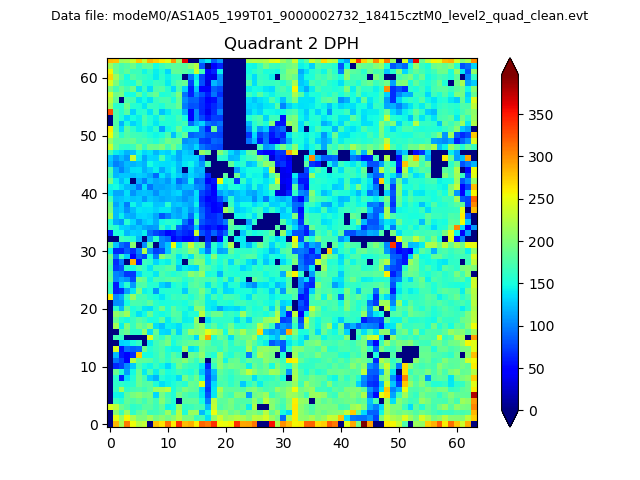
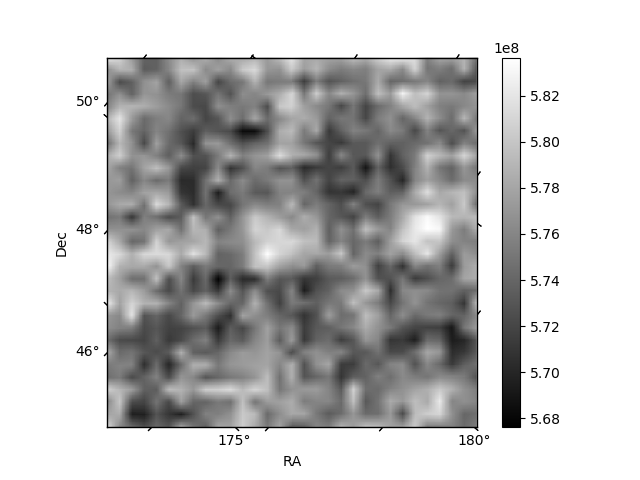
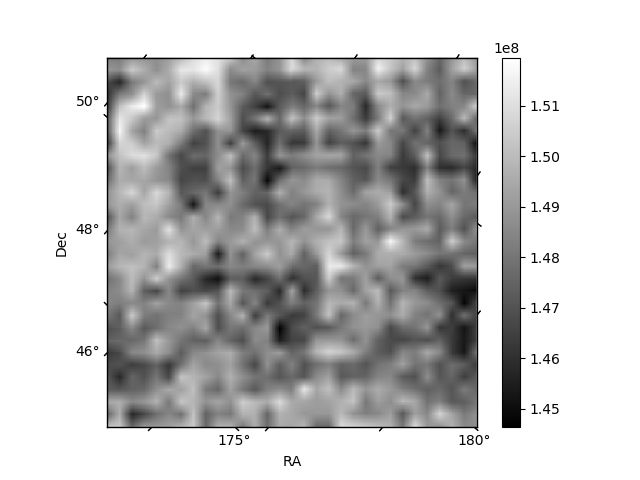
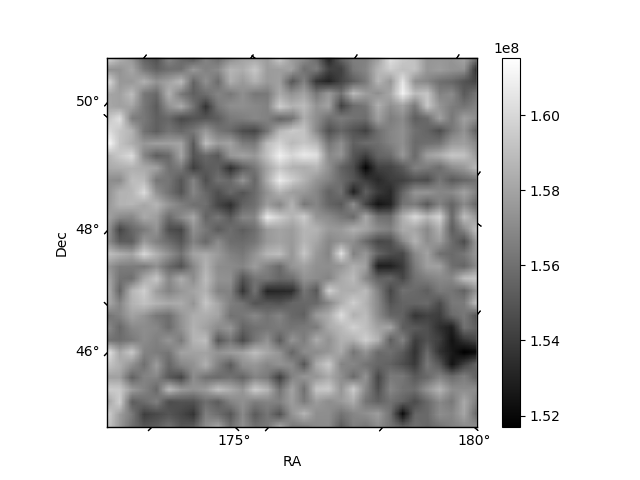
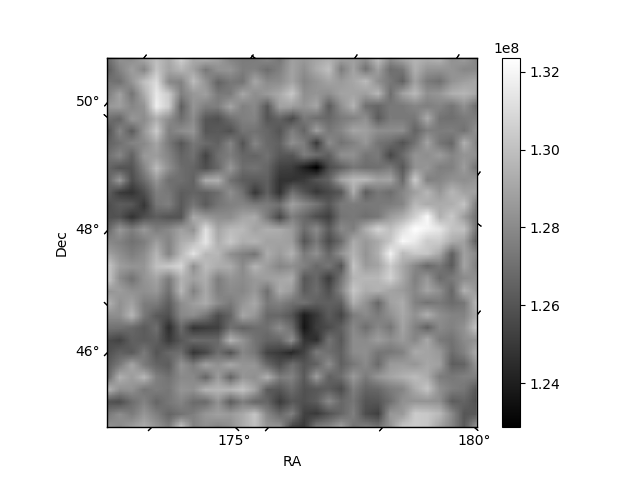
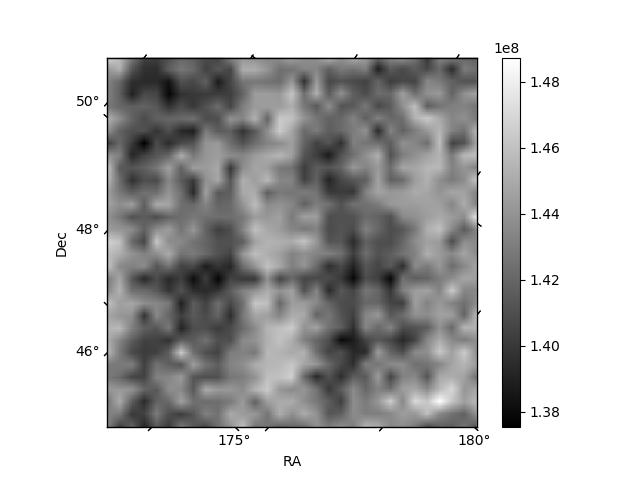
Histogram calculated using DETX and DETY for each event in the final _common_clean file
| Quadrant A | 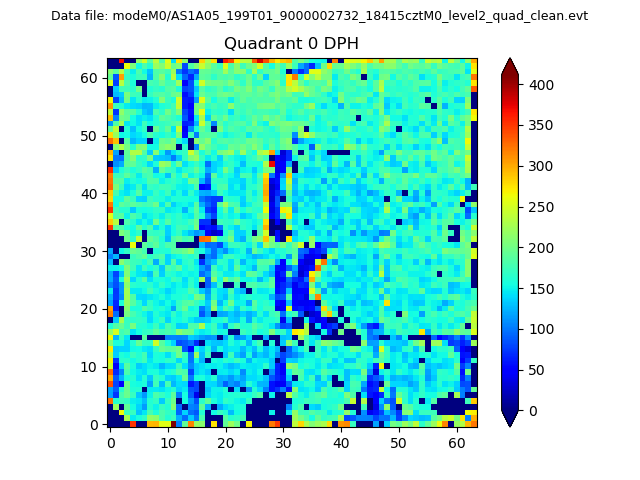 |
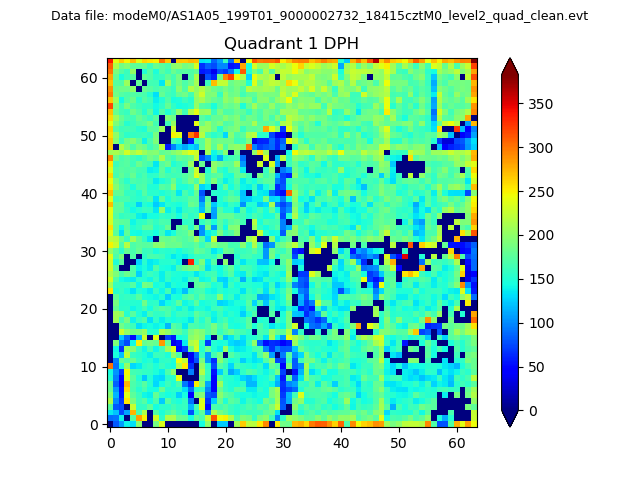 |
Quadrant B |
|---|---|---|---|
| Quadrant D | 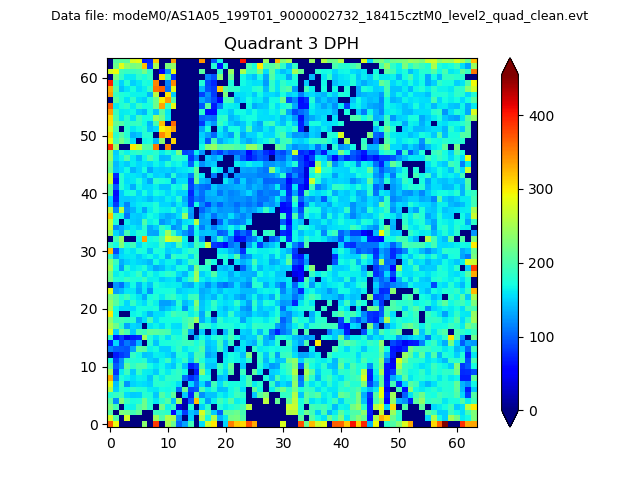 |
 |
Quadrant C |
| Plot type | Count rate plots | Images |
|---|---|---|
| Comparison with Poisson distribution Blue bars denote a histogram of data divided into 1 sec bins. Red curve is a Poisson curve with rate = median count rate of data. |
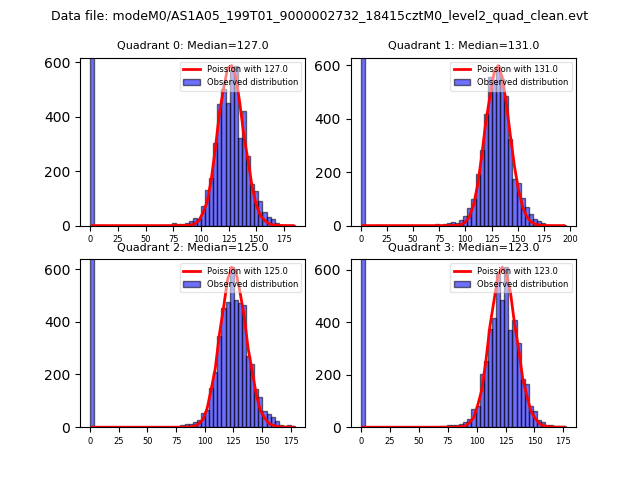 |
 |
| Quadrant-wise count rates Data is divided into 100 sec bins |
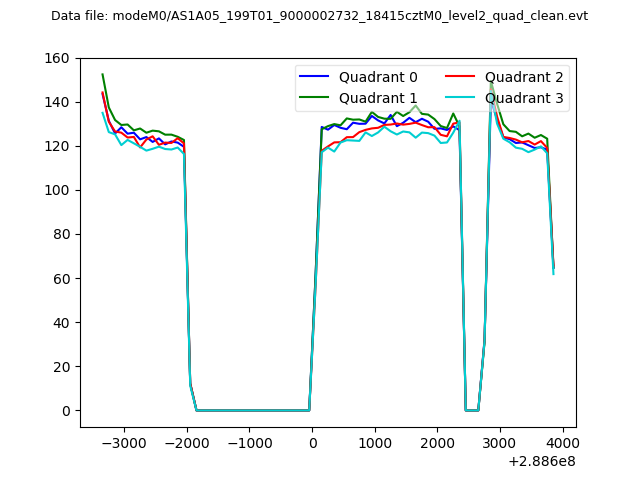 |
|
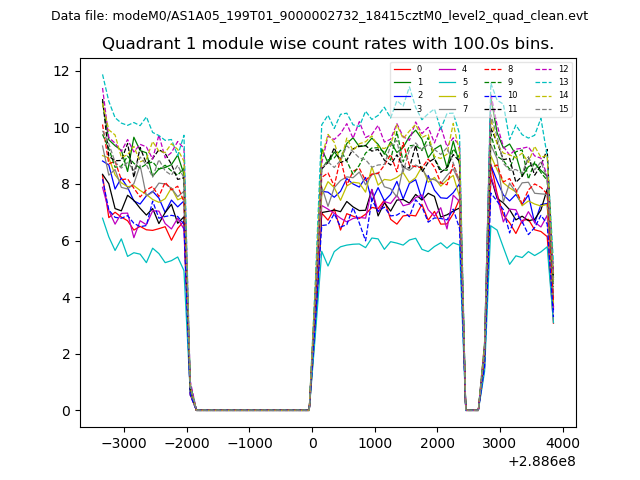
| Module-wise count rates for Quadrant A Data is divided into 100 sec bins |
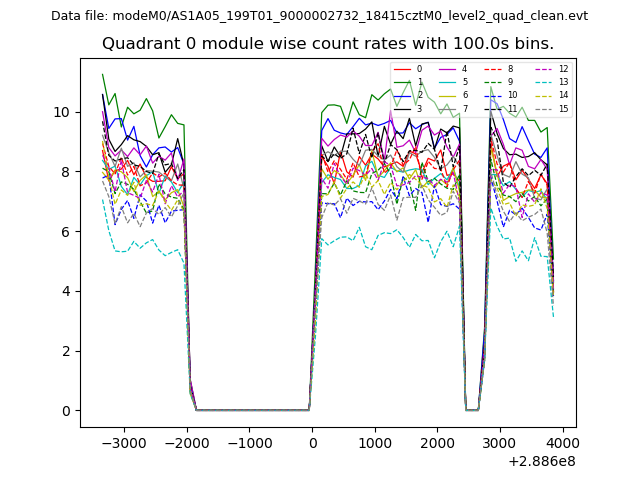 |
 |
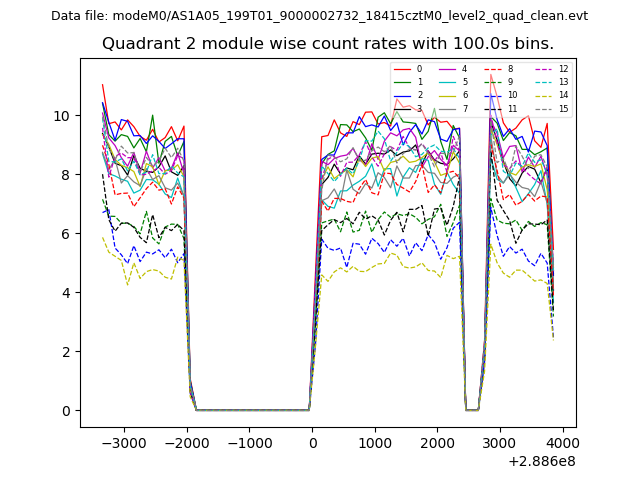
| Module-wise count rates for Quadrant B Data is divided into 100 sec bins |
 |
 |
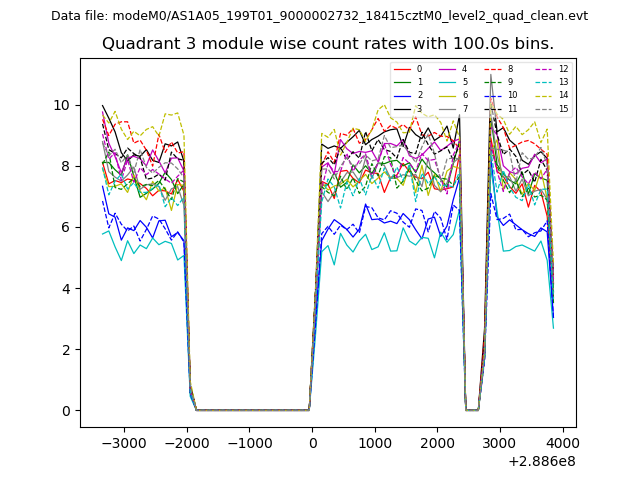
| Module-wise count rates for Quadrant C Data is divided into 100 sec bins |
 |
 |
| Module-wise count rates for Quadrant D Data is divided into 100 sec bins |
 |
 |
| Parameter | Plot |
|---|---|
| CZT HV Monitor | 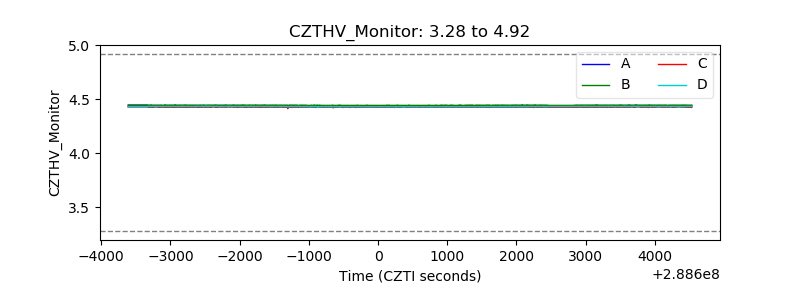 |
| D_VDD | 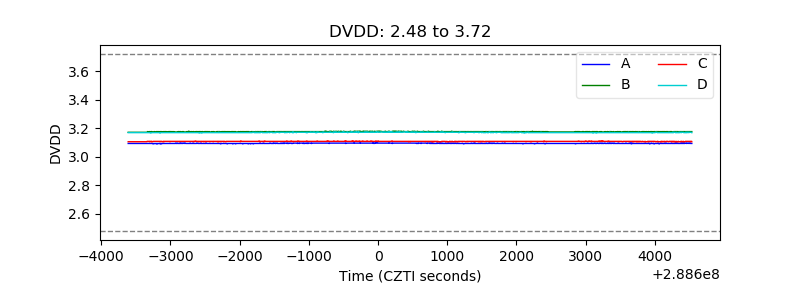 |
| Temperature 1 |  |
| Veto HV Monitor | 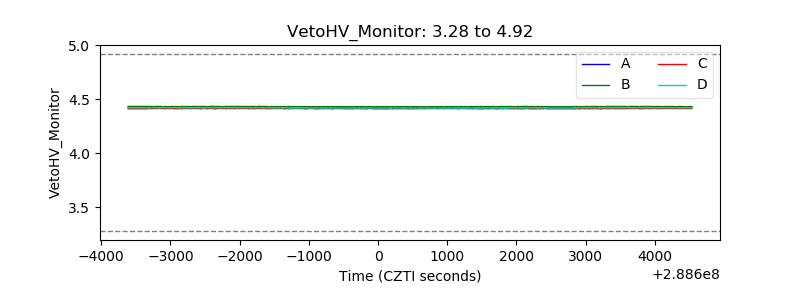 |
| Veto LLD | 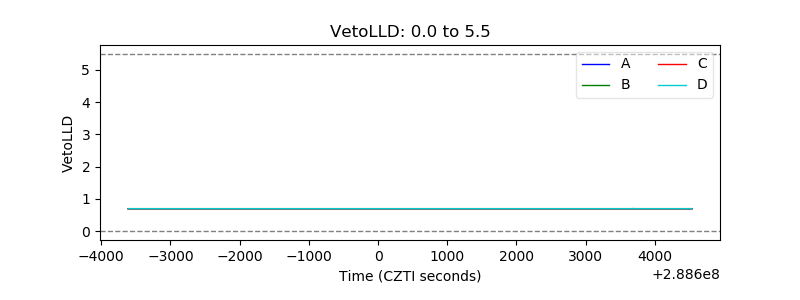 |
| Alpha Counter | 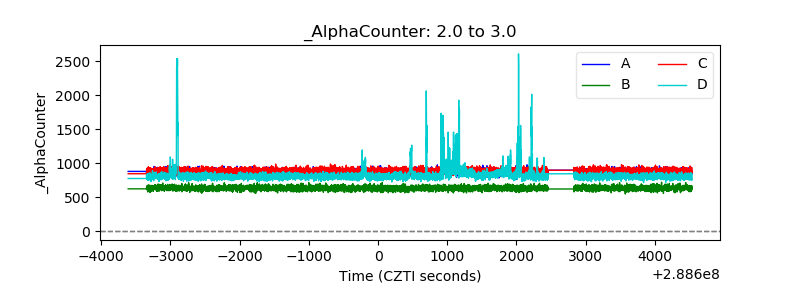 |
| _CPM_Rate | 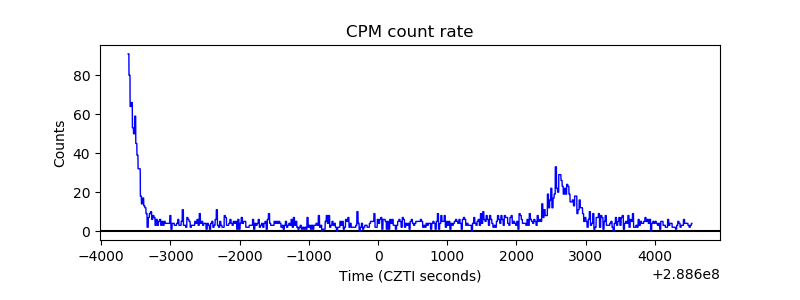 |
| CZT Counter | 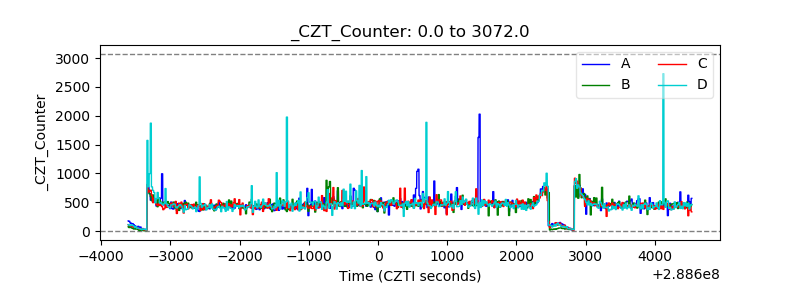 |
| +2.5 Volts monitor | 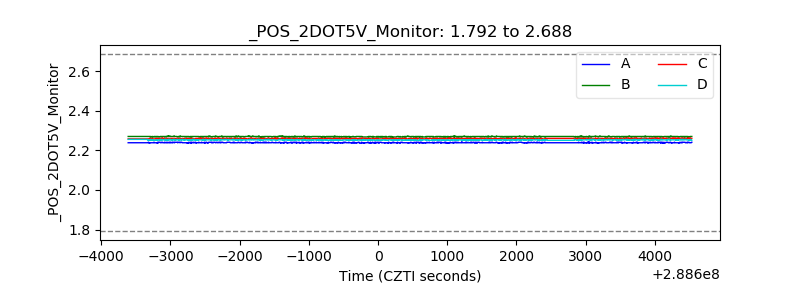 |
| +5 Volts monitor |  |
| _ROLL_ROT | 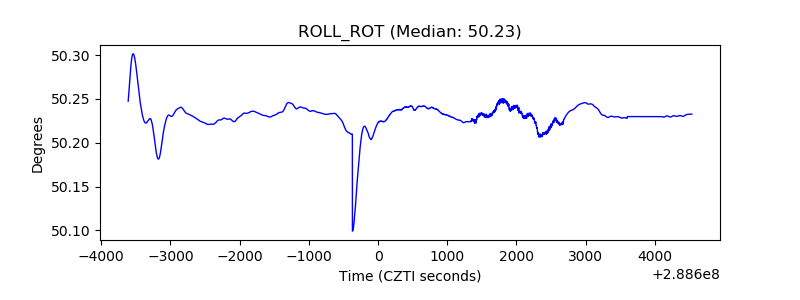 |
| _Roll_DEC | 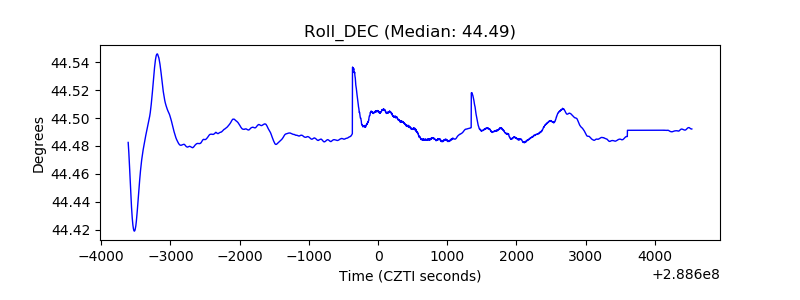 |
| _Roll_RA | 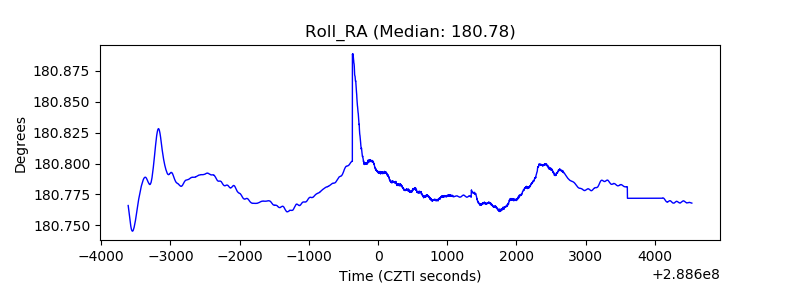 |
| Veto Counter | 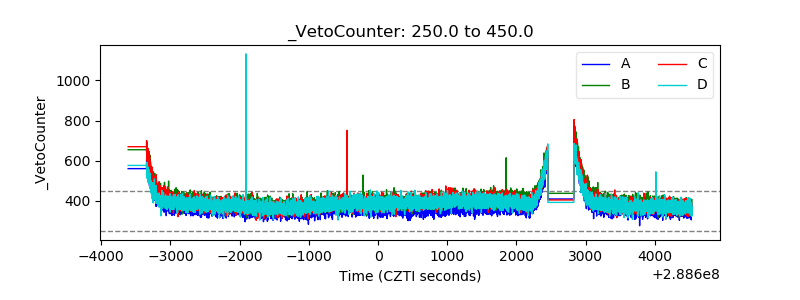 |