| Param | Original file | Final file |
|---|---|---|
| Filename | modeM0/AS1A05_199T01_9000002732_18416cztM0_level2.evt | modeM0/AS1A05_199T01_9000002732_18416cztM0_level2_quad_clean.evt |
| Size (bytes) | 526,317,120 | 95,310,720 |
| Size | 501.9 MB | 90.9 MB |
| Events in quadrant A | 4,024,874 | 589,477 |
| Events in quadrant B | 3,819,924 | 601,988 |
| Events in quadrant C | 3,661,205 | 581,135 |
| Events in quadrant D | 3,903,435 | 570,771 |
| Mode M0 | |||
|---|---|---|---|
| Quadrant | BADHDUFLAG | Total packets | Discarded packets |
| A | 0 | 17051 | 2 |
| B | 0 | 16386 | 2 |
| C | 0 | 16084 | 2 |
| D | 0 | 16776 | 2 |
| Mode SS | |||
|---|---|---|---|
| Quadrant | BADHDUFLAG | Total packets | Discarded packets |
| A | 0 | 158 | 0 |
| B | 0 | 158 | 0 |
| C | 0 | 158 | 0 |
| D | 0 | 158 | 0 |
| Mode M9 | |||
|---|---|---|---|
| Quadrant | BADHDUFLAG | Total packets | Discarded packets |
| A | 0 | 4 | 0 |
| B | 0 | 5 | 0 |
| C | 0 | 5 | 0 |
| D | 0 | 5 | 0 |
| Quadrant | Total seconds | Saturated seconds | Saturation percentage |
|---|---|---|---|
| A | 7804 | 253 | 3.241927% |
| B | 7804 | 252 | 3.229113% |
| C | 7803 | 242 | 3.101371% |
| D | 7803 | 209 | 2.678457% |
Noise dominated data is calculated using 1-second bins in cleaned event files. If a bin has >2000 counts, and if more than 50% of those come from <1% of pixels, then it is considered to be noise-dominated and hence unusable.
| Quadrant | # 1 sec bins | Bins with >0 counts | Bins with >2000 counts | High rate bins dominated by noise | Noise dominated (total time) | Noise dominated (detector-on time) | Marked lightcurve |
|---|---|---|---|---|---|---|---|
| A | 7999 | 7805 | 15 | 15 | 0.19% | 0.19% | 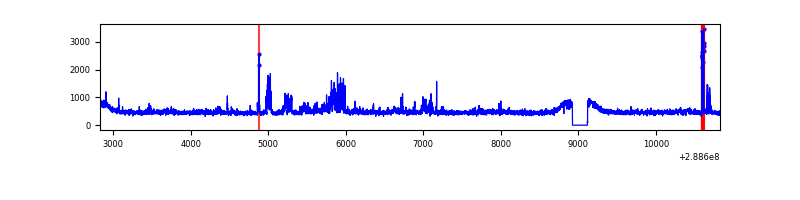 |
| B | 7999 | 7805 | 1 | 1 | 0.01% | 0.01% | 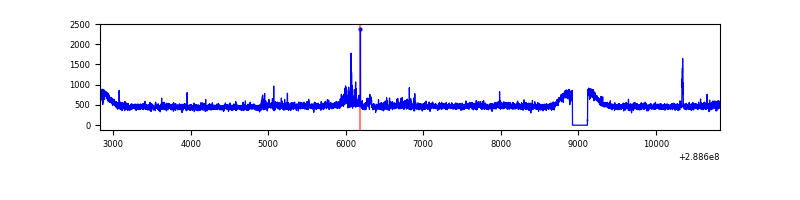 |
| C | 7998 | 7804 | 0 | 0 | 0.00% | 0.00% | 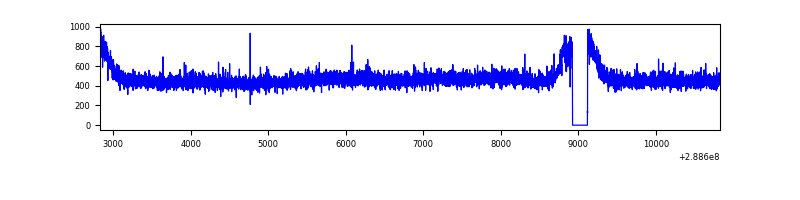 |
| D | 7998 | 7804 | 34 | 34 | 0.43% | 0.44% | 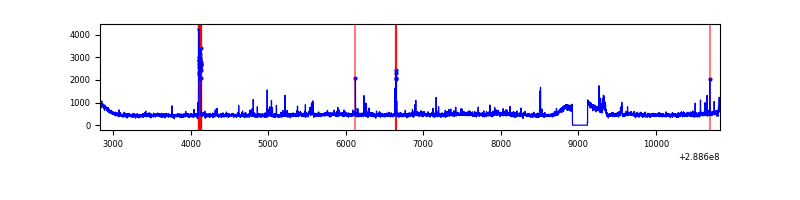 |
Top three noisy pixels from each quadrant. If the there are fewer than three noisy pixels in the level2.evt file, extra rows are filled as -1
| Pixel properties | Quadrant properties | ||||||
|---|---|---|---|---|---|---|---|
| Quadrant | DetID | PixID | Counts | Sigma | Mean | Median | Sigma |
| A | 15 | 174 | 339855 | 1755.76 | 943 | 919 | 193.0 |
| A | 4 | 2 | 42794 | 216.92 | 943 | 919 | 193.0 |
| A | 0 | 254 | 12807 | 61.58 | 943 | 919 | 193.0 |
| B | 12 | 18 | 65188 | 347.97 | 945 | 918 | 184.7 |
| B | 0 | 189 | 28842 | 151.19 | 945 | 918 | 184.7 |
| B | 3 | 64 | 25064 | 130.73 | 945 | 918 | 184.7 |
| C | 14 | 238 | 137824 | 649.52 | 900 | 904 | 210.8 |
| C | 3 | 233 | 15398 | 68.76 | 900 | 904 | 210.8 |
| C | 13 | 61 | 6278 | 25.49 | 900 | 904 | 210.8 |
| D | 1 | 52 | 131938 | 592.83 | 914 | 885 | 221.1 |
| D | 7 | 238 | 114937 | 515.92 | 914 | 885 | 221.1 |
| D | 14 | 34 | 91233 | 408.7 | 914 | 885 | 221.1 |
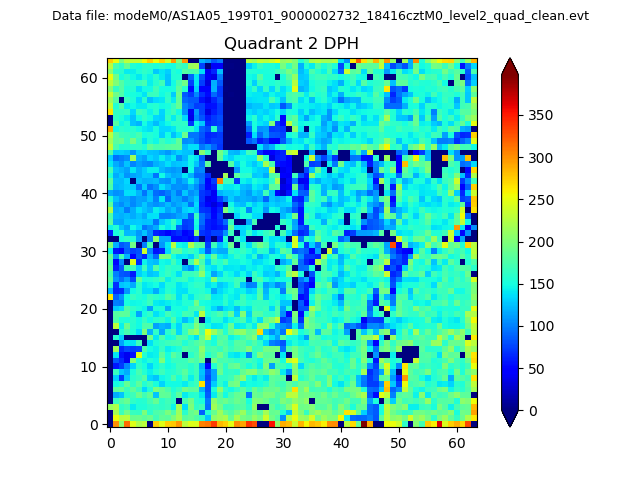
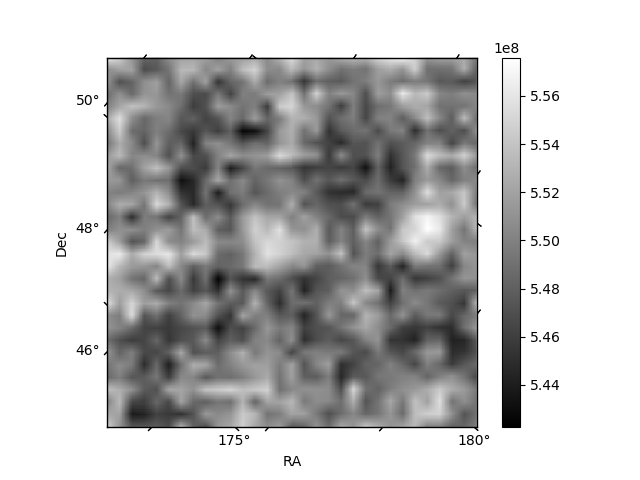
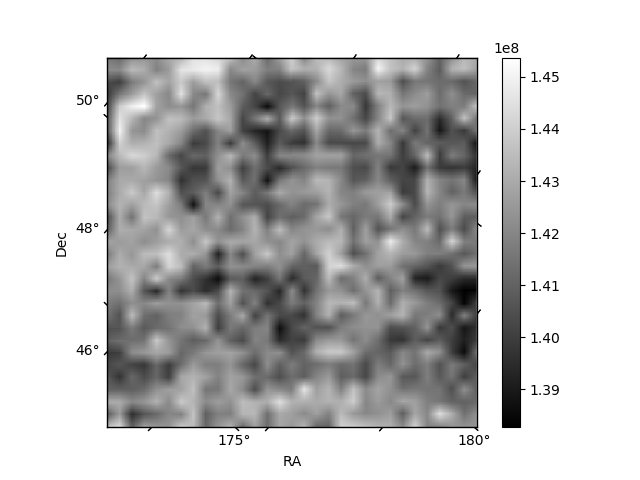
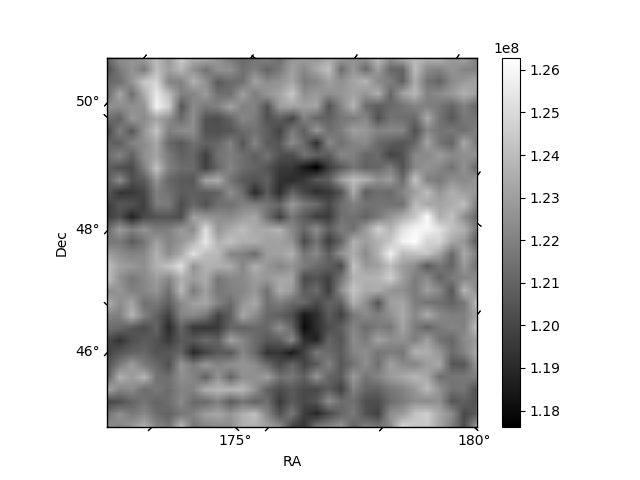
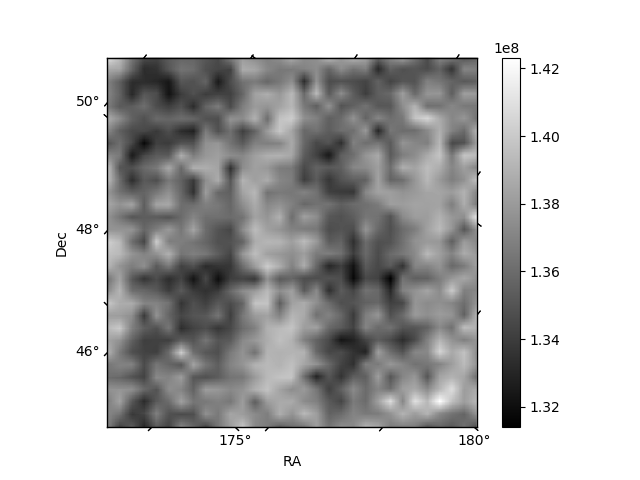
Histogram calculated using DETX and DETY for each event in the final _common_clean file
| Quadrant A | 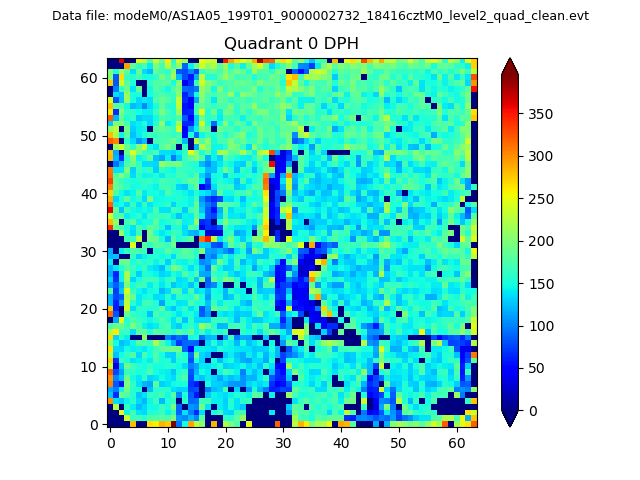 |
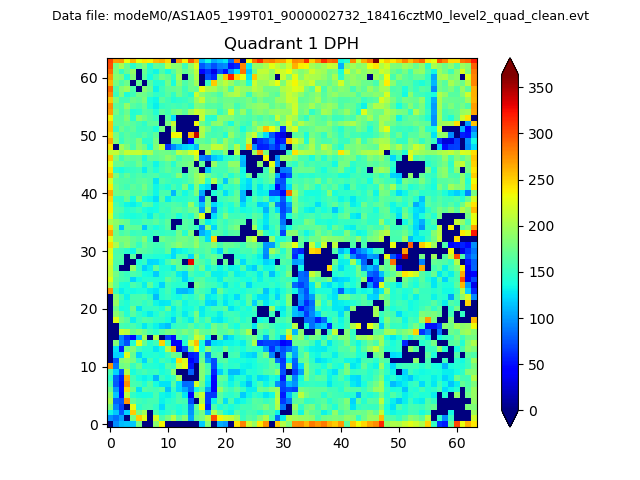 |
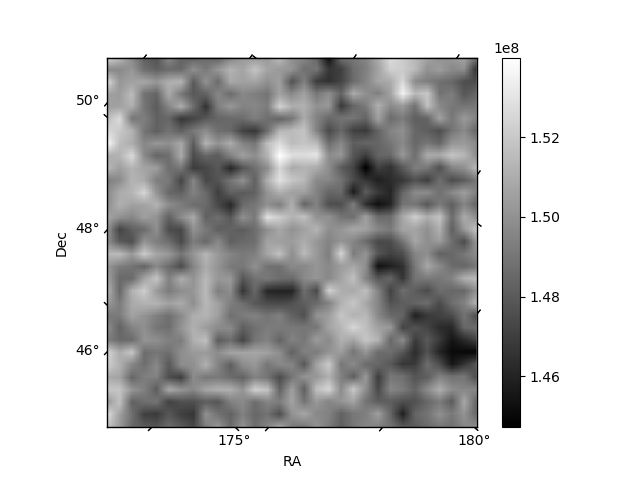
Quadrant B |
|---|---|---|---|
| Quadrant D | 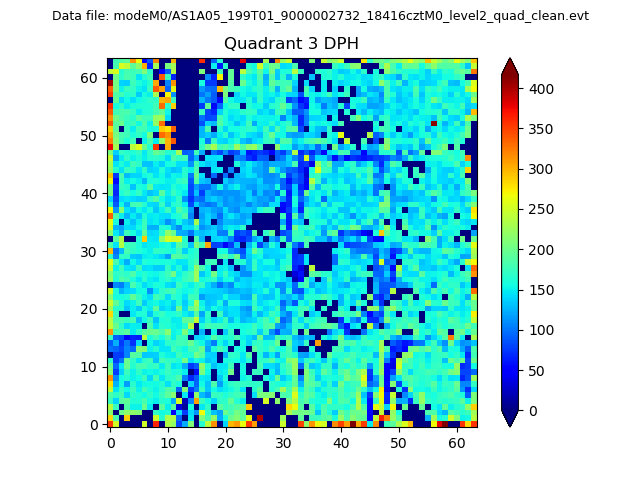 |
 |
Quadrant C |
| Plot type | Count rate plots | Images |
|---|---|---|
| Comparison with Poisson distribution Blue bars denote a histogram of data divided into 1 sec bins. Red curve is a Poisson curve with rate = median count rate of data. |
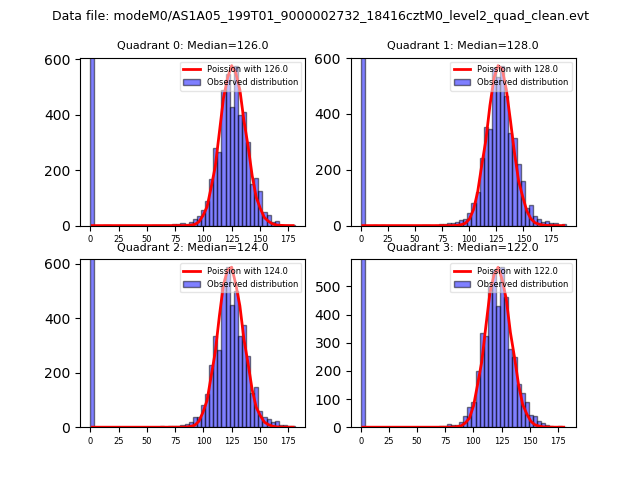 |
 |
| Quadrant-wise count rates Data is divided into 100 sec bins |
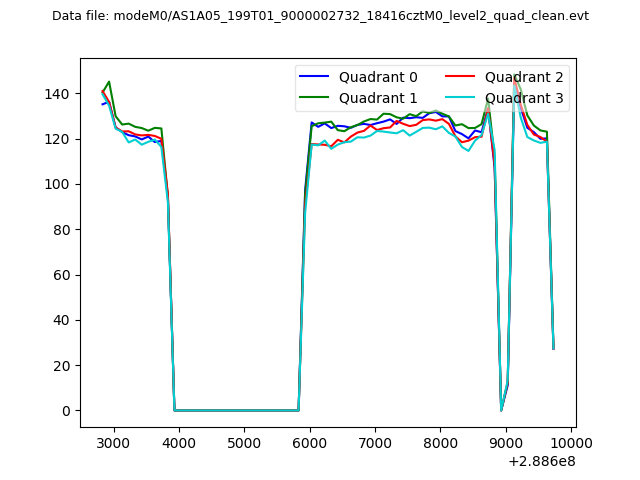 |
|
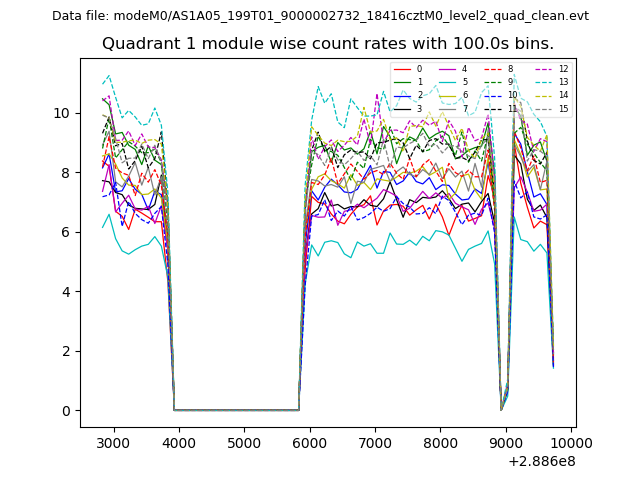
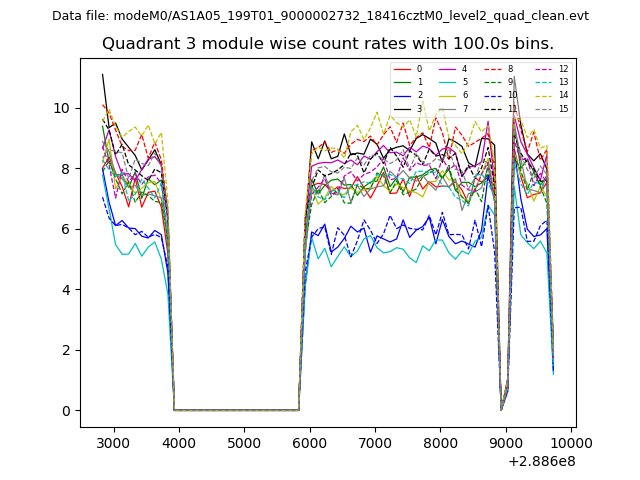
| Module-wise count rates for Quadrant A Data is divided into 100 sec bins |
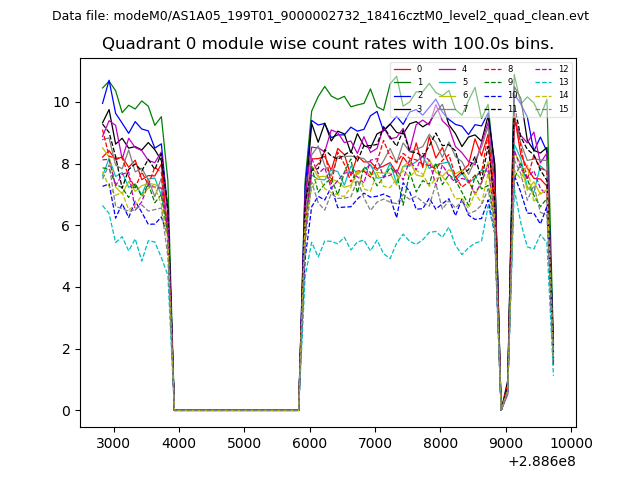 |
 |
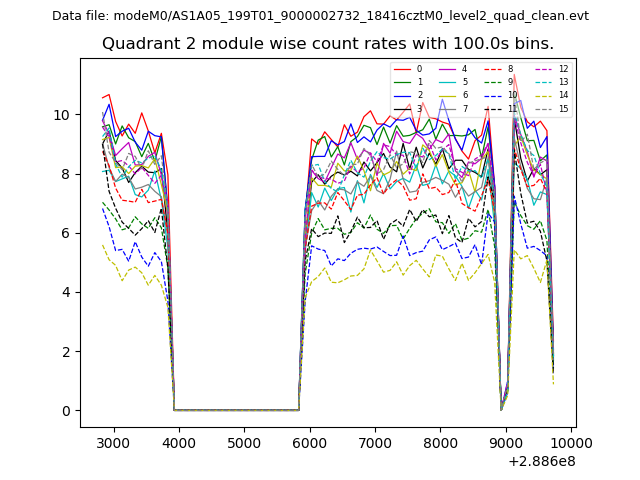
| Module-wise count rates for Quadrant B Data is divided into 100 sec bins |
 |
 |
| Module-wise count rates for Quadrant C Data is divided into 100 sec bins |
 |
 |
| Module-wise count rates for Quadrant D Data is divided into 100 sec bins |
 |
 |
| Parameter | Plot |
|---|---|
| CZT HV Monitor | 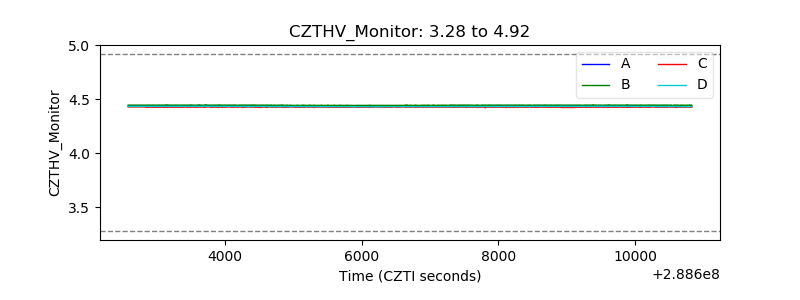 |
| D_VDD | 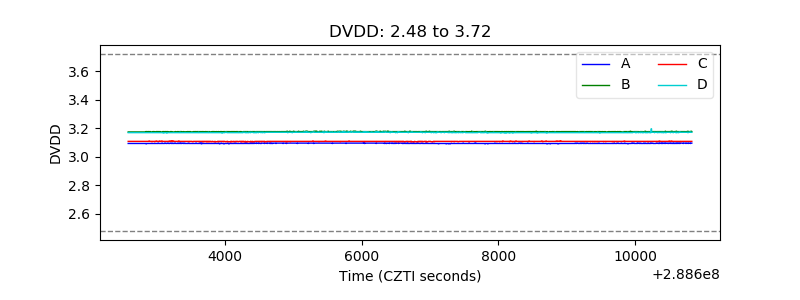 |
| Temperature 1 | 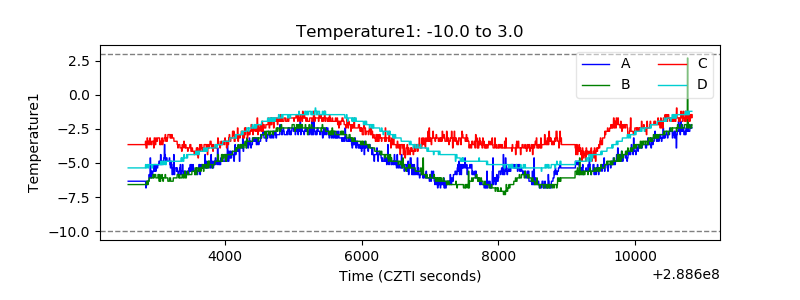 |
| Veto HV Monitor | 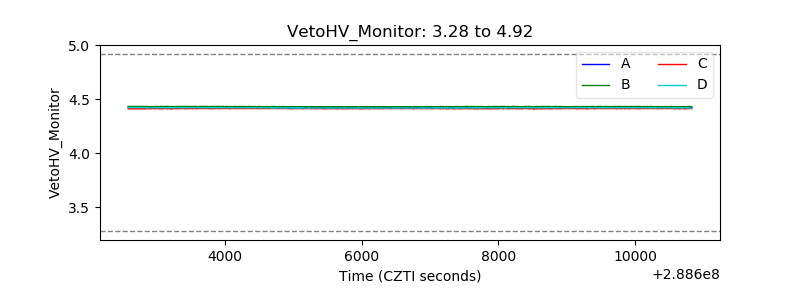 |
| Veto LLD | 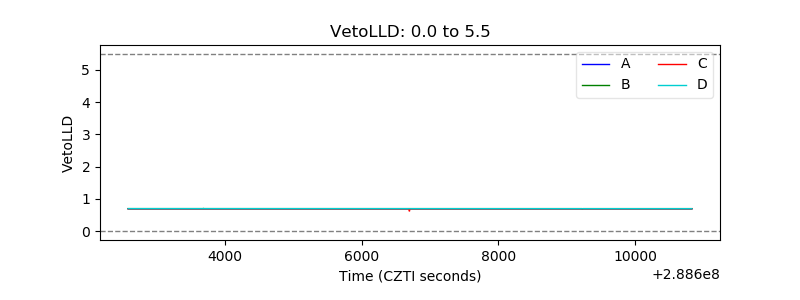 |
| Alpha Counter | 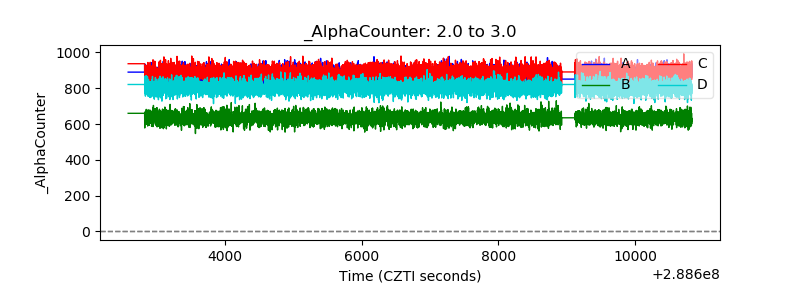 |
| _CPM_Rate | 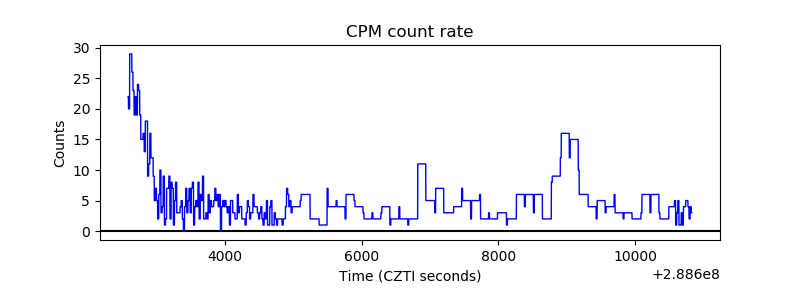 |
| CZT Counter | 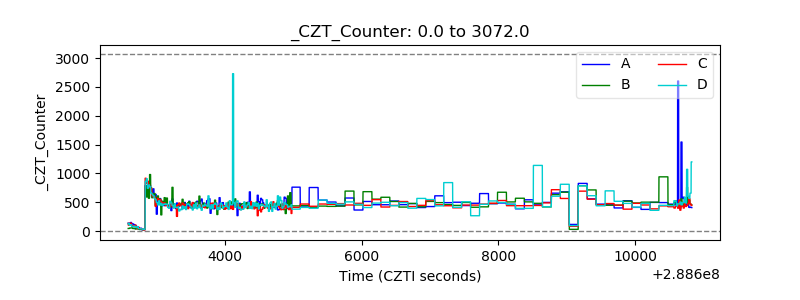 |
| +2.5 Volts monitor | 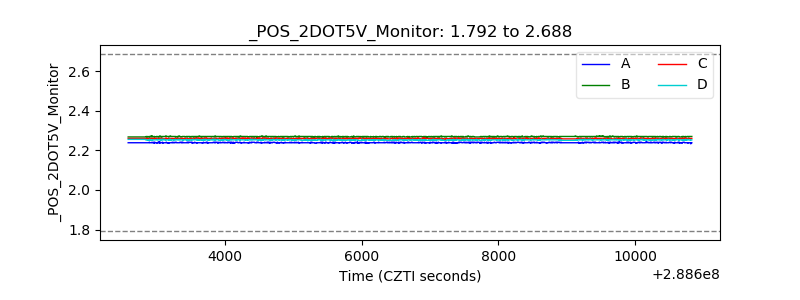 |
| +5 Volts monitor |  |
| _ROLL_ROT | 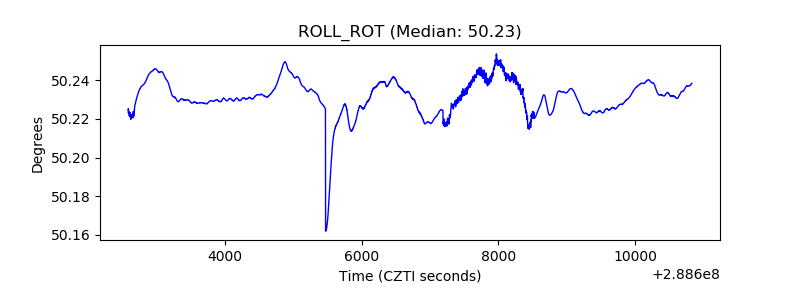 |
| _Roll_DEC | 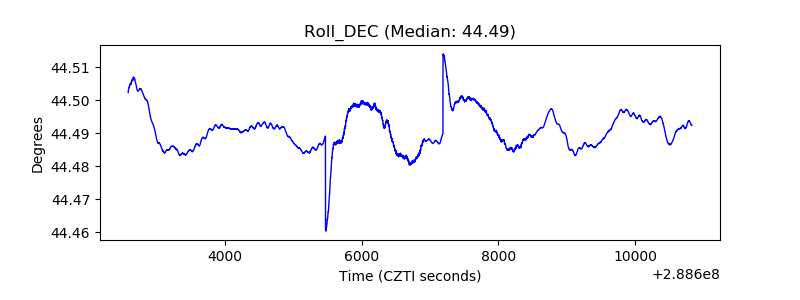 |
| _Roll_RA | 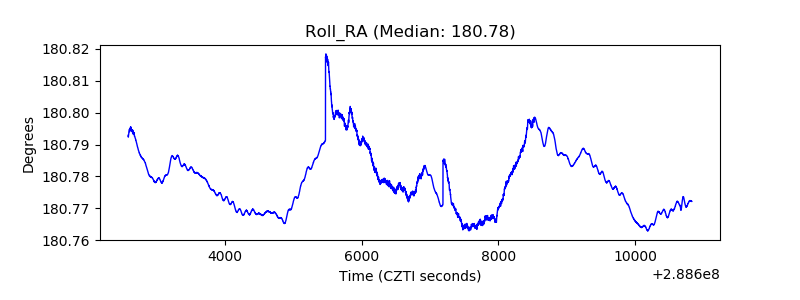 |
| Veto Counter | 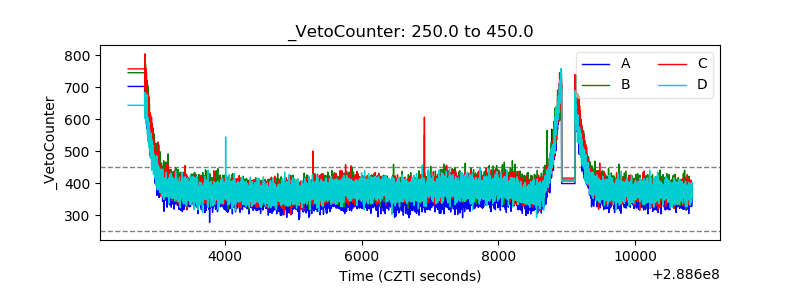 |