| Param | Original file | Final file |
|---|---|---|
| Filename | modeM0/AS1A05_199T01_9000002732_18420cztM0_level2.evt | modeM0/AS1A05_199T01_9000002732_18420cztM0_level2_quad_clean.evt |
| Size (bytes) | 1,323,109,440 | 238,613,760 |
| Size | 1.2 GB | 227.6 MB |
| Events in quadrant A | 8,870,408 | 1,508,214 |
| Events in quadrant B | 8,920,963 | 1,534,725 |
| Events in quadrant C | 8,740,184 | 1,476,704 |
| Events in quadrant D | 12,283,057 | 1,427,408 |
| Mode M0 | |||
|---|---|---|---|
| Quadrant | BADHDUFLAG | Total packets | Discarded packets |
| A | 0 | 38751 | 5 |
| B | 0 | 38655 | 5 |
| C | 0 | 38104 | 5 |
| D | 0 | 48821 | 5 |
| Mode SS | |||
|---|---|---|---|
| Quadrant | BADHDUFLAG | Total packets | Discarded packets |
| A | 0 | 380 | 0 |
| B | 0 | 380 | 0 |
| C | 0 | 380 | 0 |
| D | 0 | 380 | 0 |
| Mode M9 | |||
|---|---|---|---|
| Quadrant | BADHDUFLAG | Total packets | Discarded packets |
| A | 0 | 25 | 0 |
| B | 0 | 25 | 0 |
| C | 0 | 25 | 0 |
| D | 0 | 25 | 0 |
| Quadrant | Total seconds | Saturated seconds | Saturation percentage |
|---|---|---|---|
| A | 18571 | 326 | 1.755425% |
| B | 18572 | 341 | 1.836097% |
| C | 18572 | 374 | 2.013784% |
| D | 18572 | 1037 | 5.583674% |
Noise dominated data is calculated using 1-second bins in cleaned event files. If a bin has >2000 counts, and if more than 50% of those come from <1% of pixels, then it is considered to be noise-dominated and hence unusable.
| Quadrant | # 1 sec bins | Bins with >0 counts | Bins with >2000 counts | High rate bins dominated by noise | Noise dominated (total time) | Noise dominated (detector-on time) | Marked lightcurve |
|---|---|---|---|---|---|---|---|
| A | 21051 | 18576 | 19 | 19 | 0.09% | 0.10% | 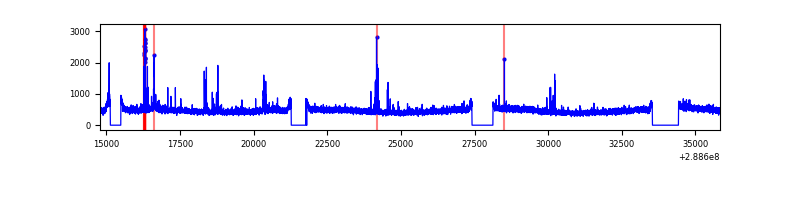 |
| B | 21052 | 18577 | 3 | 3 | 0.01% | 0.02% | 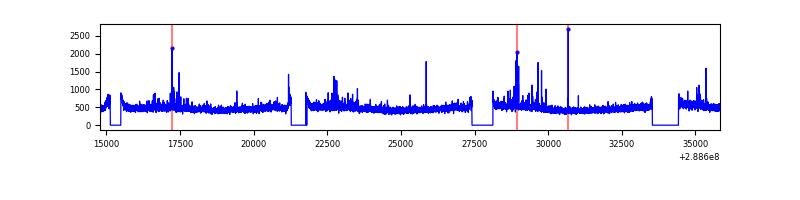 |
| C | 21052 | 18577 | 0 | 0 | 0.00% | 0.00% | 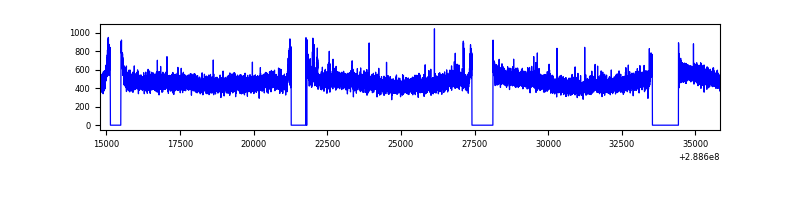 |
| D | 21052 | 18577 | 539 | 539 | 2.56% | 2.90% | 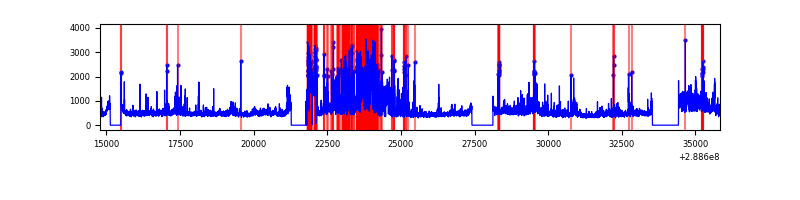 |
Top three noisy pixels from each quadrant. If the there are fewer than three noisy pixels in the level2.evt file, extra rows are filled as -1
| Pixel properties | Quadrant properties | ||||||
|---|---|---|---|---|---|---|---|
| Quadrant | DetID | PixID | Counts | Sigma | Mean | Median | Sigma |
| A | 4 | 2 | 217158 | 479.3 | 2226 | 2180 | 448.5 |
| A | 15 | 174 | 100427 | 219.05 | 2226 | 2180 | 448.5 |
| A | 0 | 226 | 18972 | 37.44 | 2226 | 2180 | 448.5 |
| B | 0 | 189 | 119991 | 273.41 | 2230 | 2167 | 430.9 |
| B | 12 | 111 | 51387 | 114.21 | 2230 | 2167 | 430.9 |
| B | 11 | 111 | 44500 | 98.23 | 2230 | 2167 | 430.9 |
| C | 14 | 238 | 329823 | 655.93 | 2138 | 2147 | 499.6 |
| C | 3 | 233 | 71989 | 139.81 | 2138 | 2147 | 499.6 |
| C | 13 | 61 | 15248 | 26.22 | 2138 | 2147 | 499.6 |
| D | 1 | 52 | 2210466 | 4331.81 | 2110 | 2048 | 509.8 |
| D | 8 | 230 | 599465 | 1171.83 | 2110 | 2048 | 509.8 |
| D | 10 | 66 | 533775 | 1042.98 | 2110 | 2048 | 509.8 |
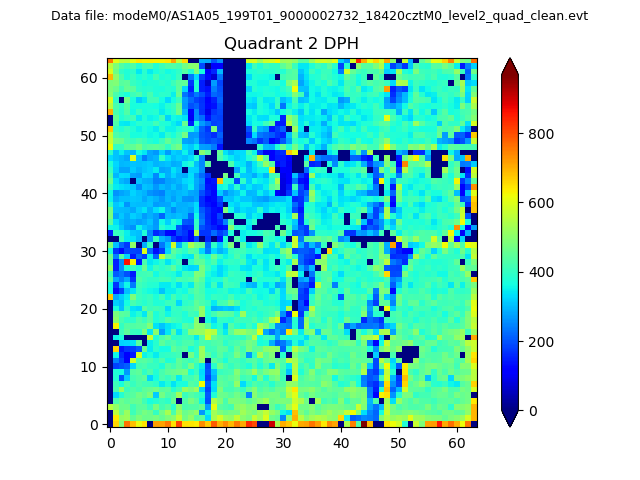
Histogram calculated using DETX and DETY for each event in the final _common_clean file
| Quadrant A | 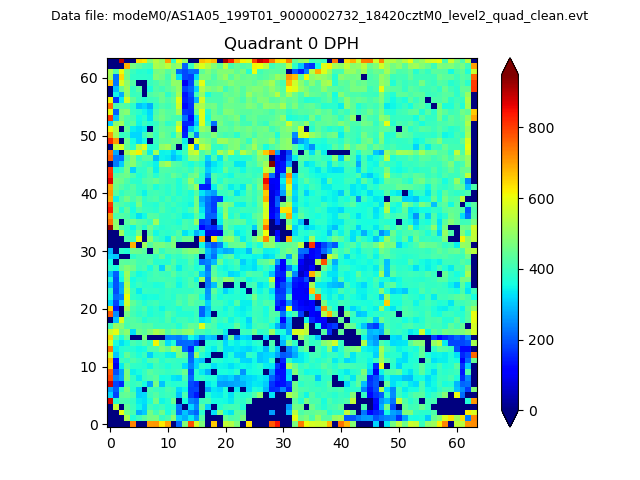 |
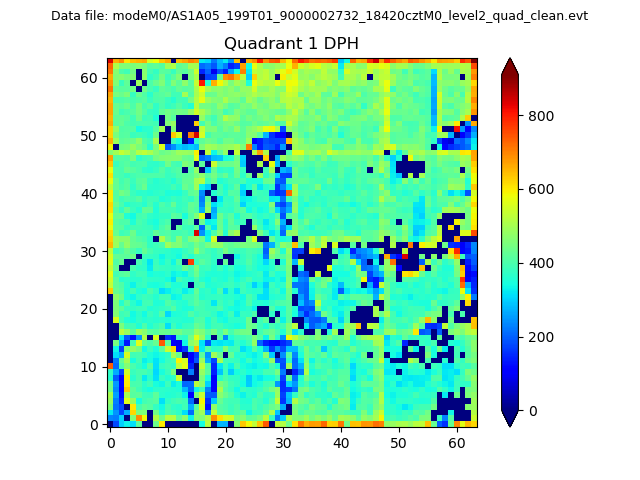 |
Quadrant B |
|---|---|---|---|
| Quadrant D | 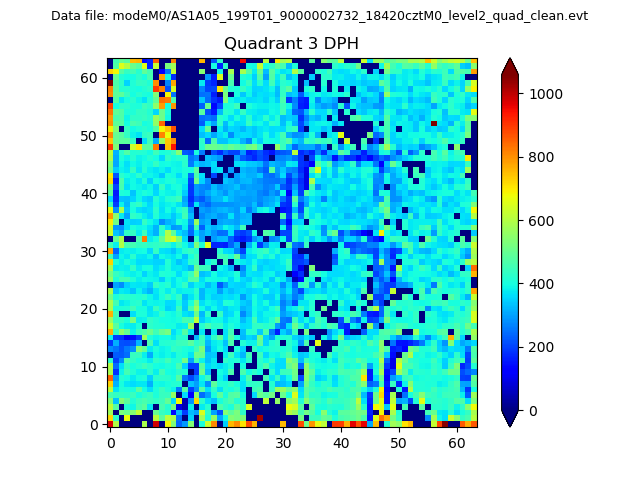 |
 |
Quadrant C |
| Plot type | Count rate plots | Images |
|---|---|---|
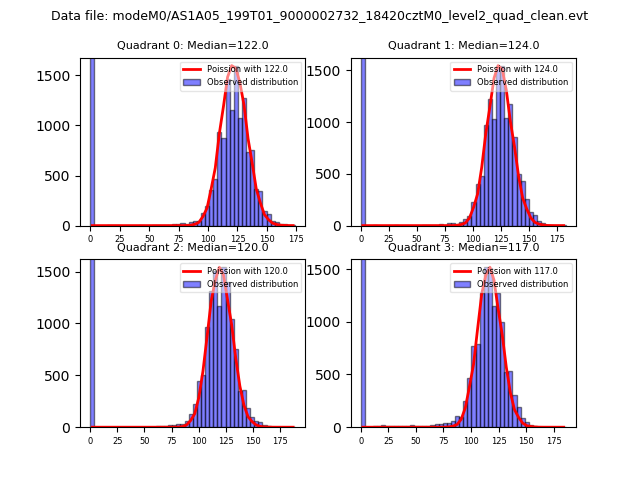
| Comparison with Poisson distribution Blue bars denote a histogram of data divided into 1 sec bins. Red curve is a Poisson curve with rate = median count rate of data. |
 |
 |
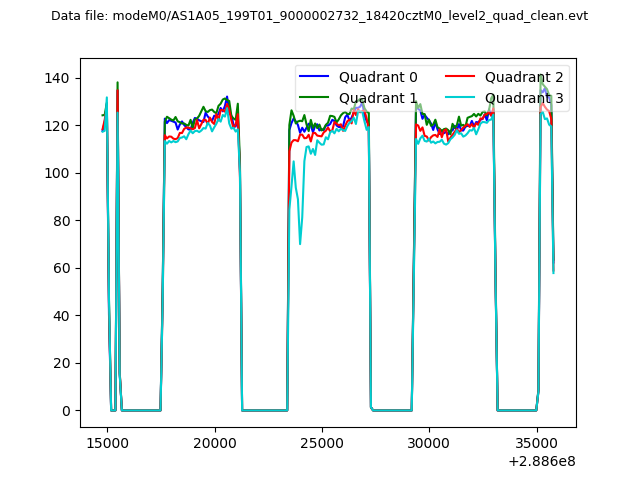
| Quadrant-wise count rates Data is divided into 100 sec bins |
 |
|
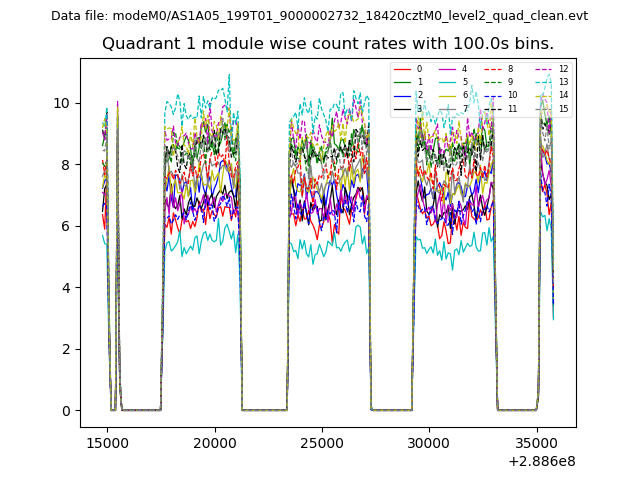
| Module-wise count rates for Quadrant A Data is divided into 100 sec bins |
 |
 |
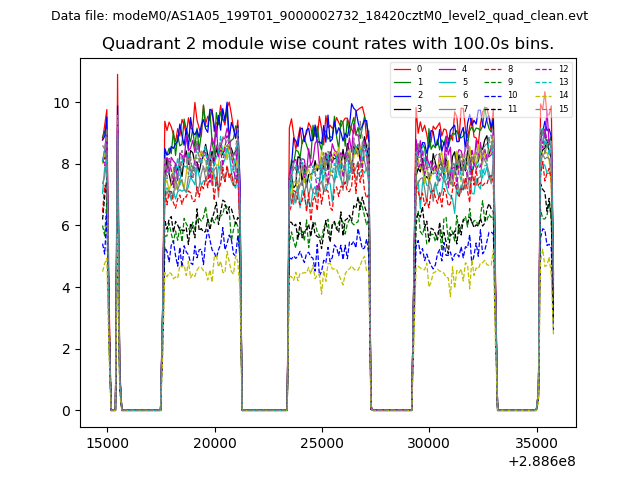
| Module-wise count rates for Quadrant B Data is divided into 100 sec bins |
 |
 |
| Module-wise count rates for Quadrant C Data is divided into 100 sec bins |
 |
 |
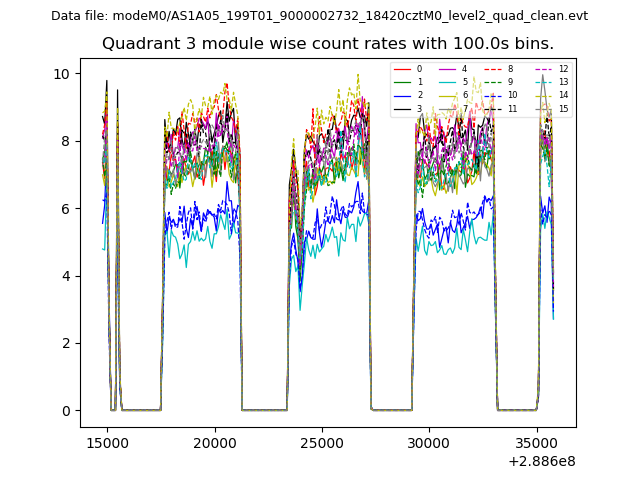
| Module-wise count rates for Quadrant D Data is divided into 100 sec bins |
 |
 |
| Parameter | Plot |
|---|---|
| CZT HV Monitor | 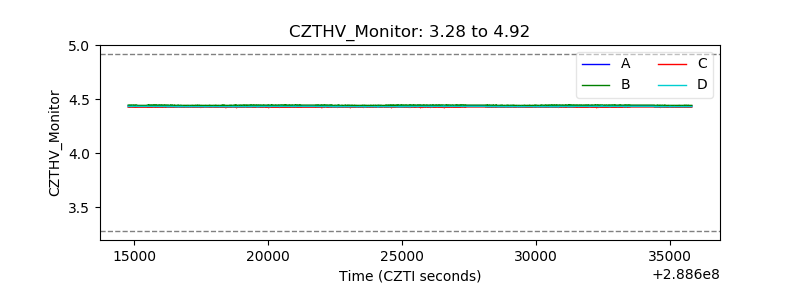 |
| D_VDD | 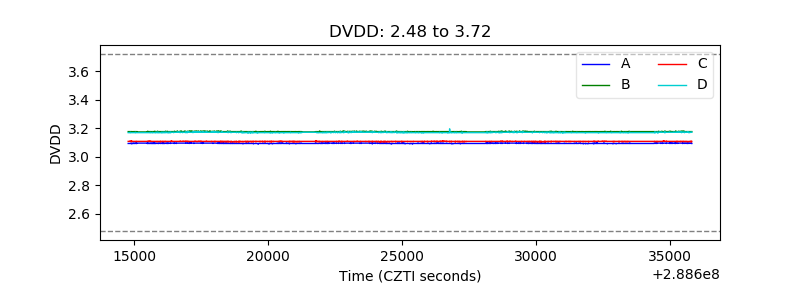 |
| Temperature 1 | 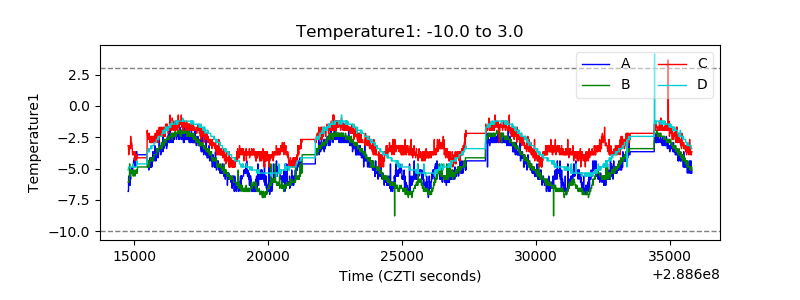 |
| Veto HV Monitor | 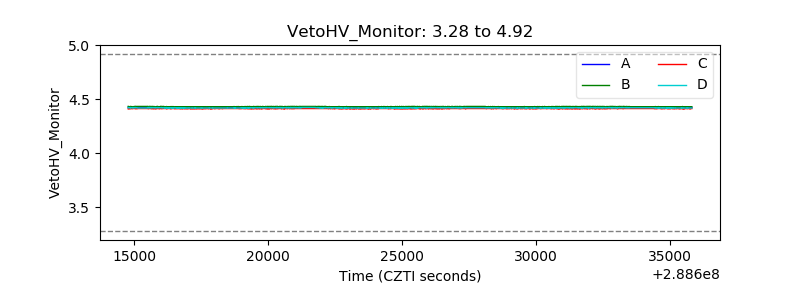 |
| Veto LLD | 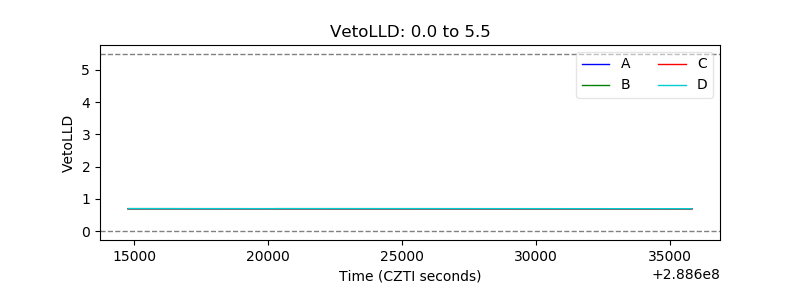 |
| Alpha Counter | 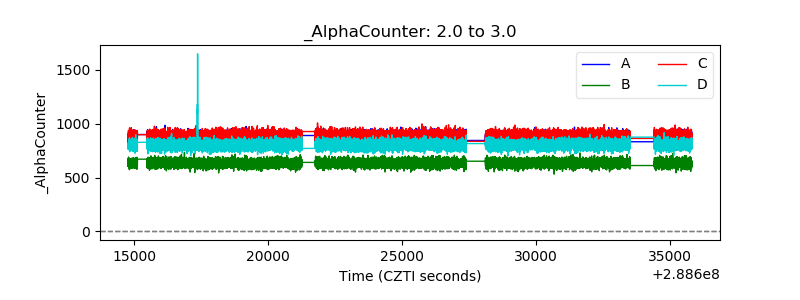 |
| _CPM_Rate | 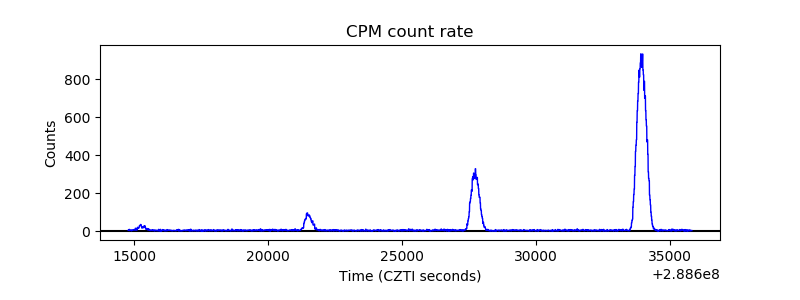 |
| CZT Counter | 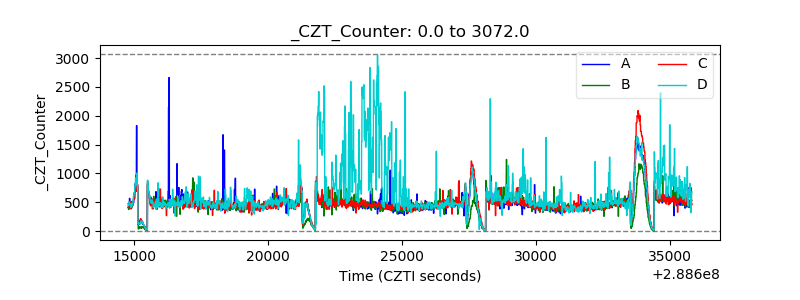 |
| +2.5 Volts monitor |  |
| +5 Volts monitor |  |
| _ROLL_ROT |  |
| _Roll_DEC | 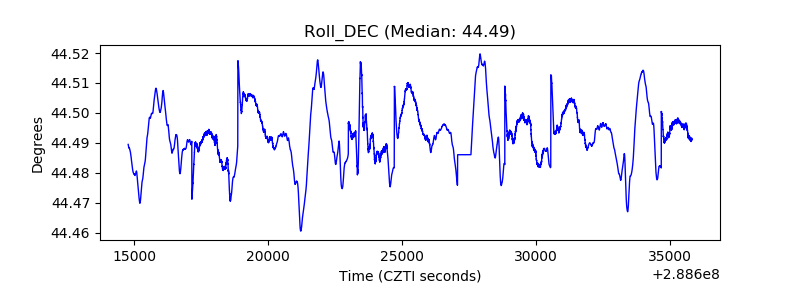 |
| _Roll_RA | 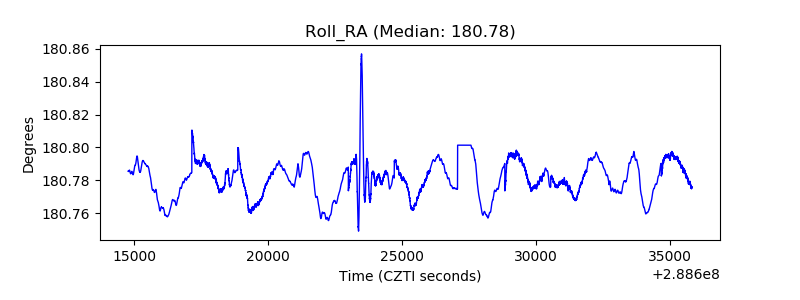 |
| Veto Counter |  |