| Param | Original file | Final file |
|---|---|---|
| Filename | modeM0/AS1A05_199T01_9000002732_18424cztM0_level2.evt | modeM0/AS1A05_199T01_9000002732_18424cztM0_level2_quad_clean.evt |
| Size (bytes) | 458,651,520 | 110,010,240 |
| Size | 437.4 MB | 104.9 MB |
| Events in quadrant A | 3,161,541 | 723,495 |
| Events in quadrant B | 3,219,284 | 750,968 |
| Events in quadrant C | 3,245,214 | 726,553 |
| Events in quadrant D | 3,836,897 | 691,607 |
| Mode M0 | |||
|---|---|---|---|
| Quadrant | BADHDUFLAG | Total packets | Discarded packets |
| A | 0 | 13573 | 2 |
| B | 0 | 13705 | 3 |
| C | 0 | 13789 | 2 |
| D | 0 | 15657 | 2 |
| Mode SS | |||
|---|---|---|---|
| Quadrant | BADHDUFLAG | Total packets | Discarded packets |
| A | 0 | 128 | 0 |
| B | 0 | 128 | 0 |
| C | 0 | 128 | 0 |
| D | 0 | 128 | 0 |
| Mode M9 | |||
|---|---|---|---|
| Quadrant | BADHDUFLAG | Total packets | Discarded packets |
| A | 0 | 13 | 0 |
| B | 0 | 14 | 0 |
| C | 0 | 14 | 0 |
| D | 0 | 14 | 0 |
| Quadrant | Total seconds | Saturated seconds | Saturation percentage |
|---|---|---|---|
| A | 6294 | 68 | 1.080394% |
| B | 6293 | 41 | 0.651518% |
| C | 6293 | 92 | 1.461942% |
| D | 6293 | 80 | 1.271254% |
Noise dominated data is calculated using 1-second bins in cleaned event files. If a bin has >2000 counts, and if more than 50% of those come from <1% of pixels, then it is considered to be noise-dominated and hence unusable.
| Quadrant | # 1 sec bins | Bins with >0 counts | Bins with >2000 counts | High rate bins dominated by noise | Noise dominated (total time) | Noise dominated (detector-on time) | Marked lightcurve |
|---|---|---|---|---|---|---|---|
| A | 7549 | 6295 | 13 | 13 | 0.17% | 0.21% | 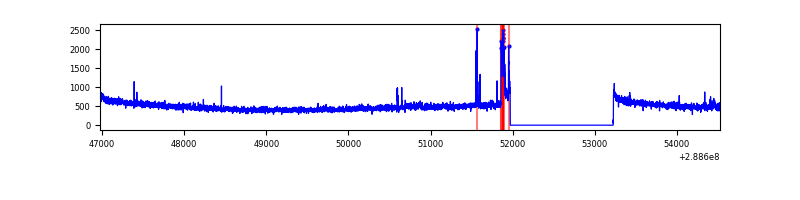 |
| B | 7548 | 6294 | 1 | 1 | 0.01% | 0.02% | 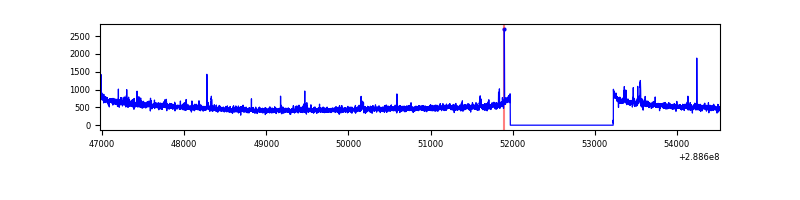 |
| C | 7548 | 6294 | 10 | 10 | 0.13% | 0.16% | 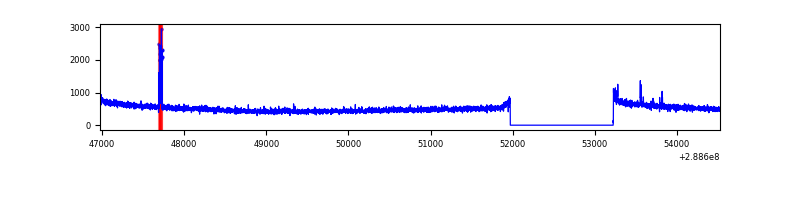 |
| D | 7548 | 6294 | 34 | 34 | 0.45% | 0.54% | 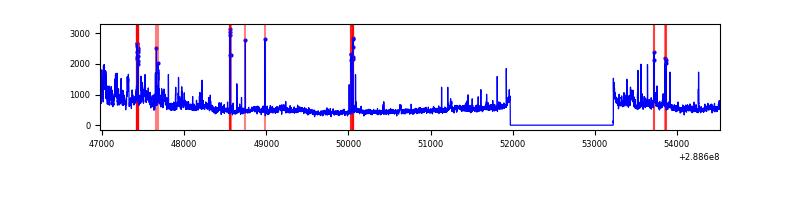 |
Top three noisy pixels from each quadrant. If the there are fewer than three noisy pixels in the level2.evt file, extra rows are filled as -1
| Pixel properties | Quadrant properties | ||||||
|---|---|---|---|---|---|---|---|
| Quadrant | DetID | PixID | Counts | Sigma | Mean | Median | Sigma |
| A | 15 | 174 | 82535 | 519.03 | 791 | 777 | 157.5 |
| A | 3 | 254 | 31038 | 192.11 | 791 | 777 | 157.5 |
| A | 0 | 226 | 6945 | 39.16 | 791 | 777 | 157.5 |
| B | 0 | 189 | 19718 | 124.27 | 807 | 787 | 152.3 |
| B | 12 | 111 | 17194 | 107.71 | 807 | 787 | 152.3 |
| B | 15 | 33 | 16511 | 103.22 | 807 | 787 | 152.3 |
| C | 14 | 238 | 124018 | 678.23 | 783 | 789 | 181.7 |
| C | 9 | 54 | 47167 | 255.25 | 783 | 789 | 181.7 |
| C | 3 | 233 | 22396 | 118.92 | 783 | 789 | 181.7 |
| D | 12 | 110 | 377951 | 2000.21 | 778 | 756 | 188.6 |
| D | 8 | 230 | 263337 | 1392.43 | 778 | 756 | 188.6 |
| D | 1 | 52 | 131120 | 691.3 | 778 | 756 | 188.6 |
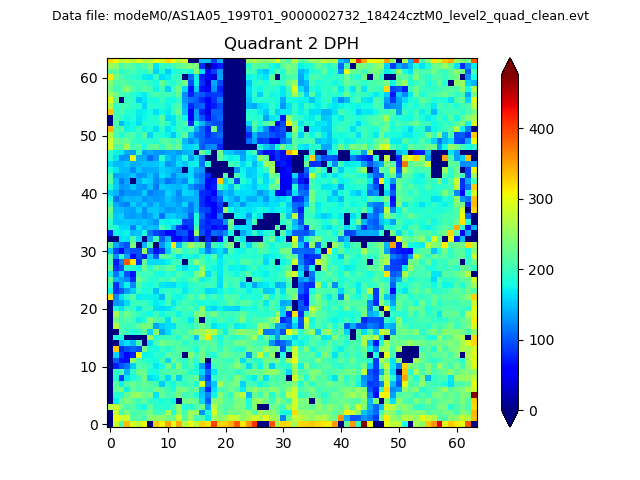
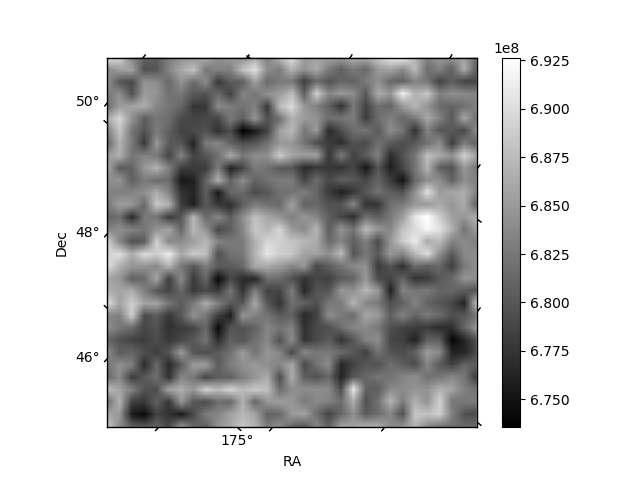
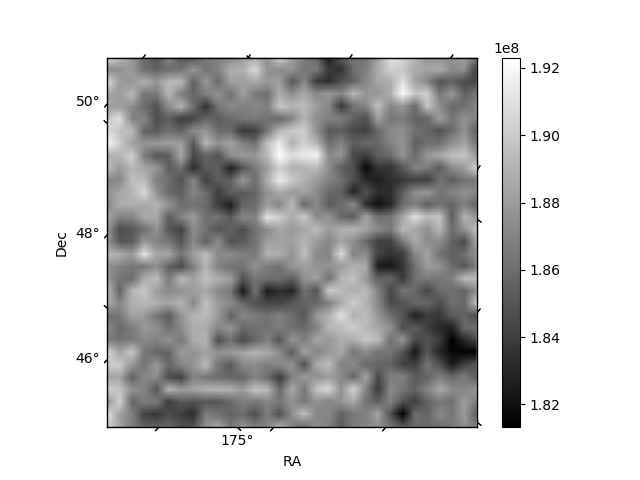
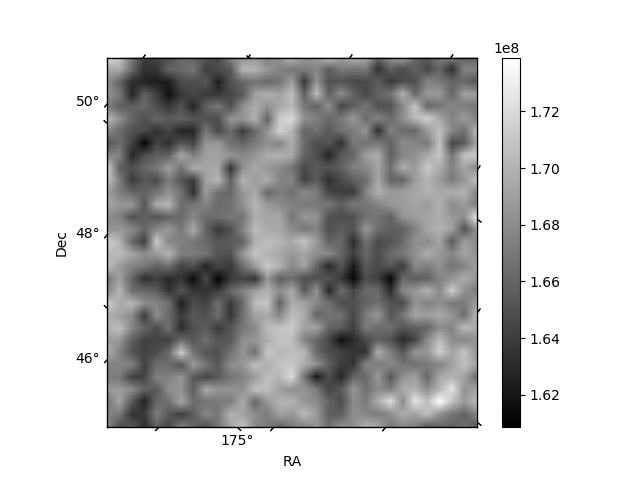
Histogram calculated using DETX and DETY for each event in the final _common_clean file
| Quadrant A | 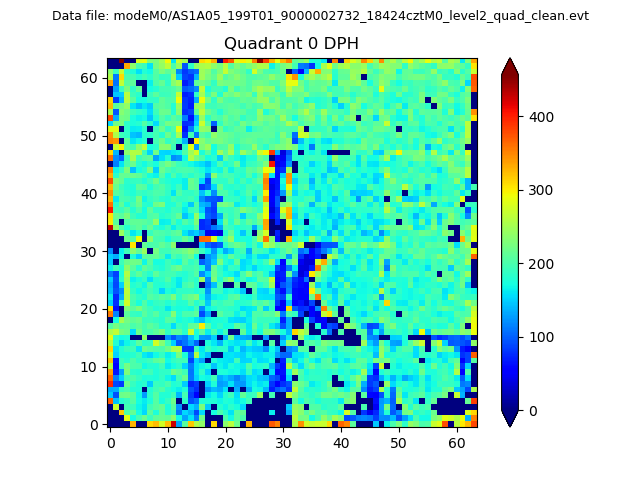 |
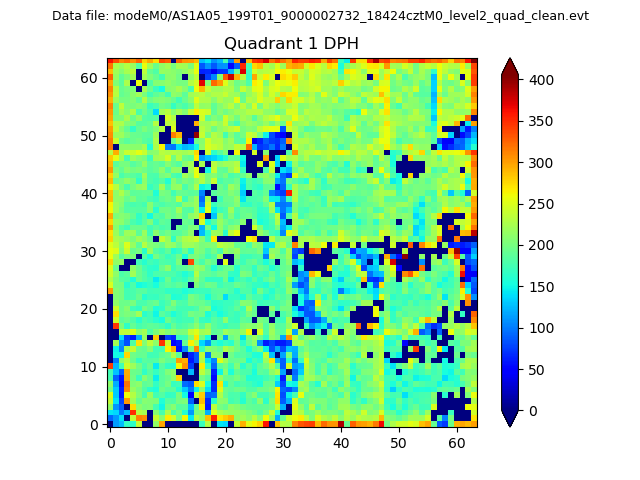 |
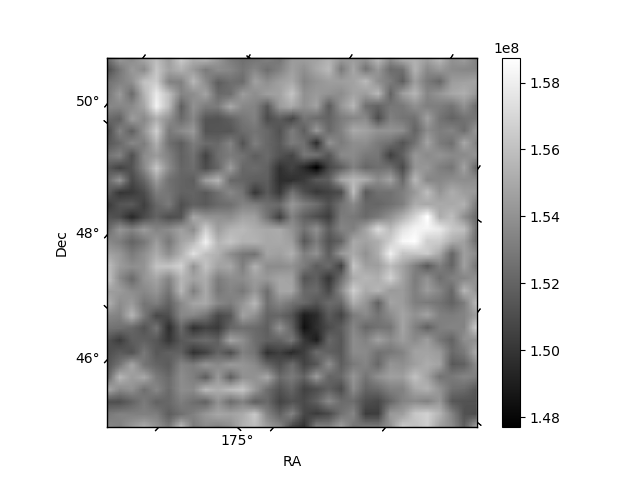
Quadrant B |
|---|---|---|---|
| Quadrant D | 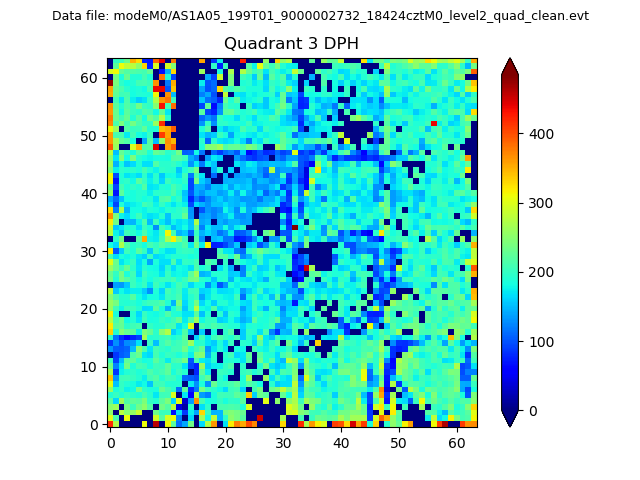 |
 |
Quadrant C |
| Plot type | Count rate plots | Images |
|---|---|---|
| Comparison with Poisson distribution Blue bars denote a histogram of data divided into 1 sec bins. Red curve is a Poisson curve with rate = median count rate of data. |
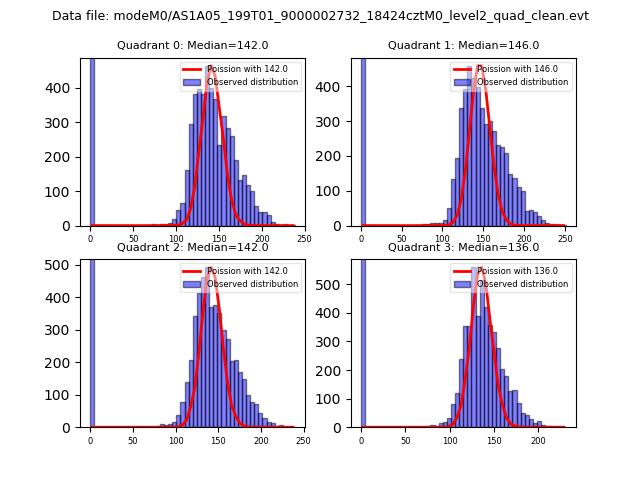 |
 |
| Quadrant-wise count rates Data is divided into 100 sec bins |
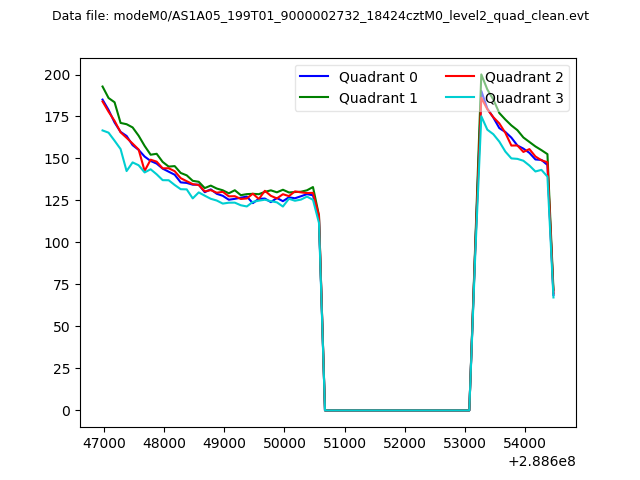 |
|
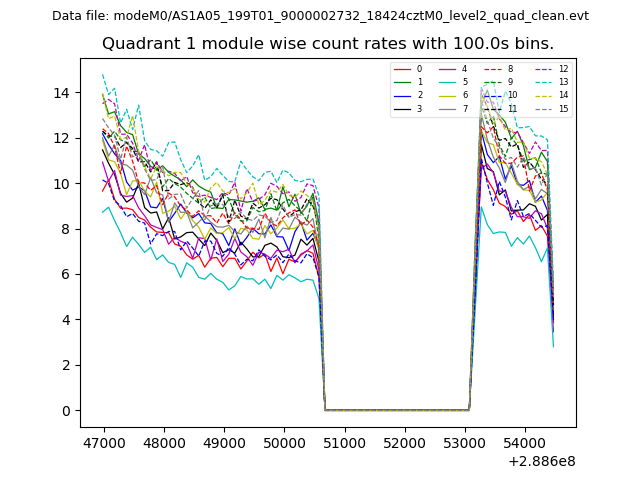
| Module-wise count rates for Quadrant A Data is divided into 100 sec bins |
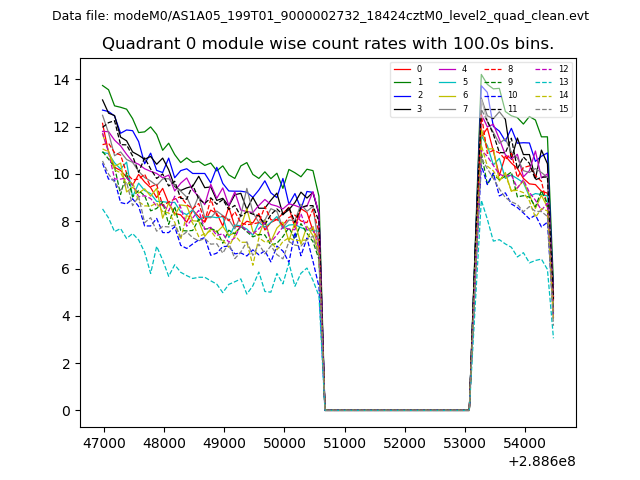 |
 |
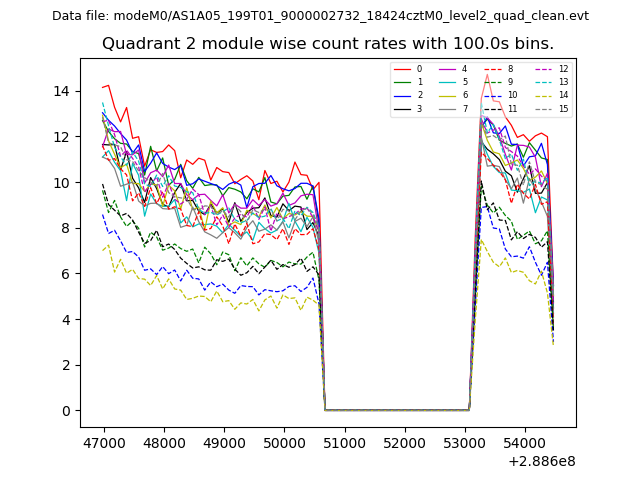
| Module-wise count rates for Quadrant B Data is divided into 100 sec bins |
 |
 |
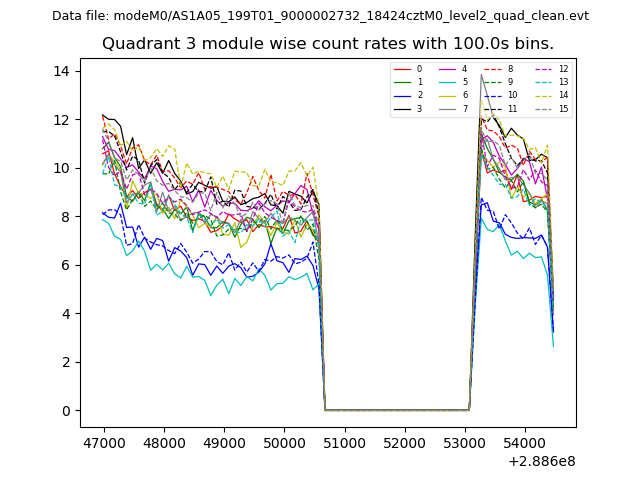
| Module-wise count rates for Quadrant C Data is divided into 100 sec bins |
 |
 |
| Module-wise count rates for Quadrant D Data is divided into 100 sec bins |
 |
 |
| Parameter | Plot |
|---|---|
| CZT HV Monitor | 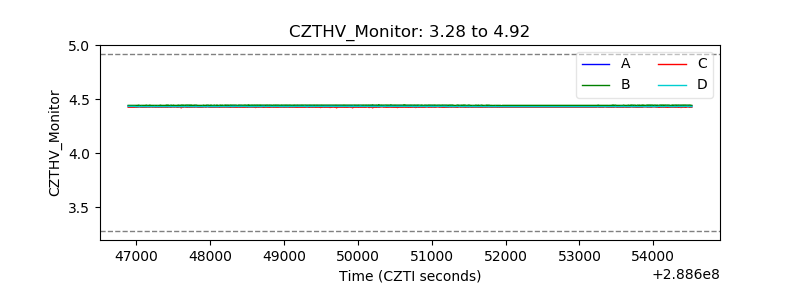 |
| D_VDD |  |
| Temperature 1 | 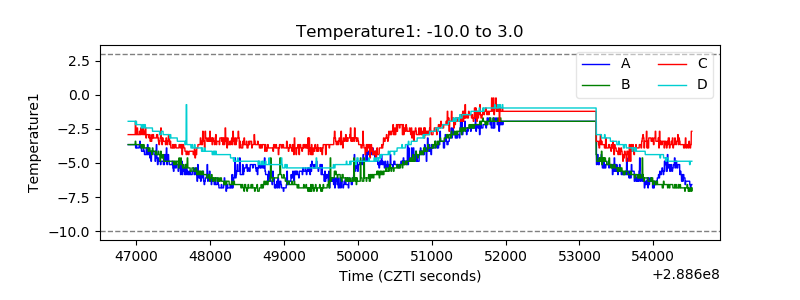 |
| Veto HV Monitor | 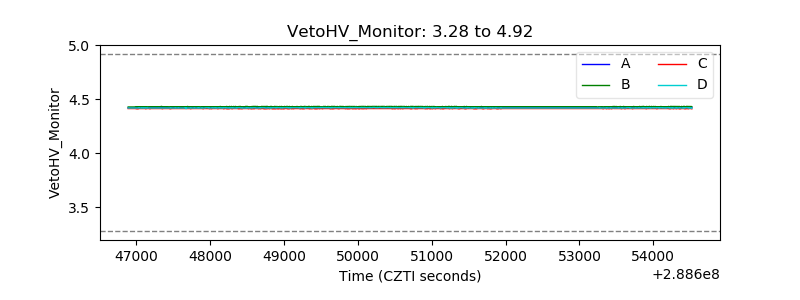 |
| Veto LLD | 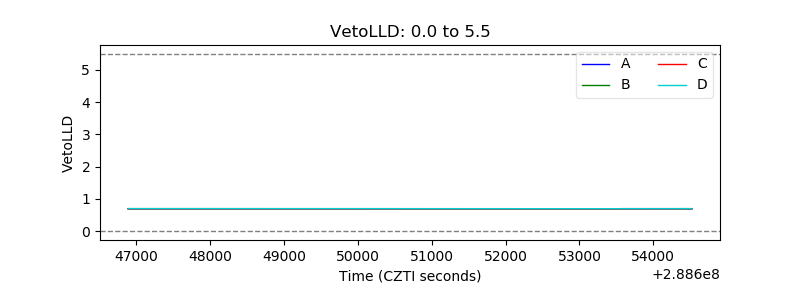 |
| Alpha Counter | 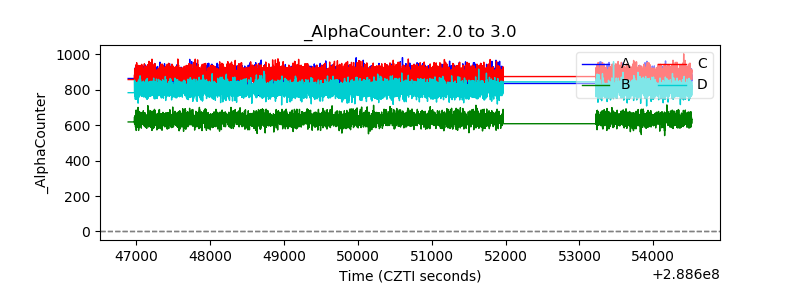 |
| _CPM_Rate | 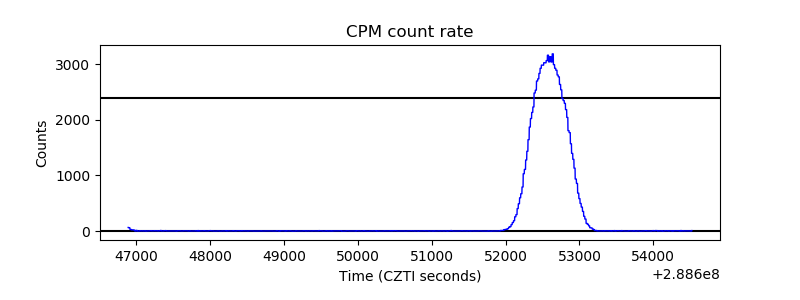 |
| CZT Counter | 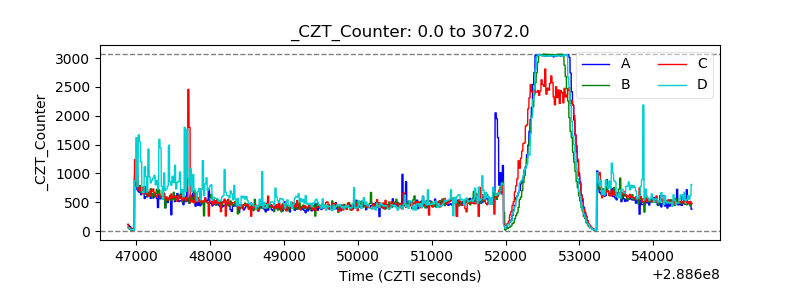 |
| +2.5 Volts monitor | 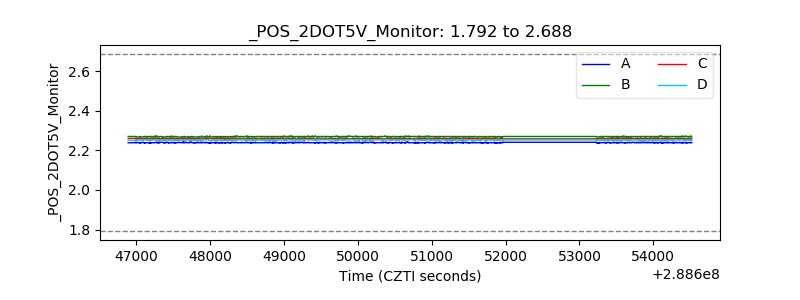 |
| +5 Volts monitor |  |
| _ROLL_ROT | 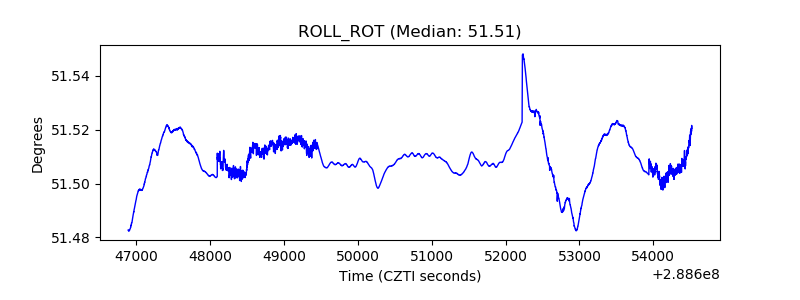 |
| _Roll_DEC | 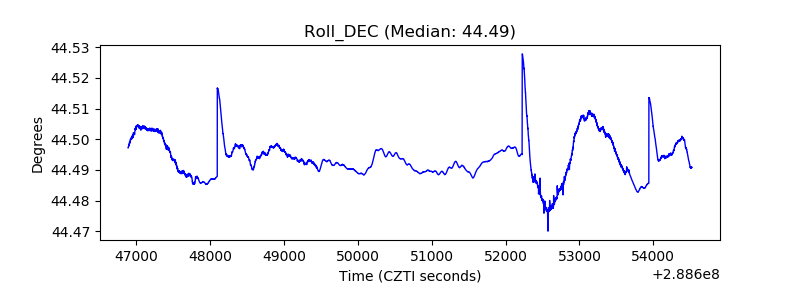 |
| _Roll_RA | 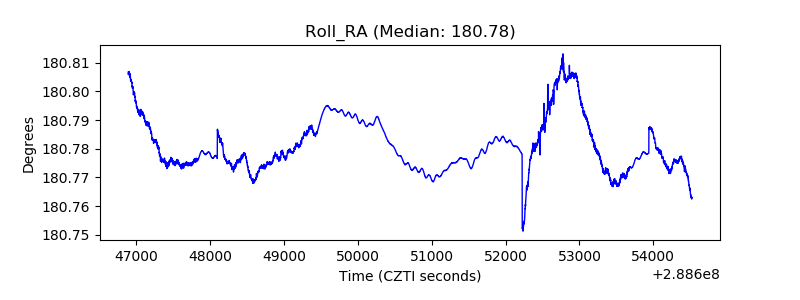 |
| Veto Counter | 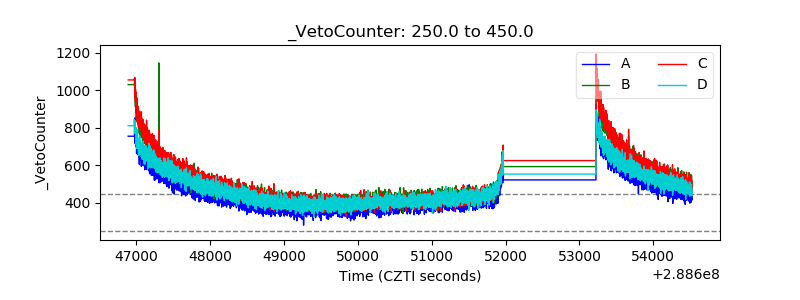 |