| Param | Original file | Final file |
|---|---|---|
| Filename | modeM0/AS1A05_199T01_9000002732_18425cztM0_level2.evt | modeM0/AS1A05_199T01_9000002732_18425cztM0_level2_quad_clean.evt |
| Size (bytes) | 447,531,840 | 101,940,480 |
| Size | 426.8 MB | 97.2 MB |
| Events in quadrant A | 3,021,823 | 665,061 |
| Events in quadrant B | 3,137,256 | 694,280 |
| Events in quadrant C | 3,211,621 | 668,879 |
| Events in quadrant D | 3,768,186 | 632,981 |
| Mode M0 | |||
|---|---|---|---|
| Quadrant | BADHDUFLAG | Total packets | Discarded packets |
| A | 0 | 12878 | 2 |
| B | 0 | 13211 | 2 |
| C | 0 | 13442 | 2 |
| D | 0 | 15171 | 2 |
| Mode SS | |||
|---|---|---|---|
| Quadrant | BADHDUFLAG | Total packets | Discarded packets |
| A | 0 | 124 | 0 |
| B | 0 | 124 | 0 |
| C | 0 | 124 | 0 |
| D | 0 | 124 | 0 |
| Mode M9 | |||
|---|---|---|---|
| Quadrant | BADHDUFLAG | Total packets | Discarded packets |
| A | 0 | 22 | 0 |
| B | 0 | 23 | 0 |
| C | 0 | 23 | 0 |
| D | 0 | 23 | 0 |
| Quadrant | Total seconds | Saturated seconds | Saturation percentage |
|---|---|---|---|
| A | 6104 | 11 | 0.180210% |
| B | 6104 | 36 | 0.589777% |
| C | 6104 | 89 | 1.458060% |
| D | 6104 | 127 | 2.080603% |
Noise dominated data is calculated using 1-second bins in cleaned event files. If a bin has >2000 counts, and if more than 50% of those come from <1% of pixels, then it is considered to be noise-dominated and hence unusable.
| Quadrant | # 1 sec bins | Bins with >0 counts | Bins with >2000 counts | High rate bins dominated by noise | Noise dominated (total time) | Noise dominated (detector-on time) | Marked lightcurve |
|---|---|---|---|---|---|---|---|
| A | 7429 | 6105 | 0 | 0 | 0.00% | 0.00% | 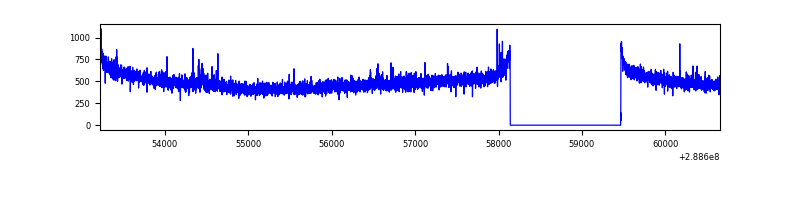 |
| B | 7429 | 6105 | 0 | 0 | 0.00% | 0.00% | 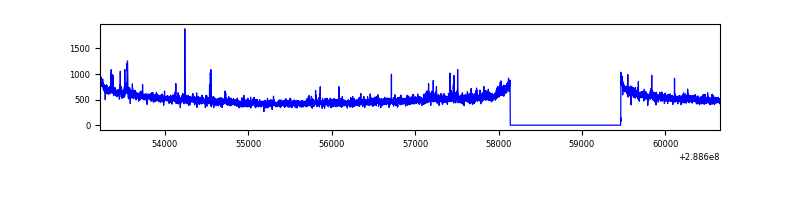 |
| C | 7429 | 6105 | 5 | 5 | 0.07% | 0.08% | 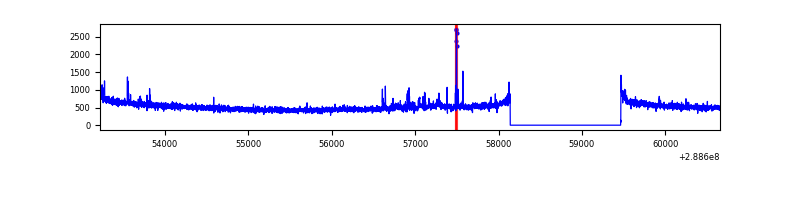 |
| D | 7429 | 6105 | 64 | 64 | 0.86% | 1.05% | 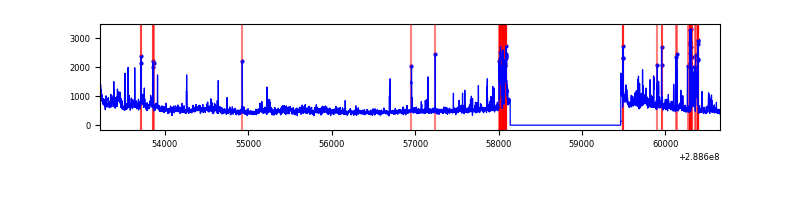 |
Top three noisy pixels from each quadrant. If the there are fewer than three noisy pixels in the level2.evt file, extra rows are filled as -1
| Pixel properties | Quadrant properties | ||||||
|---|---|---|---|---|---|---|---|
| Quadrant | DetID | PixID | Counts | Sigma | Mean | Median | Sigma |
| A | 15 | 174 | 24149 | 150.5 | 776 | 762 | 155.4 |
| A | 3 | 254 | 8768 | 51.52 | 776 | 762 | 155.4 |
| A | 4 | 2 | 7104 | 40.81 | 776 | 762 | 155.4 |
| B | 0 | 189 | 21037 | 137.54 | 790 | 773 | 147.3 |
| B | 12 | 111 | 16682 | 107.98 | 790 | 773 | 147.3 |
| B | 11 | 111 | 14434 | 92.72 | 790 | 773 | 147.3 |
| C | 14 | 238 | 121450 | 684.02 | 762 | 768 | 176.4 |
| C | 9 | 54 | 71011 | 398.13 | 762 | 768 | 176.4 |
| C | 3 | 233 | 50723 | 283.14 | 762 | 768 | 176.4 |
| D | 12 | 110 | 296937 | 1651.49 | 750 | 728 | 179.4 |
| D | 1 | 52 | 221798 | 1232.56 | 750 | 728 | 179.4 |
| D | 8 | 230 | 130891 | 725.71 | 750 | 728 | 179.4 |
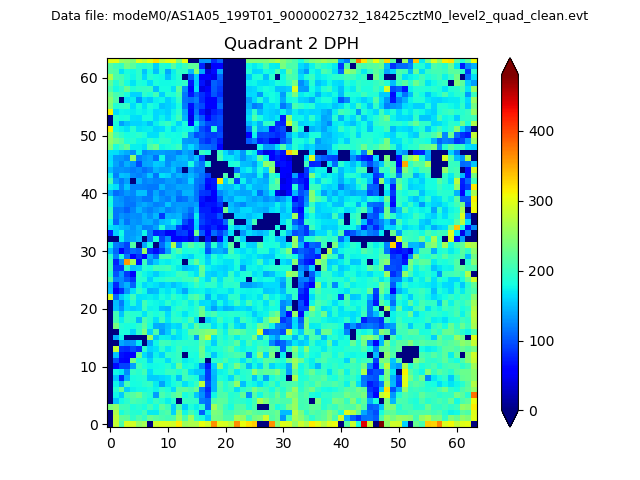
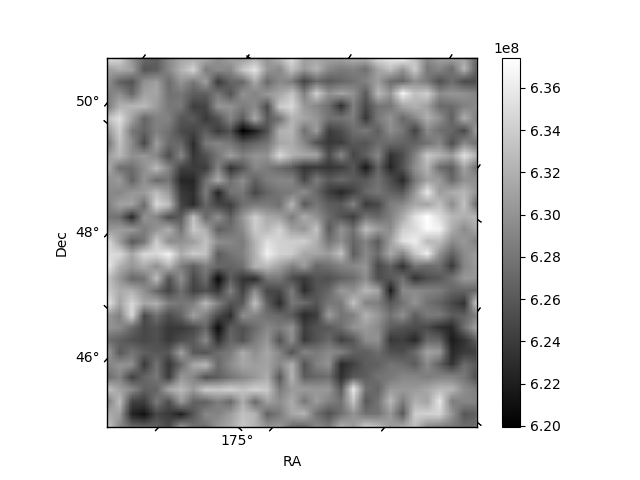
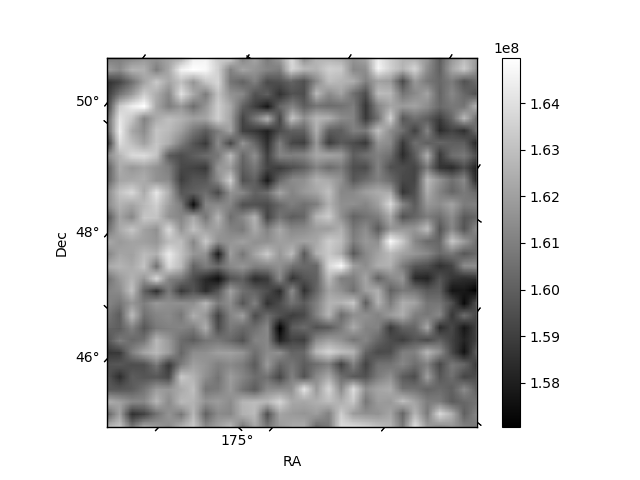
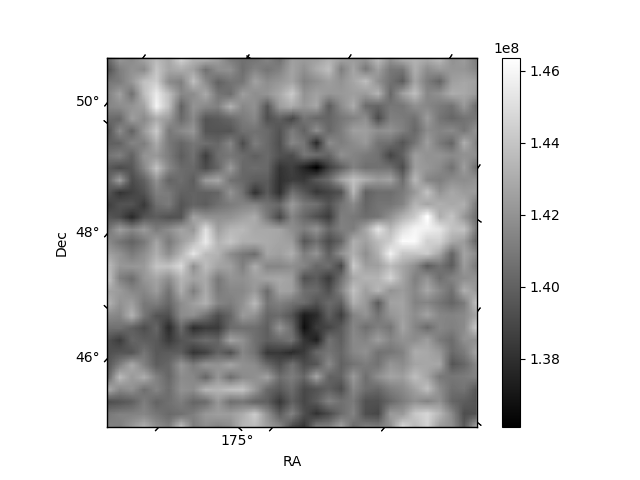
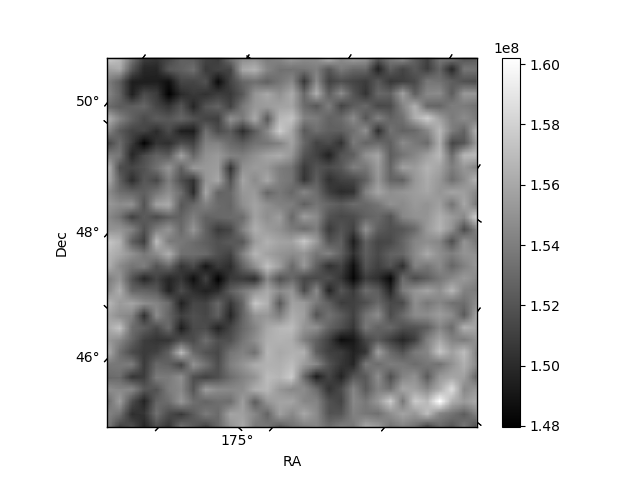
Histogram calculated using DETX and DETY for each event in the final _common_clean file
| Quadrant A | 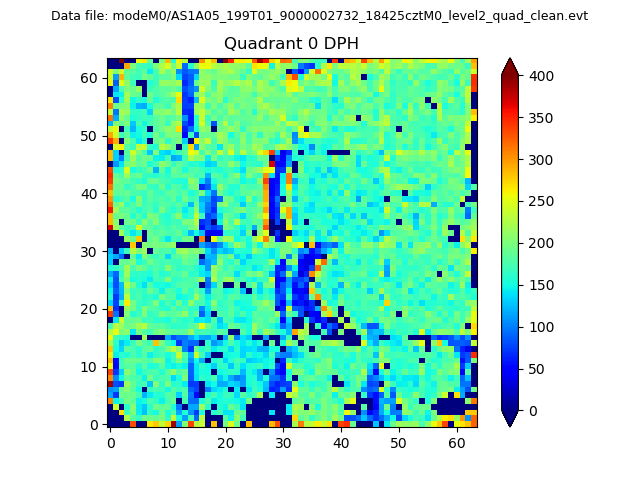 |
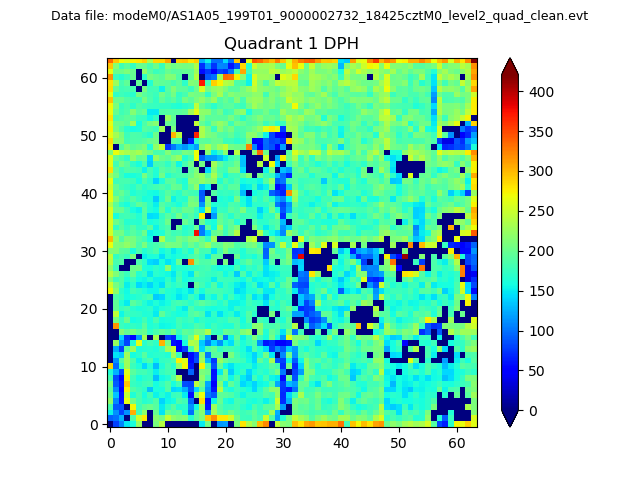 |
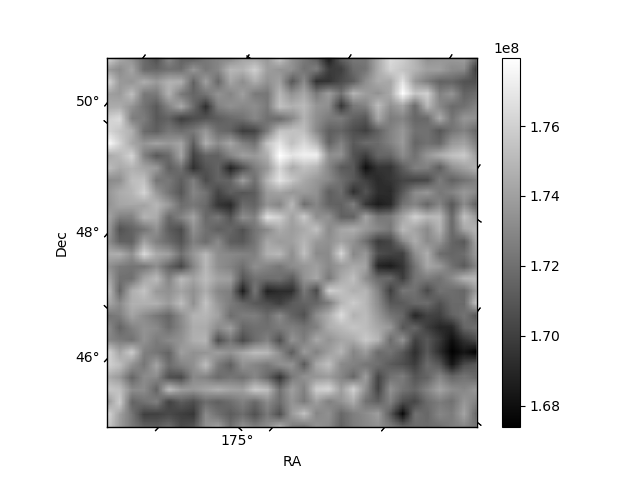
Quadrant B |
|---|---|---|---|
| Quadrant D | 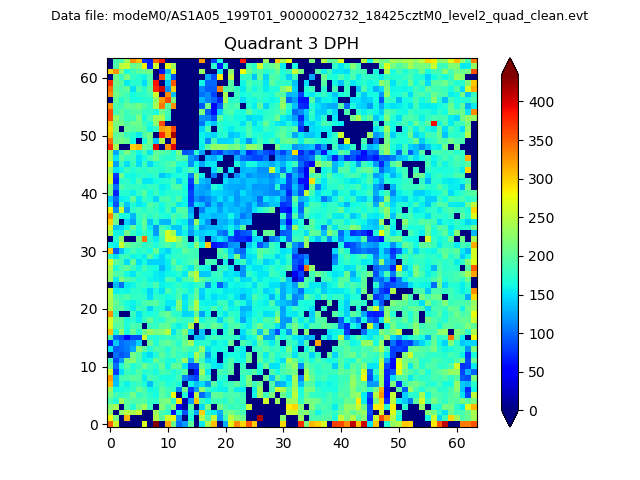 |
 |
Quadrant C |
| Plot type | Count rate plots | Images |
|---|---|---|
| Comparison with Poisson distribution Blue bars denote a histogram of data divided into 1 sec bins. Red curve is a Poisson curve with rate = median count rate of data. |
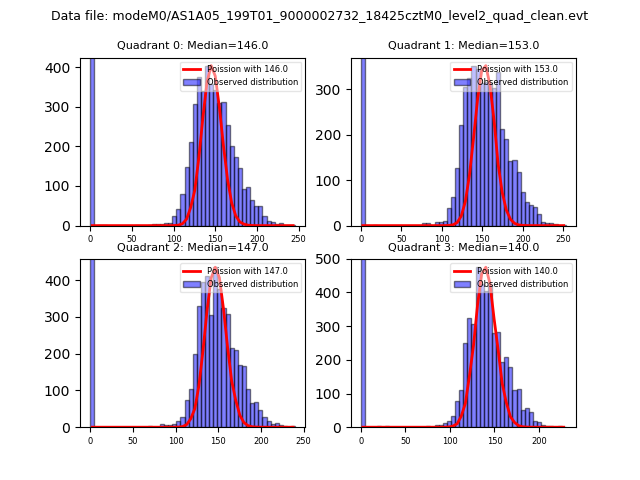 |
 |
| Quadrant-wise count rates Data is divided into 100 sec bins |
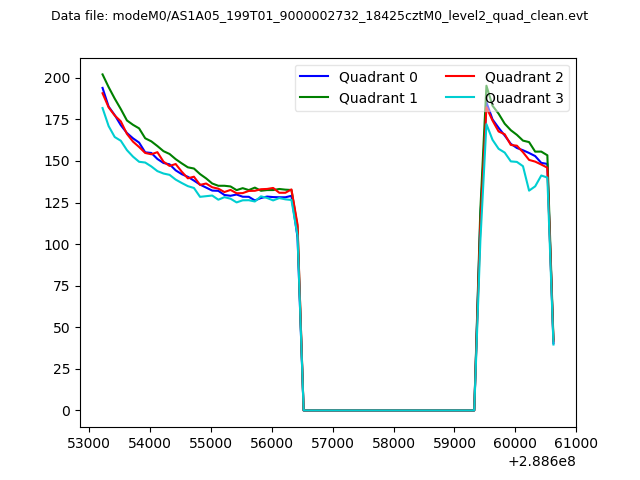 |
|
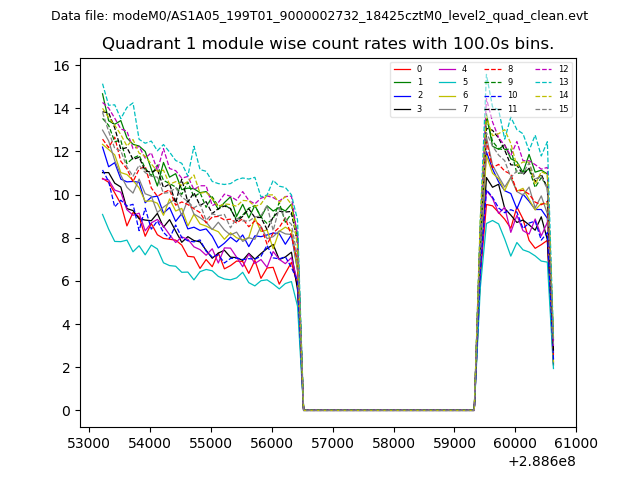
| Module-wise count rates for Quadrant A Data is divided into 100 sec bins |
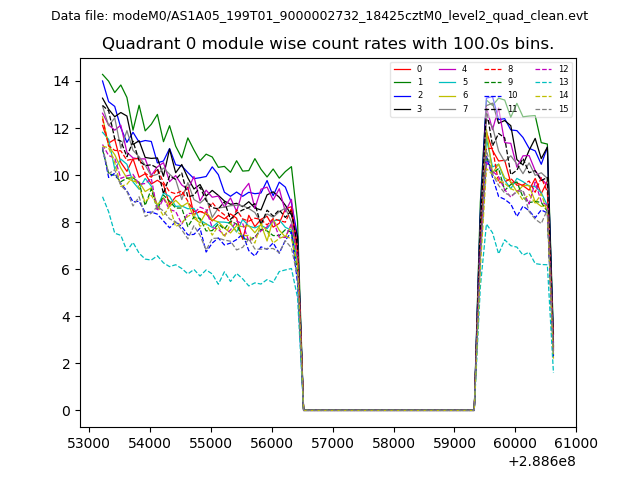 |
 |
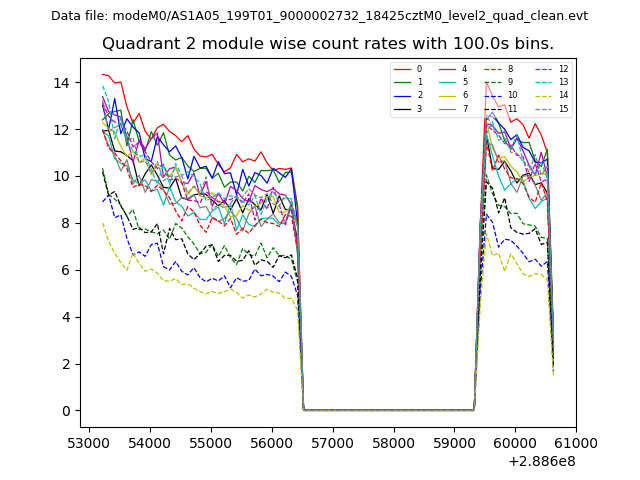
| Module-wise count rates for Quadrant B Data is divided into 100 sec bins |
 |
 |
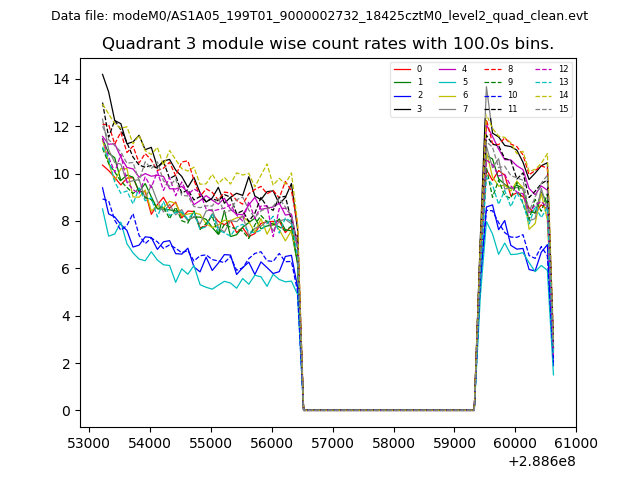
| Module-wise count rates for Quadrant C Data is divided into 100 sec bins |
 |
 |
| Module-wise count rates for Quadrant D Data is divided into 100 sec bins |
 |
 |
| Parameter | Plot |
|---|---|
| CZT HV Monitor | 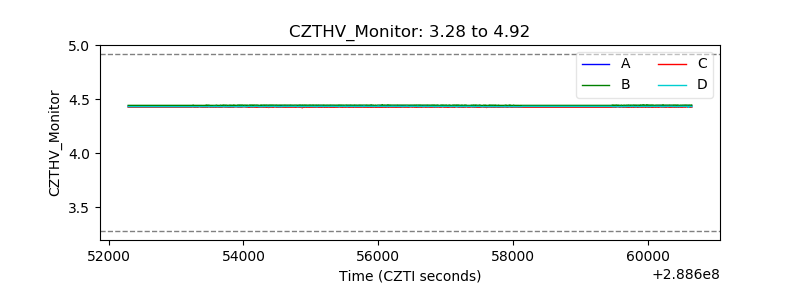 |
| D_VDD | 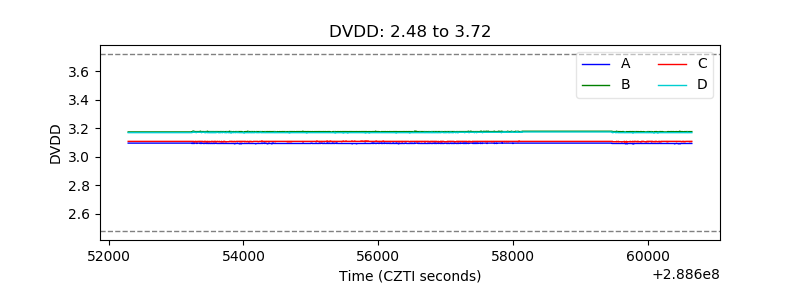 |
| Temperature 1 | 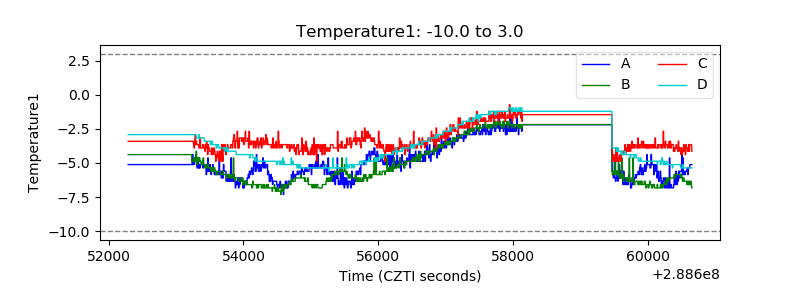 |
| Veto HV Monitor | 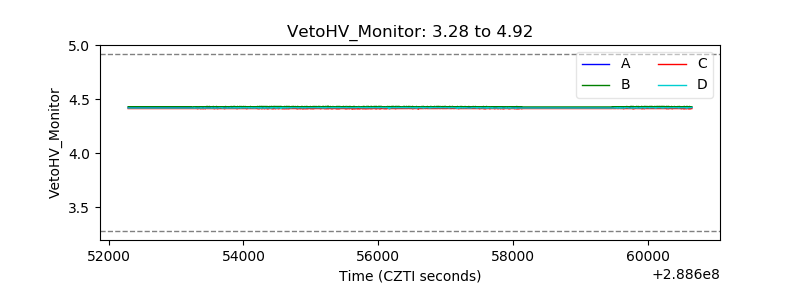 |
| Veto LLD | 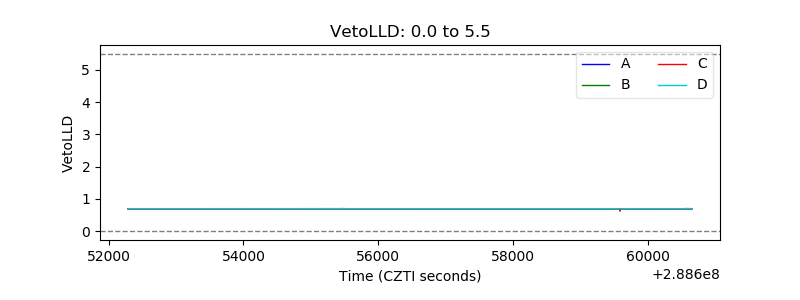 |
| Alpha Counter | 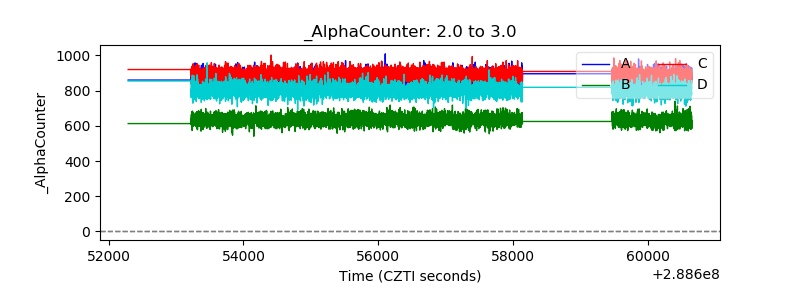 |
| _CPM_Rate | 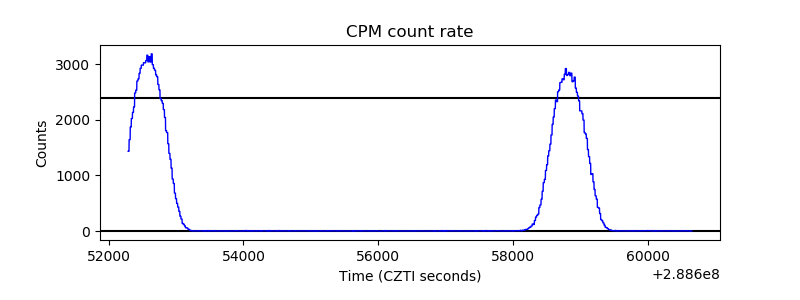 |
| CZT Counter |  |
| +2.5 Volts monitor |  |
| +5 Volts monitor |  |
| _ROLL_ROT | 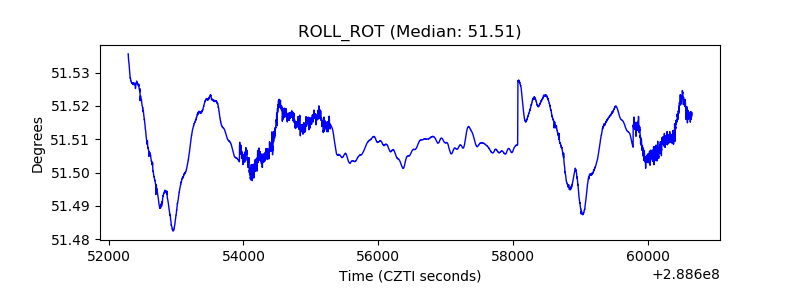 |
| _Roll_DEC | 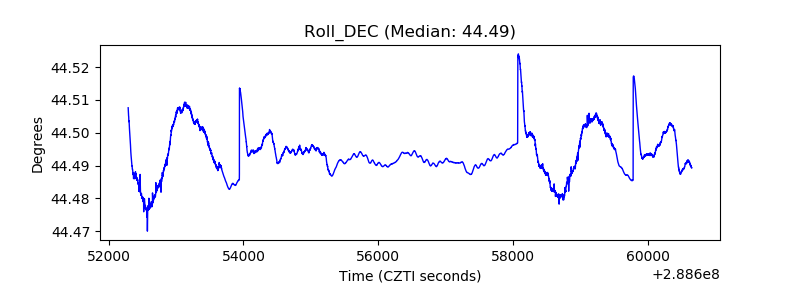 |
| _Roll_RA | 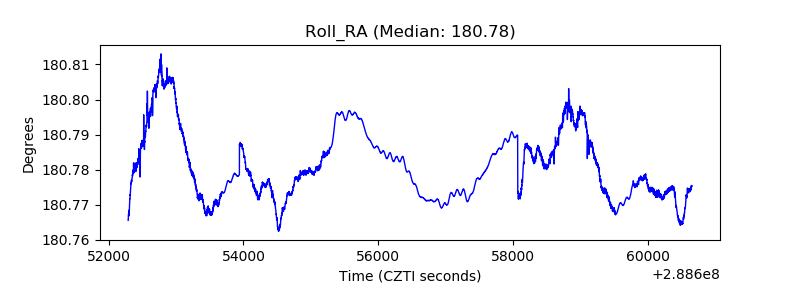 |
| Veto Counter | 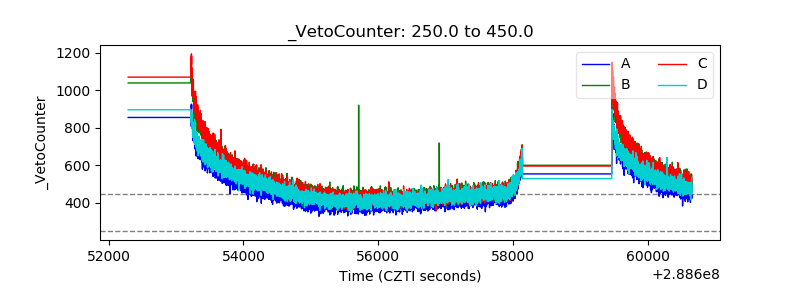 |