| Param | Original file | Final file |
|---|---|---|
| Filename | modeM0/AS1A05_199T01_9000002732_18426cztM0_level2.evt | modeM0/AS1A05_199T01_9000002732_18426cztM0_level2_quad_clean.evt |
| Size (bytes) | 444,067,200 | 96,837,120 |
| Size | 423.5 MB | 92.4 MB |
| Events in quadrant A | 3,083,891 | 625,176 |
| Events in quadrant B | 3,171,245 | 651,684 |
| Events in quadrant C | 3,197,619 | 621,850 |
| Events in quadrant D | 3,567,676 | 594,257 |
| Mode M0 | |||
|---|---|---|---|
| Quadrant | BADHDUFLAG | Total packets | Discarded packets |
| A | 0 | 13144 | 2 |
| B | 0 | 13356 | 2 |
| C | 0 | 13398 | 2 |
| D | 0 | 14922 | 2 |
| Mode SS | |||
|---|---|---|---|
| Quadrant | BADHDUFLAG | Total packets | Discarded packets |
| A | 0 | 128 | 0 |
| B | 0 | 128 | 0 |
| C | 0 | 128 | 0 |
| D | 0 | 128 | 0 |
| Mode M9 | |||
|---|---|---|---|
| Quadrant | BADHDUFLAG | Total packets | Discarded packets |
| A | 0 | 17 | 0 |
| B | 0 | 18 | 0 |
| C | 0 | 18 | 0 |
| D | 0 | 18 | 0 |
| Quadrant | Total seconds | Saturated seconds | Saturation percentage |
|---|---|---|---|
| A | 6300 | 38 | 0.603175% |
| B | 6300 | 59 | 0.936508% |
| C | 6300 | 75 | 1.190476% |
| D | 6299 | 60 | 0.952532% |
Noise dominated data is calculated using 1-second bins in cleaned event files. If a bin has >2000 counts, and if more than 50% of those come from <1% of pixels, then it is considered to be noise-dominated and hence unusable.
| Quadrant | # 1 sec bins | Bins with >0 counts | Bins with >2000 counts | High rate bins dominated by noise | Noise dominated (total time) | Noise dominated (detector-on time) | Marked lightcurve |
|---|---|---|---|---|---|---|---|
| A | 7625 | 6301 | 1 | 1 | 0.01% | 0.02% | 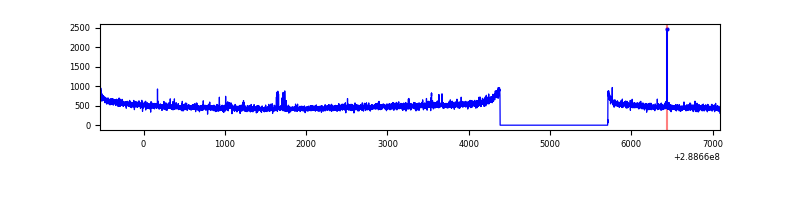 |
| B | 7625 | 6301 | 0 | 0 | 0.00% | 0.00% | 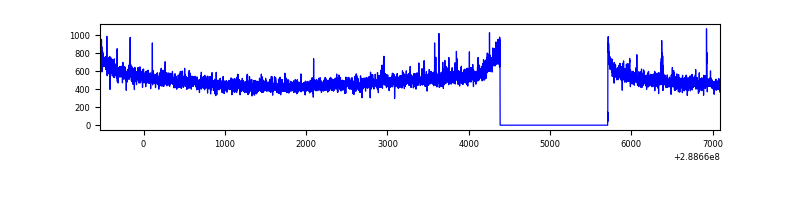 |
| C | 7625 | 6301 | 0 | 0 | 0.00% | 0.00% |  |
| D | 7624 | 6300 | 30 | 30 | 0.39% | 0.48% | 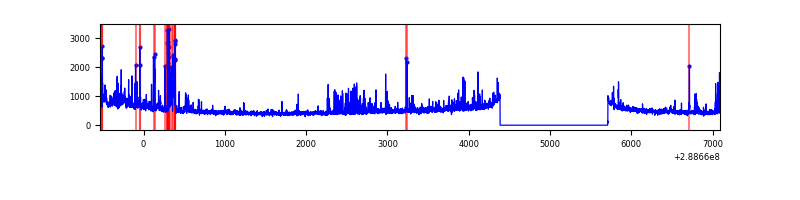 |
Top three noisy pixels from each quadrant. If the there are fewer than three noisy pixels in the level2.evt file, extra rows are filled as -1
| Pixel properties | Quadrant properties | ||||||
|---|---|---|---|---|---|---|---|
| Quadrant | DetID | PixID | Counts | Sigma | Mean | Median | Sigma |
| A | 0 | 254 | 10372 | 61.27 | 793 | 780 | 156.5 |
| A | 3 | 254 | 9052 | 52.84 | 793 | 780 | 156.5 |
| A | 4 | 2 | 8310 | 48.1 | 793 | 780 | 156.5 |
| B | 0 | 189 | 23676 | 152.1 | 805 | 785 | 150.5 |
| B | 12 | 111 | 17298 | 109.72 | 805 | 785 | 150.5 |
| B | 11 | 111 | 14719 | 92.59 | 805 | 785 | 150.5 |
| C | 14 | 238 | 122072 | 680.04 | 773 | 781 | 178.4 |
| C | 3 | 233 | 56543 | 312.64 | 773 | 781 | 178.4 |
| C | 13 | 61 | 5582 | 26.92 | 773 | 781 | 178.4 |
| D | 1 | 52 | 279449 | 1513.18 | 767 | 744 | 184.2 |
| D | 12 | 110 | 110407 | 595.4 | 767 | 744 | 184.2 |
| D | 8 | 230 | 107949 | 582.05 | 767 | 744 | 184.2 |
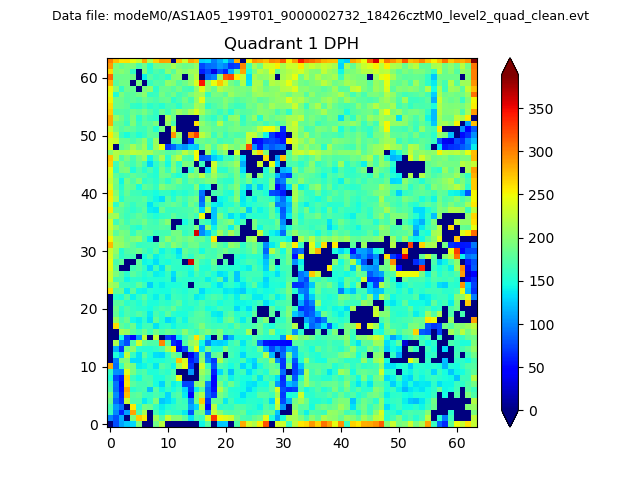
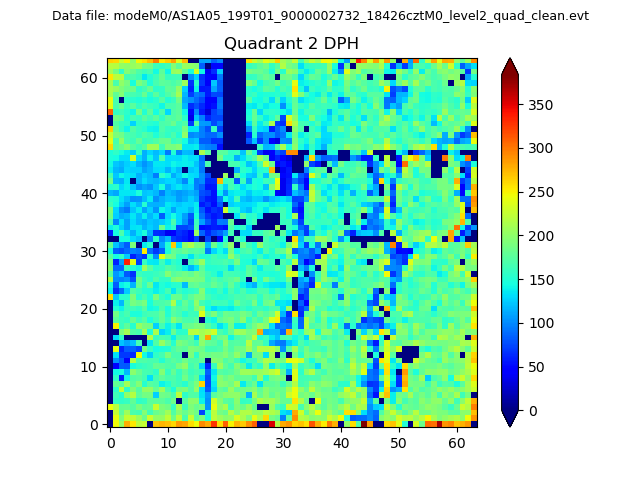
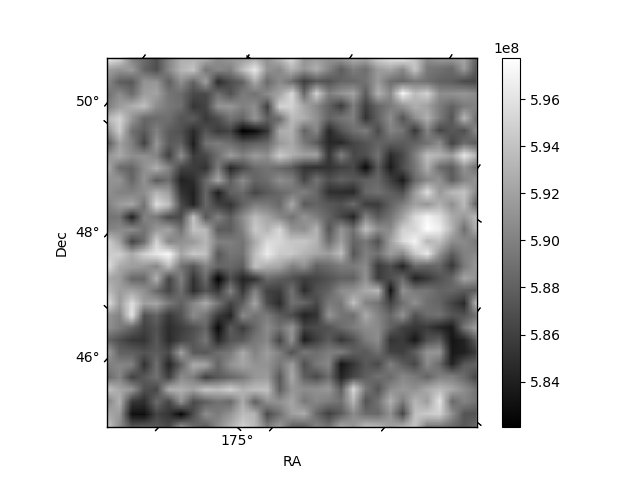
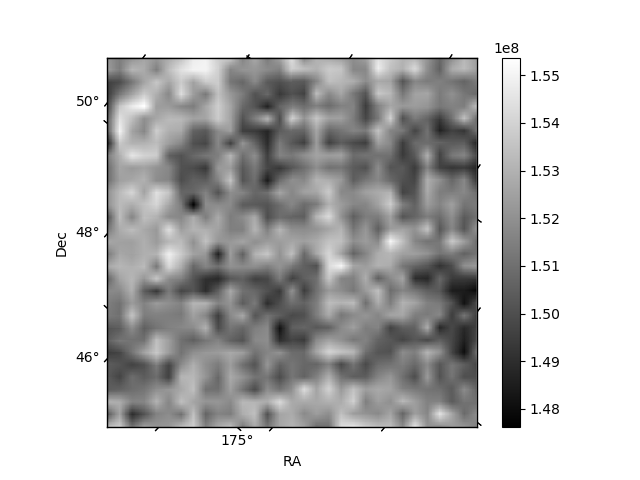
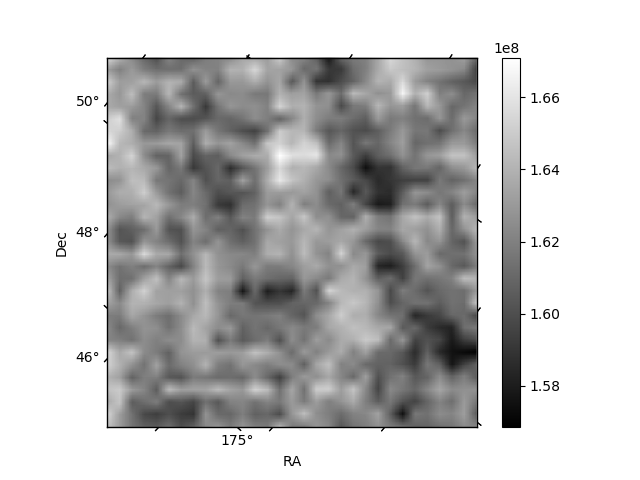
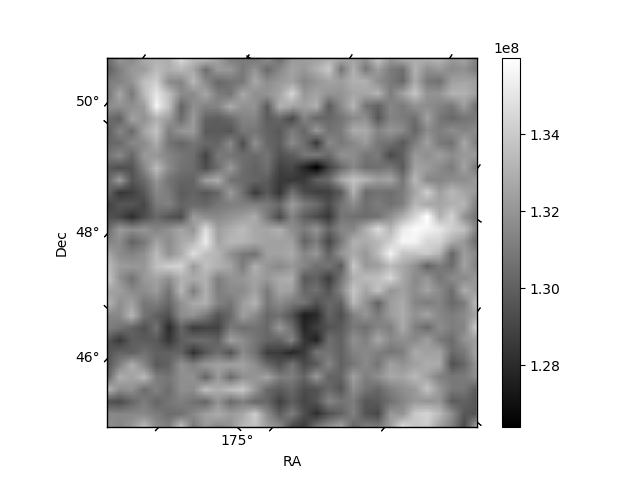
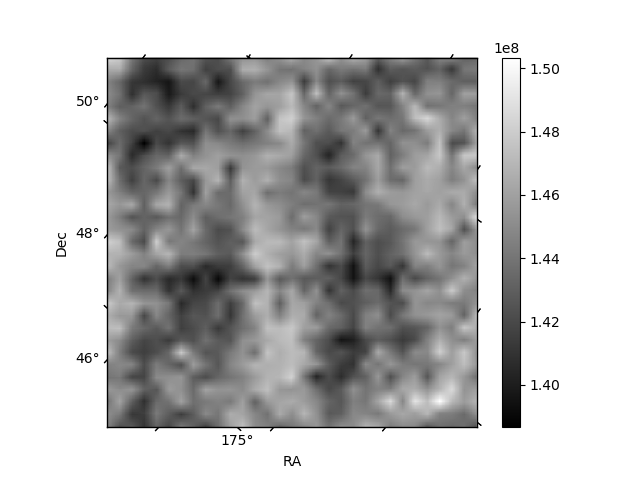
Histogram calculated using DETX and DETY for each event in the final _common_clean file
| Quadrant A | 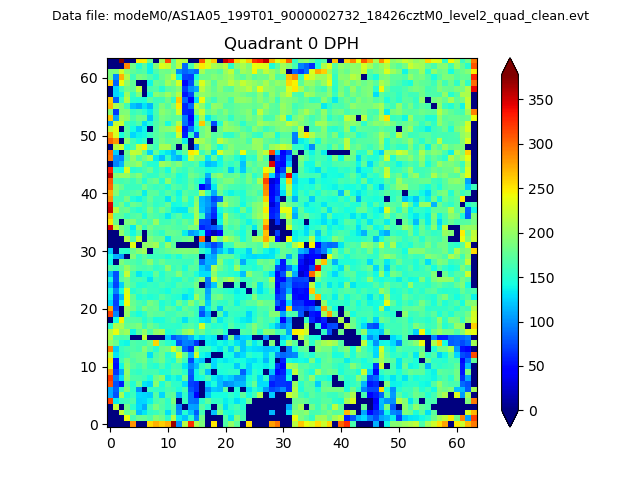 |
 |
Quadrant B |
|---|---|---|---|
| Quadrant D | 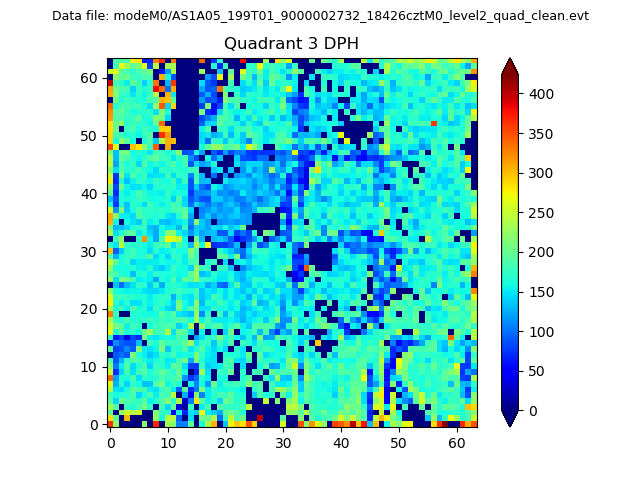 |
 |
Quadrant C |
| Plot type | Count rate plots | Images |
|---|---|---|
| Comparison with Poisson distribution Blue bars denote a histogram of data divided into 1 sec bins. Red curve is a Poisson curve with rate = median count rate of data. |
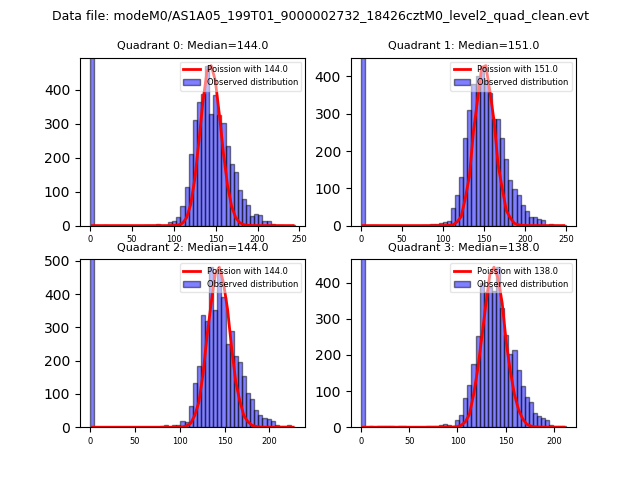 |
 |
| Quadrant-wise count rates Data is divided into 100 sec bins |
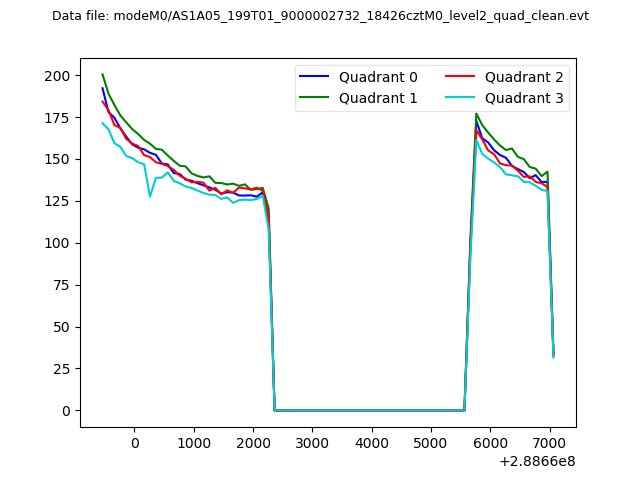 |
|
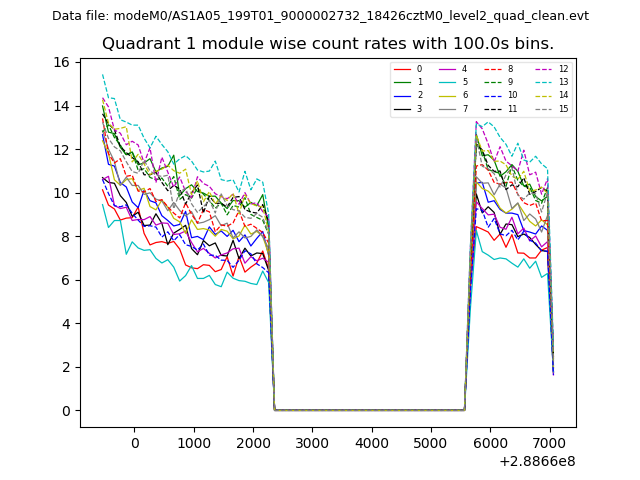
| Module-wise count rates for Quadrant A Data is divided into 100 sec bins |
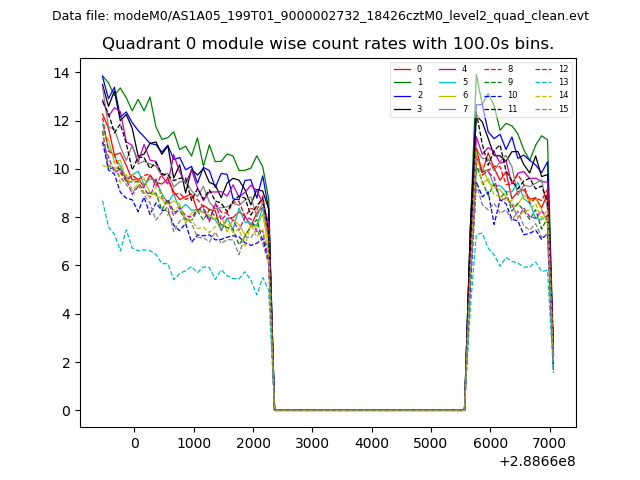 |
 |
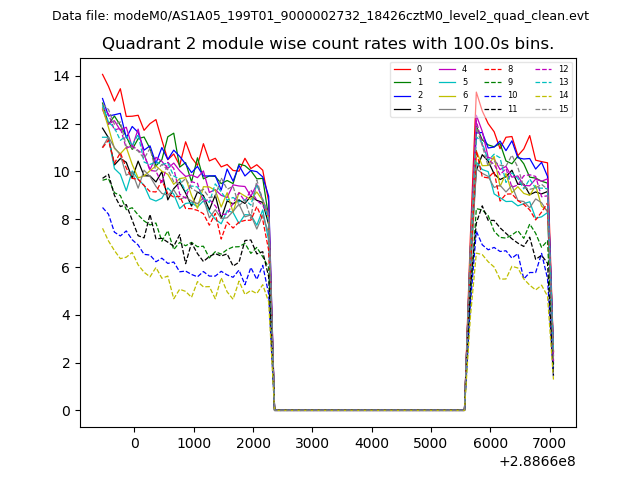
| Module-wise count rates for Quadrant B Data is divided into 100 sec bins |
 |
 |
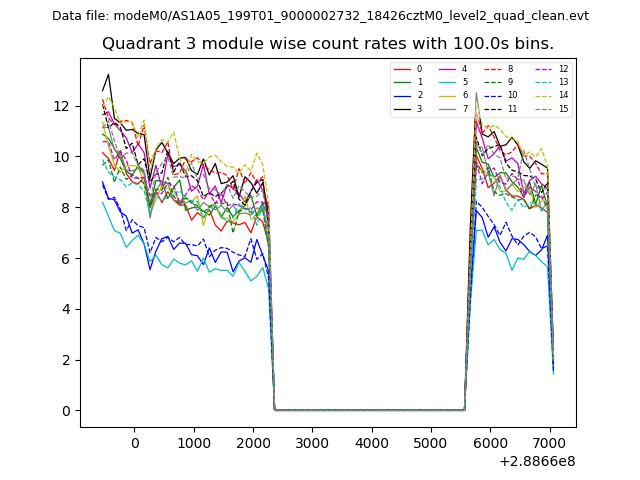
| Module-wise count rates for Quadrant C Data is divided into 100 sec bins |
 |
 |
| Module-wise count rates for Quadrant D Data is divided into 100 sec bins |
 |
 |
| Parameter | Plot |
|---|---|
| CZT HV Monitor | 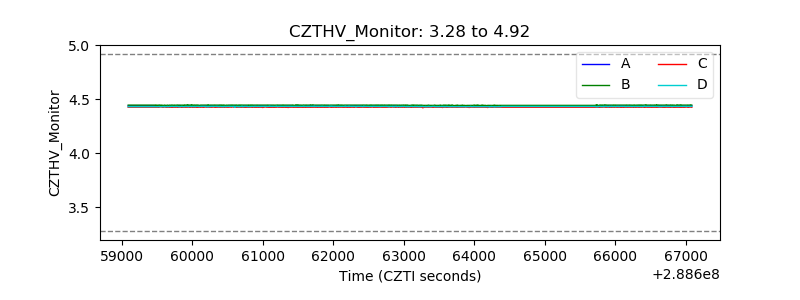 |
| D_VDD | 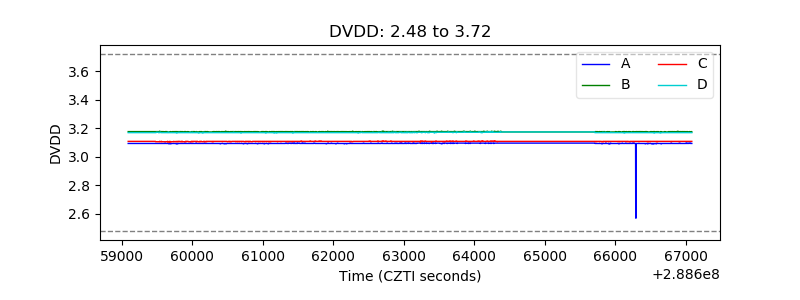 |
| Temperature 1 | 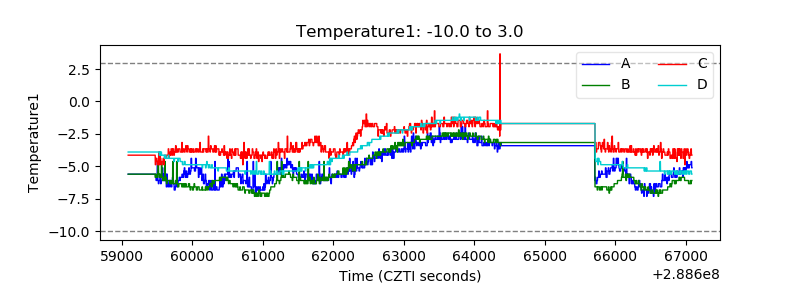 |
| Veto HV Monitor | 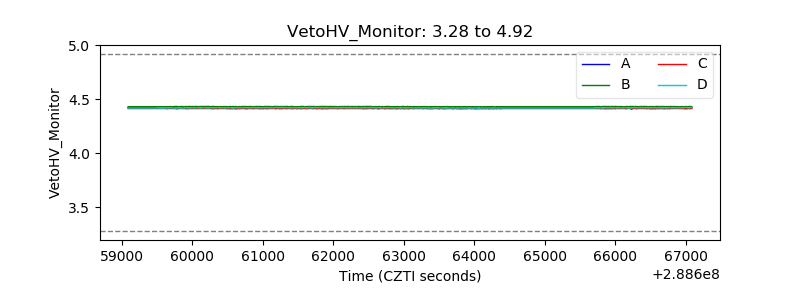 |
| Veto LLD | 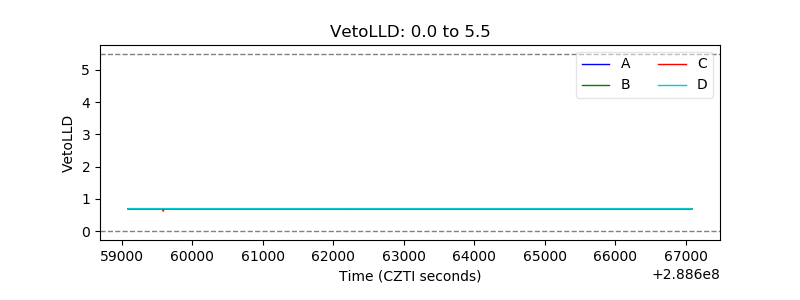 |
| Alpha Counter | 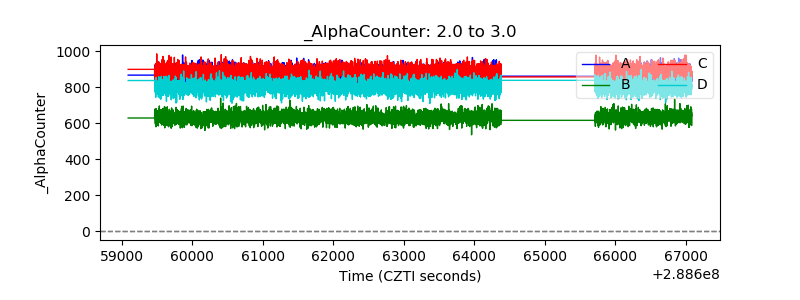 |
| _CPM_Rate | 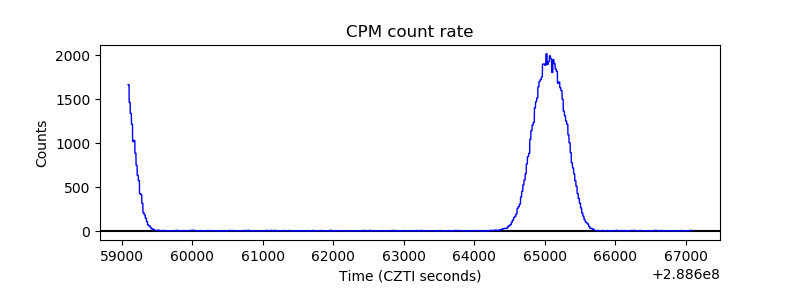 |
| CZT Counter | 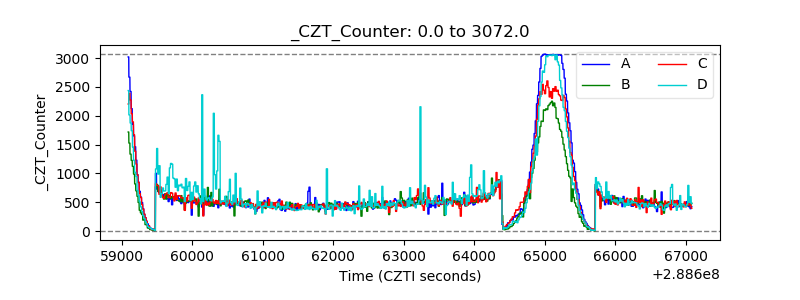 |
| +2.5 Volts monitor |  |
| +5 Volts monitor |  |
| _ROLL_ROT | 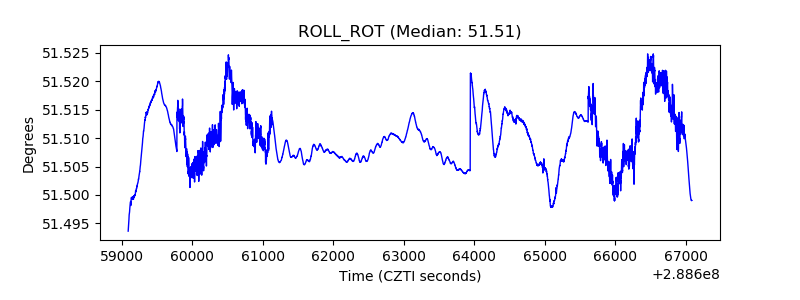 |
| _Roll_DEC |  |
| _Roll_RA | 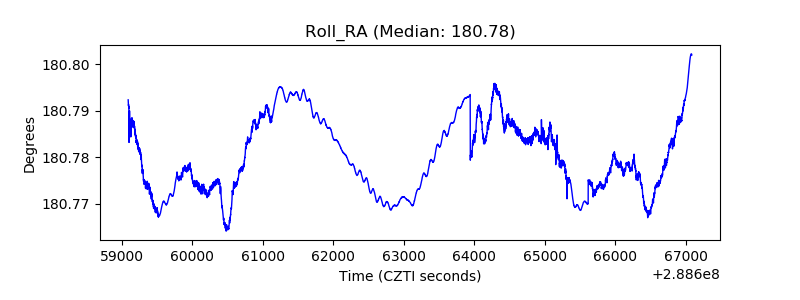 |
| Veto Counter | 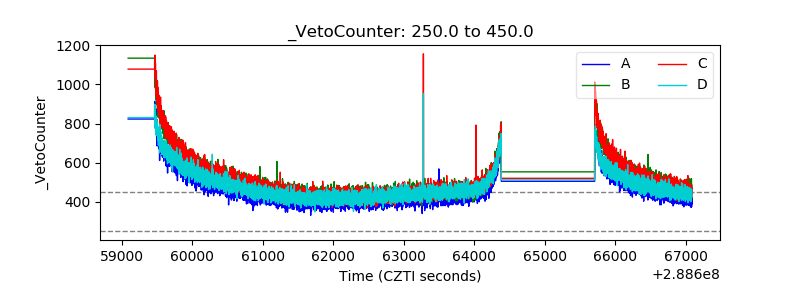 |