| Param | Original file | Final file |
|---|---|---|
| Filename | modeM0/AS1A05_199T01_9000002732_18427cztM0_level2.evt | modeM0/AS1A05_199T01_9000002732_18427cztM0_level2_quad_clean.evt |
| Size (bytes) | 442,111,680 | 99,385,920 |
| Size | 421.6 MB | 94.8 MB |
| Events in quadrant A | 3,138,345 | 640,230 |
| Events in quadrant B | 3,276,246 | 663,394 |
| Events in quadrant C | 3,192,859 | 631,191 |
| Events in quadrant D | 3,330,577 | 612,269 |
| Mode M0 | |||
|---|---|---|---|
| Quadrant | BADHDUFLAG | Total packets | Discarded packets |
| A | 0 | 13664 | 2 |
| B | 0 | 13948 | 2 |
| C | 0 | 13765 | 2 |
| D | 0 | 14518 | 2 |
| Mode SS | |||
|---|---|---|---|
| Quadrant | BADHDUFLAG | Total packets | Discarded packets |
| A | 0 | 136 | 0 |
| B | 0 | 136 | 0 |
| C | 0 | 136 | 0 |
| D | 0 | 136 | 0 |
| Mode M9 | |||
|---|---|---|---|
| Quadrant | BADHDUFLAG | Total packets | Discarded packets |
| A | 0 | 14 | 0 |
| B | 0 | 15 | 0 |
| C | 0 | 15 | 0 |
| D | 0 | 15 | 0 |
| Quadrant | Total seconds | Saturated seconds | Saturation percentage |
|---|---|---|---|
| A | 6635 | 16 | 0.241145% |
| B | 6635 | 52 | 0.783723% |
| C | 6635 | 72 | 1.085154% |
| D | 6635 | 22 | 0.331575% |
Noise dominated data is calculated using 1-second bins in cleaned event files. If a bin has >2000 counts, and if more than 50% of those come from <1% of pixels, then it is considered to be noise-dominated and hence unusable.
| Quadrant | # 1 sec bins | Bins with >0 counts | Bins with >2000 counts | High rate bins dominated by noise | Noise dominated (total time) | Noise dominated (detector-on time) | Marked lightcurve |
|---|---|---|---|---|---|---|---|
| A | 7890 | 6636 | 1 | 1 | 0.01% | 0.02% | 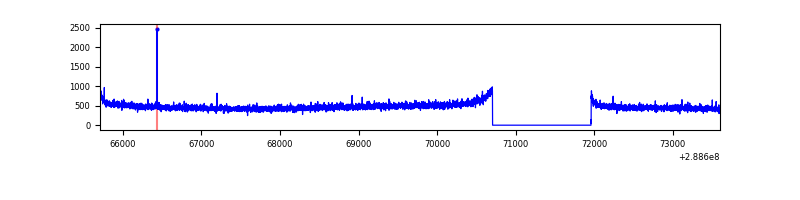 |
| B | 7890 | 6636 | 4 | 4 | 0.05% | 0.06% | 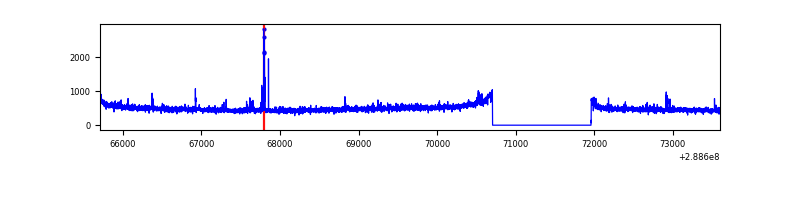 |
| C | 7890 | 6636 | 0 | 0 | 0.00% | 0.00% |  |
| D | 7890 | 6636 | 13 | 13 | 0.16% | 0.20% | 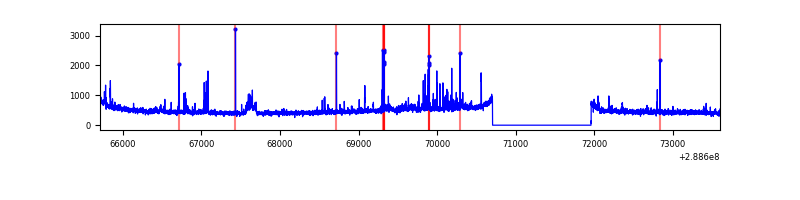 |
Top three noisy pixels from each quadrant. If the there are fewer than three noisy pixels in the level2.evt file, extra rows are filled as -1
| Pixel properties | Quadrant properties | ||||||
|---|---|---|---|---|---|---|---|
| Quadrant | DetID | PixID | Counts | Sigma | Mean | Median | Sigma |
| A | 0 | 226 | 7128 | 38.98 | 814 | 799 | 162.4 |
| A | 0 | 254 | 6920 | 37.7 | 814 | 799 | 162.4 |
| A | 3 | 137 | 6028 | 32.2 | 814 | 799 | 162.4 |
| B | 4 | 173 | 33592 | 211.2 | 822 | 802 | 155.3 |
| B | 0 | 189 | 25297 | 157.77 | 822 | 802 | 155.3 |
| B | 12 | 111 | 18098 | 111.4 | 822 | 802 | 155.3 |
| C | 14 | 238 | 125138 | 682.26 | 781 | 786 | 182.3 |
| C | 3 | 233 | 18904 | 99.4 | 781 | 786 | 182.3 |
| C | 13 | 61 | 5649 | 26.68 | 781 | 786 | 182.3 |
| D | 1 | 52 | 134885 | 703.11 | 785 | 762 | 190.8 |
| D | 13 | 168 | 87413 | 454.25 | 785 | 762 | 190.8 |
| D | 12 | 110 | 58619 | 303.3 | 785 | 762 | 190.8 |
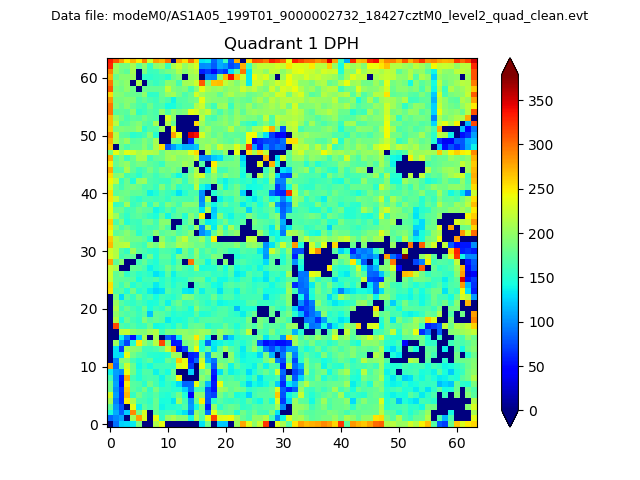
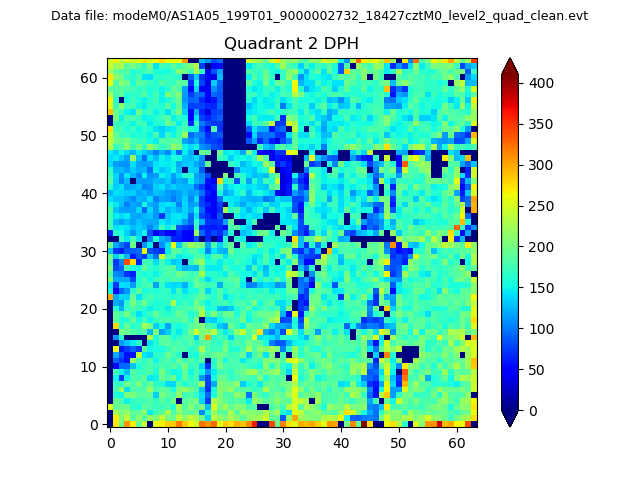
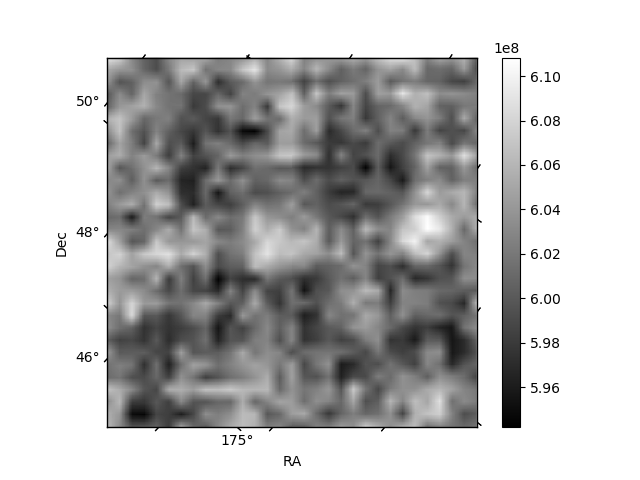
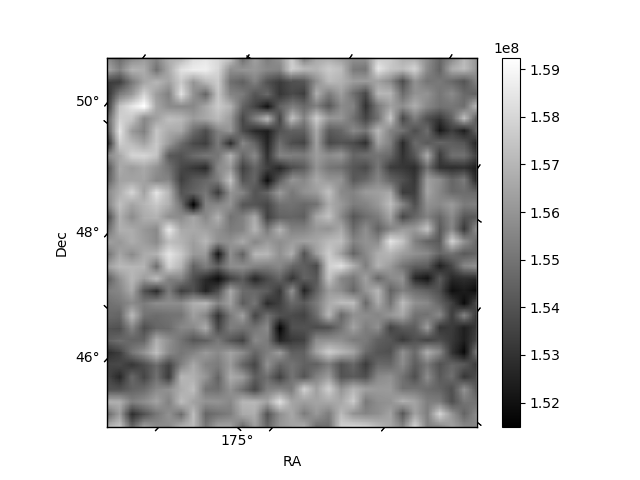
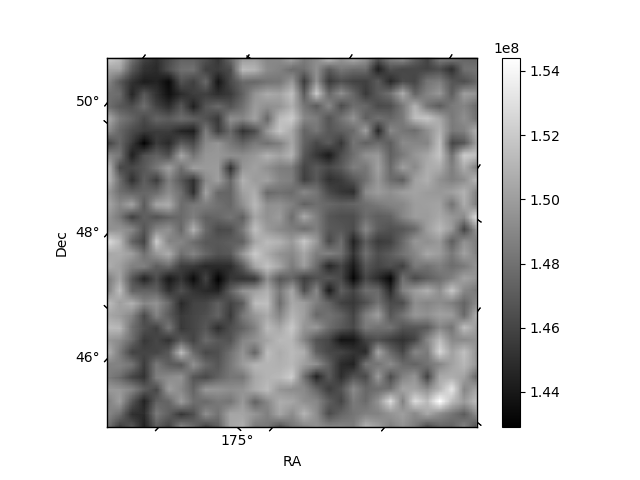
Histogram calculated using DETX and DETY for each event in the final _common_clean file
| Quadrant A | 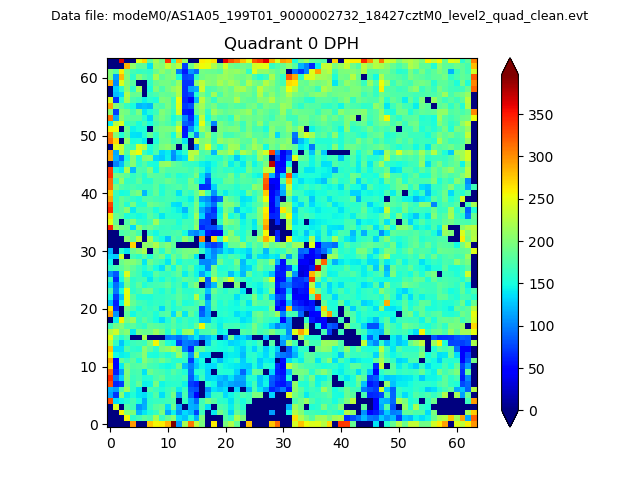 |
 |
Quadrant B |
|---|---|---|---|
| Quadrant D | 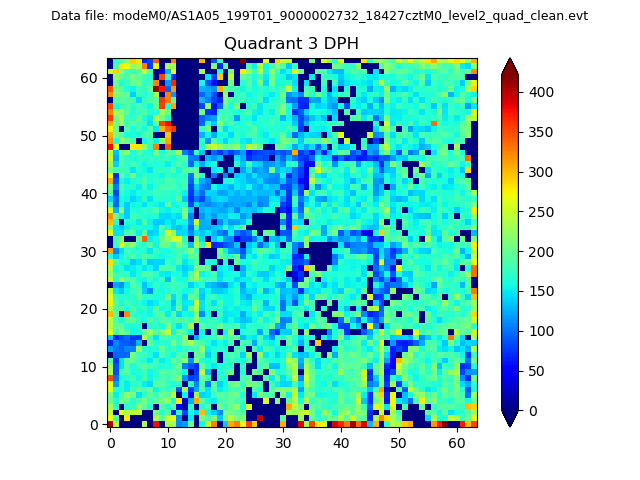 |
 |
Quadrant C |
| Plot type | Count rate plots | Images |
|---|---|---|
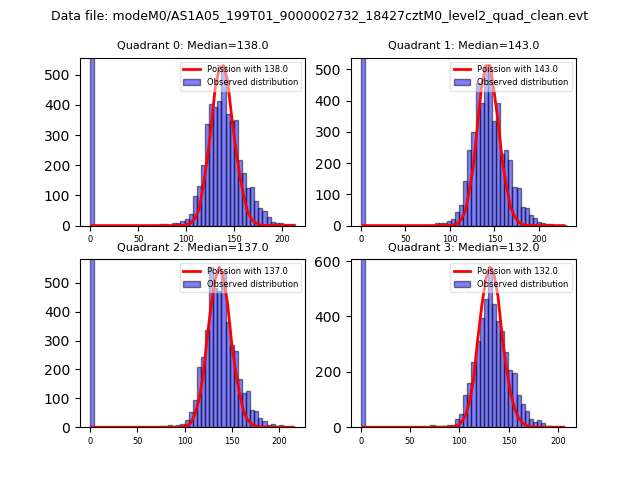
| Comparison with Poisson distribution Blue bars denote a histogram of data divided into 1 sec bins. Red curve is a Poisson curve with rate = median count rate of data. |
 |
 |
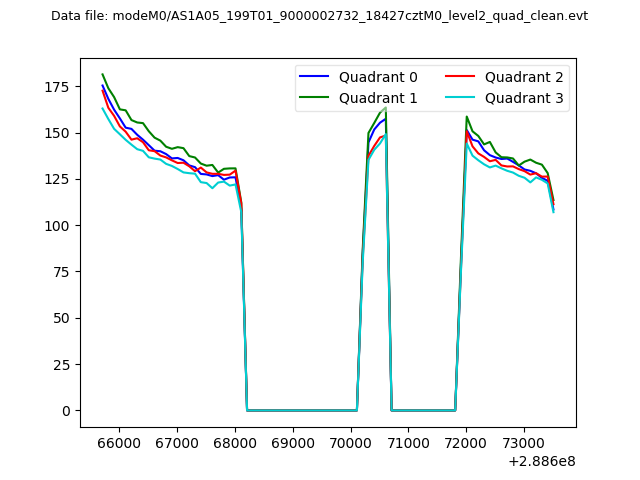
| Quadrant-wise count rates Data is divided into 100 sec bins |
 |
|
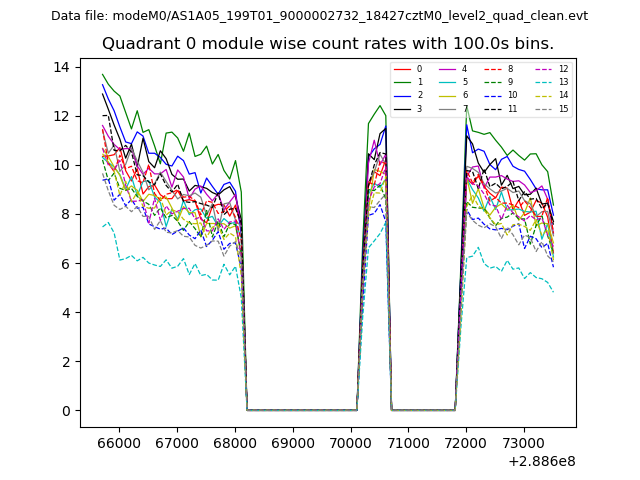
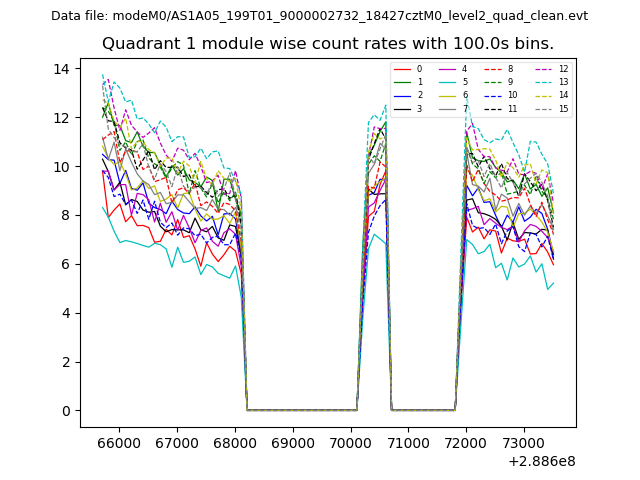
| Module-wise count rates for Quadrant A Data is divided into 100 sec bins |
 |
 |
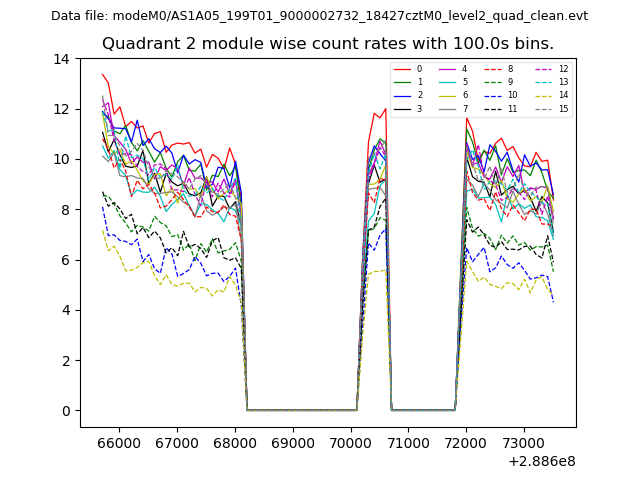
| Module-wise count rates for Quadrant B Data is divided into 100 sec bins |
 |
 |
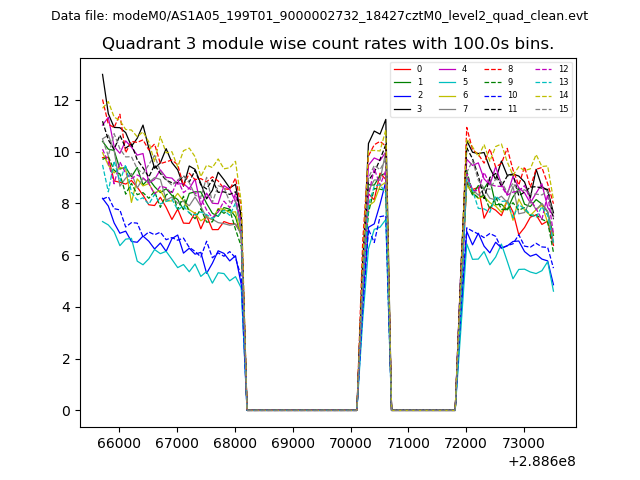
| Module-wise count rates for Quadrant C Data is divided into 100 sec bins |
 |
 |
| Module-wise count rates for Quadrant D Data is divided into 100 sec bins |
 |
 |
| Parameter | Plot |
|---|---|
| CZT HV Monitor | 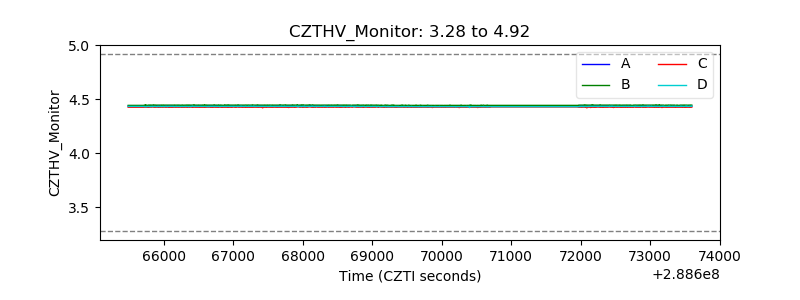 |
| D_VDD | 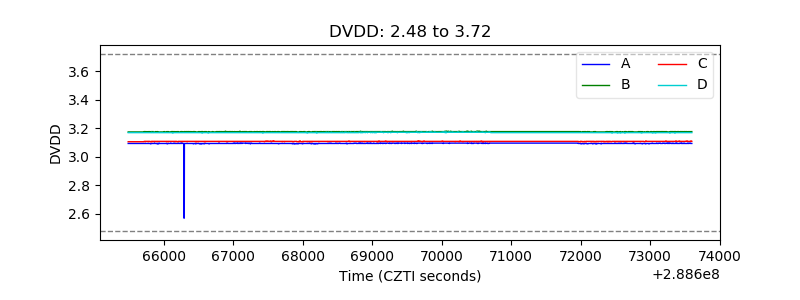 |
| Temperature 1 | 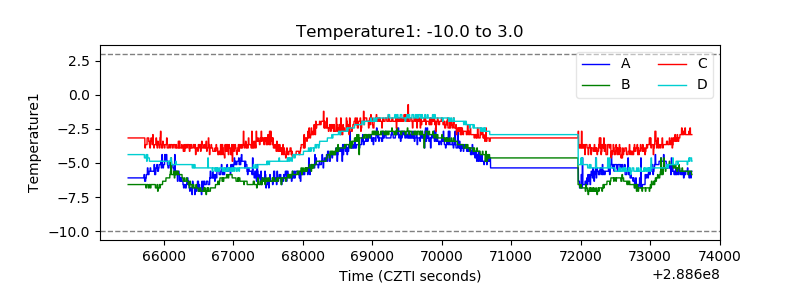 |
| Veto HV Monitor |  |
| Veto LLD | 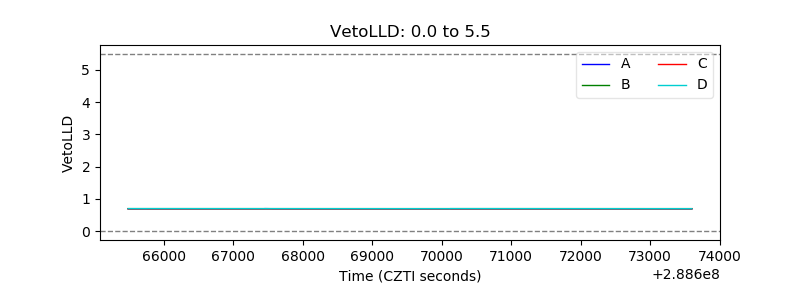 |
| Alpha Counter | 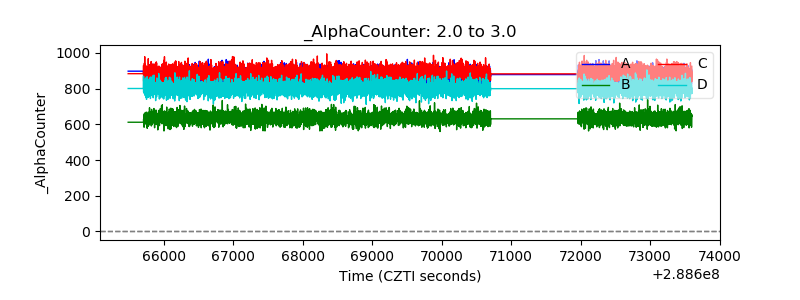 |
| _CPM_Rate | 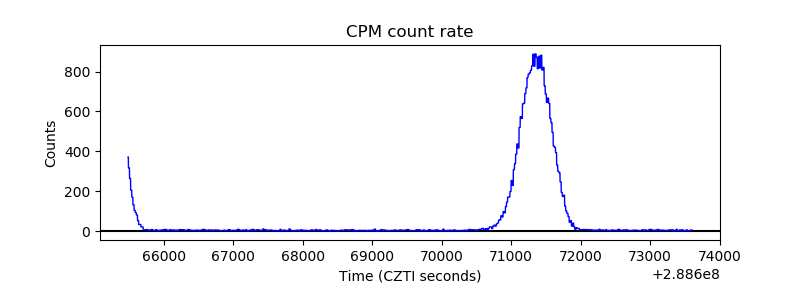 |
| CZT Counter | 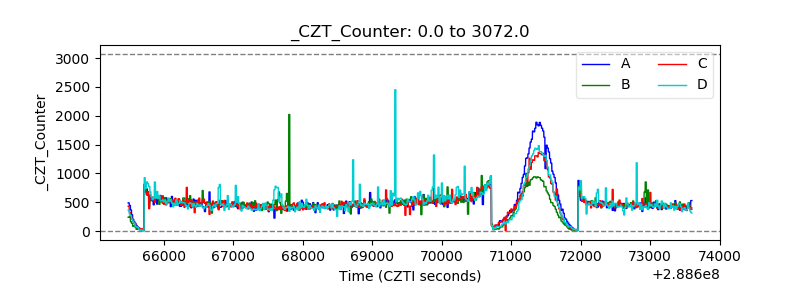 |
| +2.5 Volts monitor |  |
| +5 Volts monitor |  |
| _ROLL_ROT | 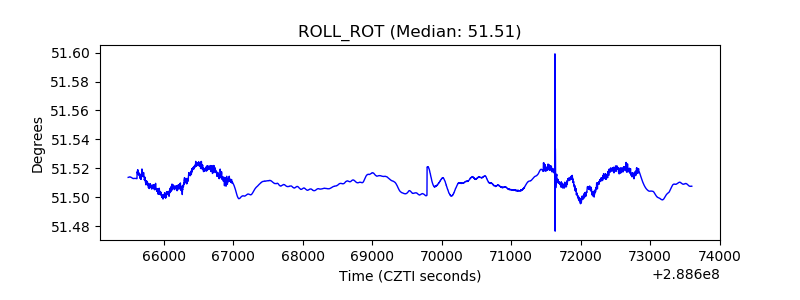 |
| _Roll_DEC | 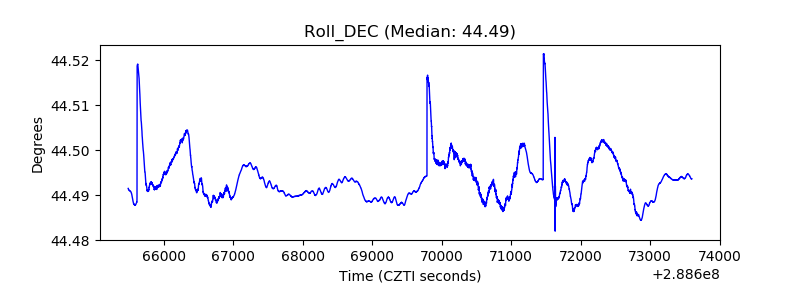 |
| _Roll_RA | 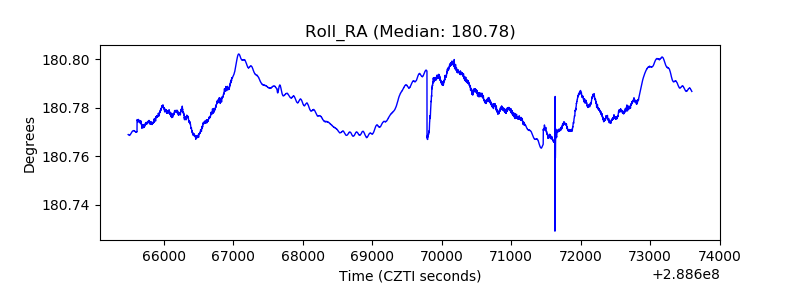 |
| Veto Counter | 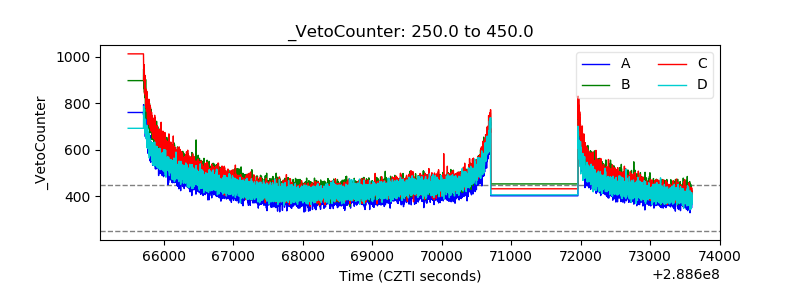 |