| Param | Original file | Final file |
|---|---|---|
| Filename | modeM0/AS1A05_199T01_9000002732_18428cztM0_level2.evt | modeM0/AS1A05_199T01_9000002732_18428cztM0_level2_quad_clean.evt |
| Size (bytes) | 424,883,520 | 91,609,920 |
| Size | 405.2 MB | 87.4 MB |
| Events in quadrant A | 3,009,117 | 583,934 |
| Events in quadrant B | 3,116,482 | 598,599 |
| Events in quadrant C | 3,115,822 | 576,049 |
| Events in quadrant D | 3,183,179 | 561,587 |
| Mode M0 | |||
|---|---|---|---|
| Quadrant | BADHDUFLAG | Total packets | Discarded packets |
| A | 0 | 13291 | 1 |
| B | 0 | 13501 | 1 |
| C | 0 | 13506 | 1 |
| D | 0 | 13960 | 1 |
| Mode SS | |||
|---|---|---|---|
| Quadrant | BADHDUFLAG | Total packets | Discarded packets |
| A | 0 | 132 | 0 |
| B | 0 | 130 | 0 |
| C | 0 | 130 | 0 |
| D | 0 | 130 | 0 |
| Mode M9 | |||
|---|---|---|---|
| Quadrant | BADHDUFLAG | Total packets | Discarded packets |
| A | 0 | 10 | 0 |
| B | 0 | 10 | 0 |
| C | 0 | 10 | 0 |
| D | 0 | 10 | 0 |
| Quadrant | Total seconds | Saturated seconds | Saturation percentage |
|---|---|---|---|
| A | 6518 | 47 | 0.721080% |
| B | 6519 | 68 | 1.043105% |
| C | 6518 | 93 | 1.426818% |
| D | 6518 | 41 | 0.629027% |
Noise dominated data is calculated using 1-second bins in cleaned event files. If a bin has >2000 counts, and if more than 50% of those come from <1% of pixels, then it is considered to be noise-dominated and hence unusable.
| Quadrant | # 1 sec bins | Bins with >0 counts | Bins with >2000 counts | High rate bins dominated by noise | Noise dominated (total time) | Noise dominated (detector-on time) | Marked lightcurve |
|---|---|---|---|---|---|---|---|
| A | 7488 | 6519 | 0 | 0 | 0.00% | 0.00% | 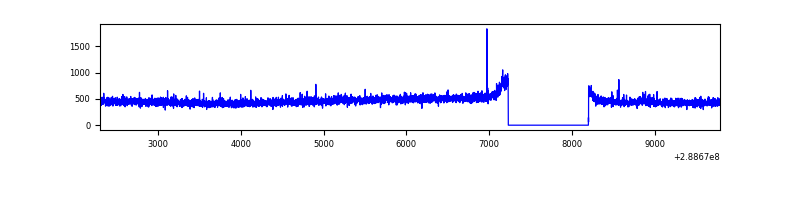 |
| B | 7489 | 6520 | 1 | 1 | 0.01% | 0.02% | 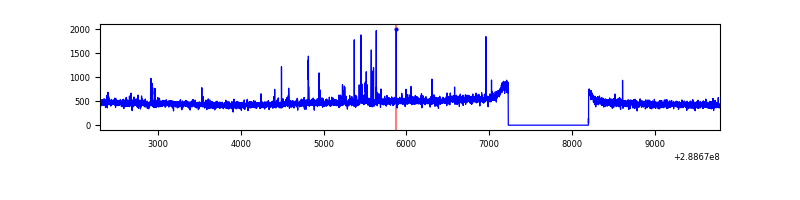 |
| C | 7488 | 6519 | 9 | 9 | 0.12% | 0.14% | 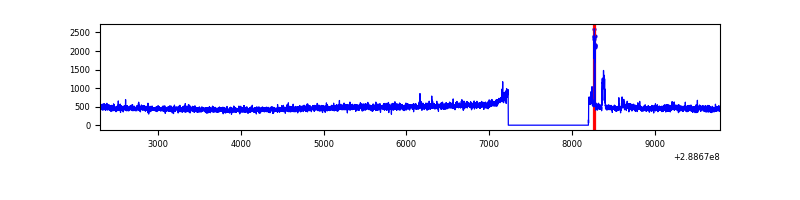 |
| D | 7488 | 6519 | 7 | 7 | 0.09% | 0.11% | 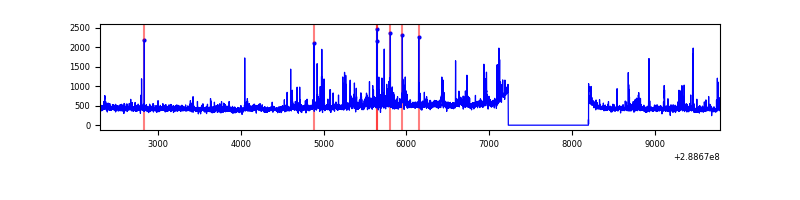 |
Top three noisy pixels from each quadrant. If the there are fewer than three noisy pixels in the level2.evt file, extra rows are filled as -1
| Pixel properties | Quadrant properties | ||||||
|---|---|---|---|---|---|---|---|
| Quadrant | DetID | PixID | Counts | Sigma | Mean | Median | Sigma |
| A | 11 | 47 | 13844 | 82.89 | 779 | 763 | 157.8 |
| A | 0 | 226 | 6863 | 38.65 | 779 | 763 | 157.8 |
| A | 3 | 137 | 5879 | 32.42 | 779 | 763 | 157.8 |
| B | 12 | 111 | 17639 | 113.14 | 781 | 762 | 149.2 |
| B | 0 | 189 | 15735 | 100.38 | 781 | 762 | 149.2 |
| B | 11 | 111 | 15465 | 98.57 | 781 | 762 | 149.2 |
| C | 14 | 238 | 117780 | 674.77 | 744 | 748 | 173.4 |
| C | 3 | 233 | 84301 | 481.74 | 744 | 748 | 173.4 |
| C | 8 | 128 | 7570 | 39.33 | 744 | 748 | 173.4 |
| D | 1 | 52 | 151823 | 834.04 | 750 | 728 | 181.2 |
| D | 13 | 168 | 97272 | 532.92 | 750 | 728 | 181.2 |
| D | 2 | 234 | 26957 | 144.78 | 750 | 728 | 181.2 |
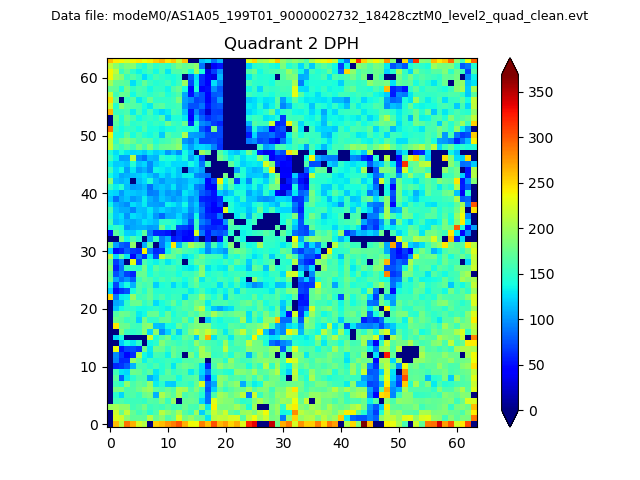
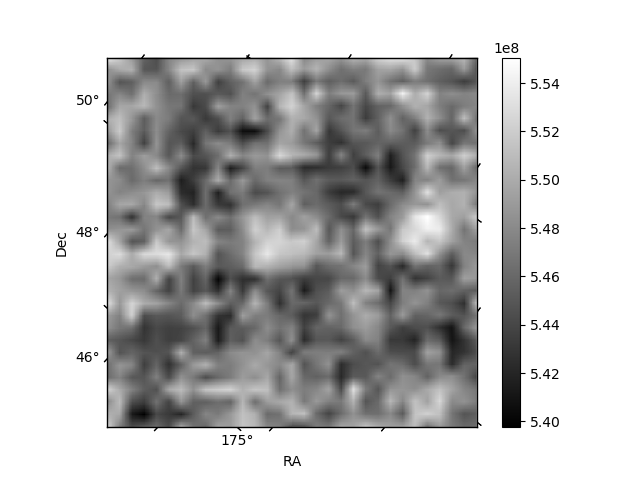
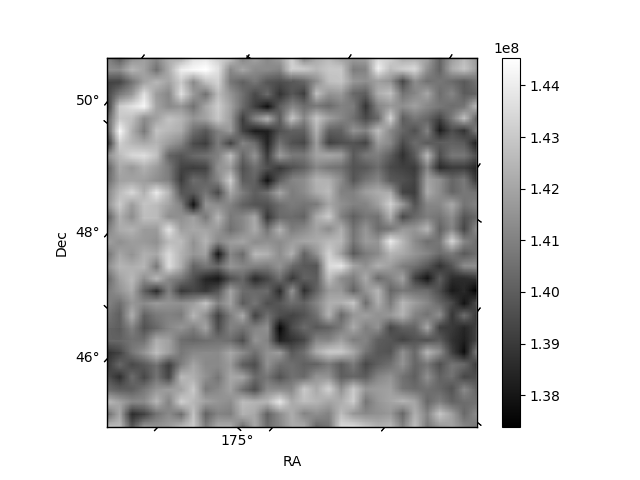
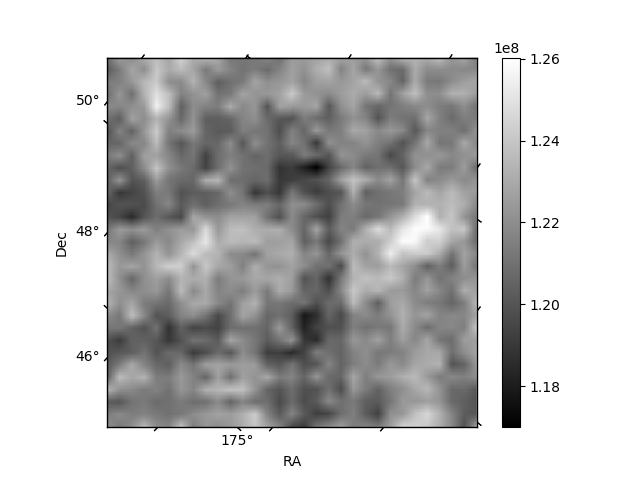
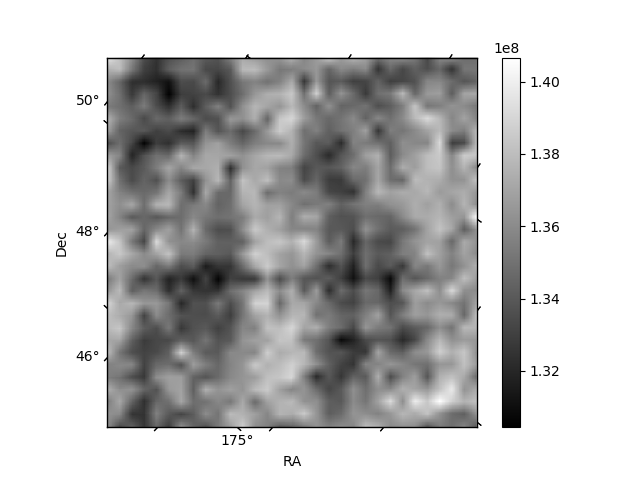
Histogram calculated using DETX and DETY for each event in the final _common_clean file
| Quadrant A | 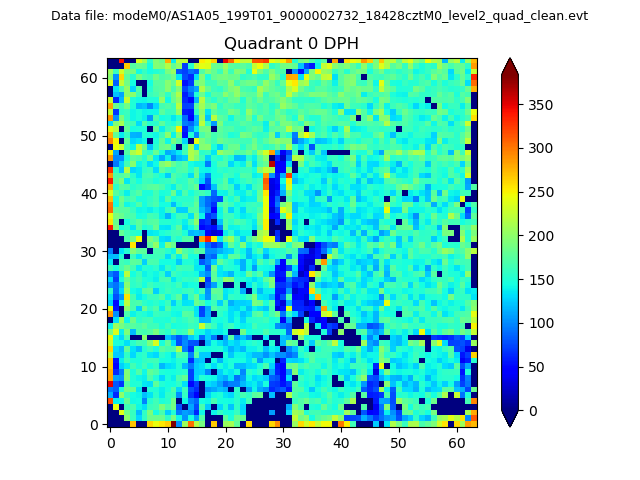 |
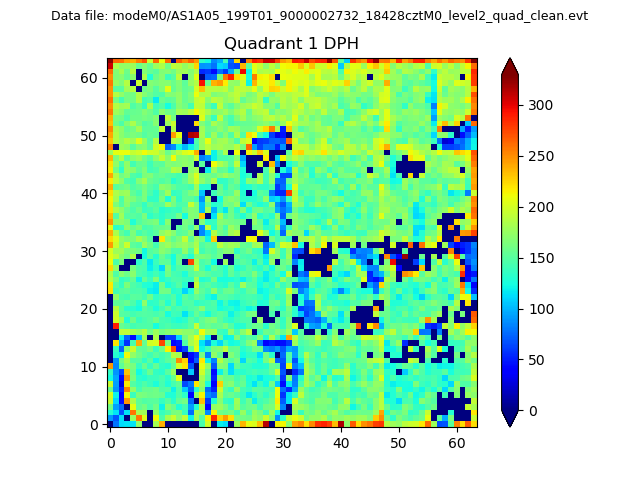 |
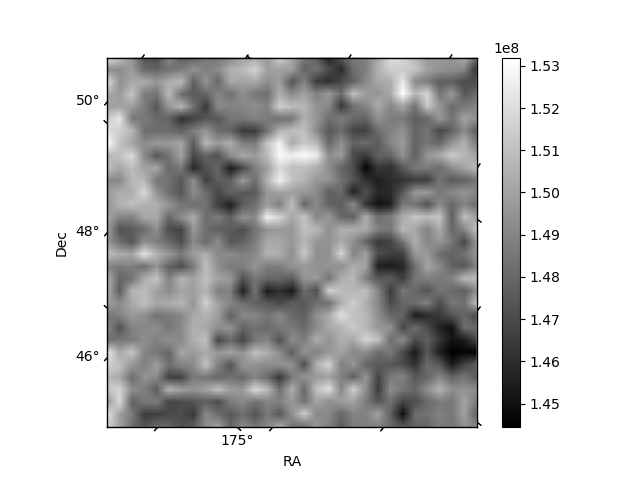
Quadrant B |
|---|---|---|---|
| Quadrant D | 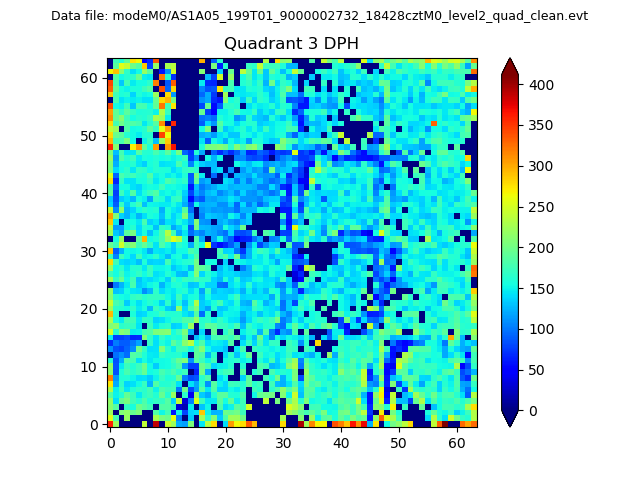 |
 |
Quadrant C |
| Plot type | Count rate plots | Images |
|---|---|---|
| Comparison with Poisson distribution Blue bars denote a histogram of data divided into 1 sec bins. Red curve is a Poisson curve with rate = median count rate of data. |
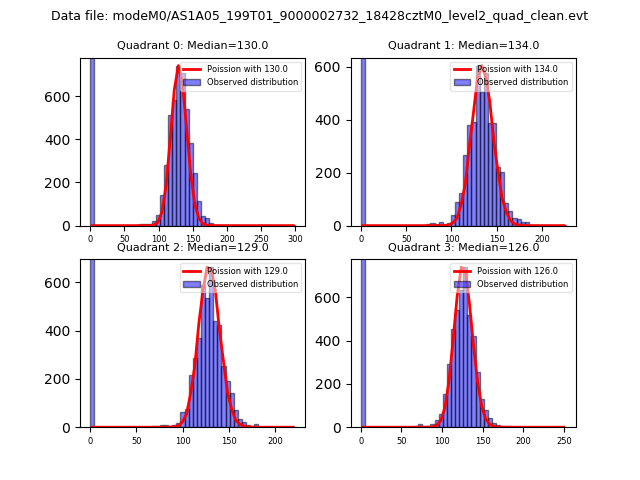 |
 |
| Quadrant-wise count rates Data is divided into 100 sec bins |
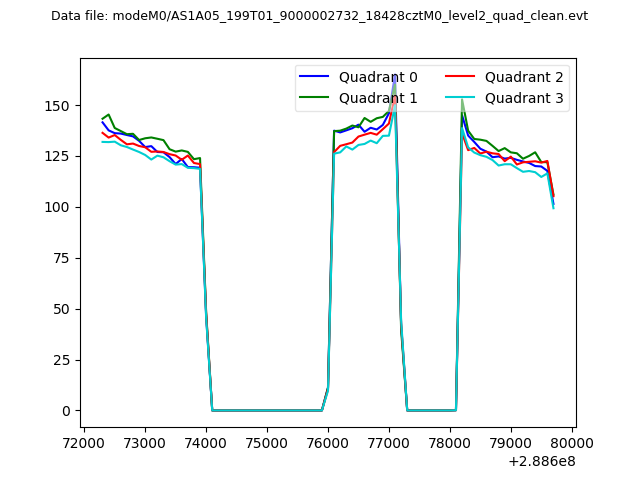 |
|
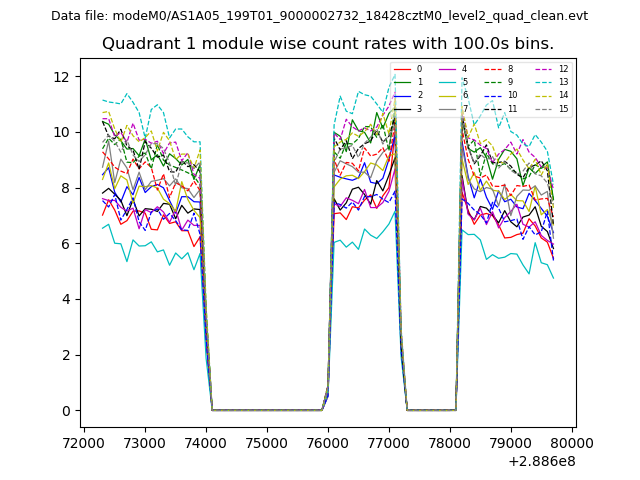
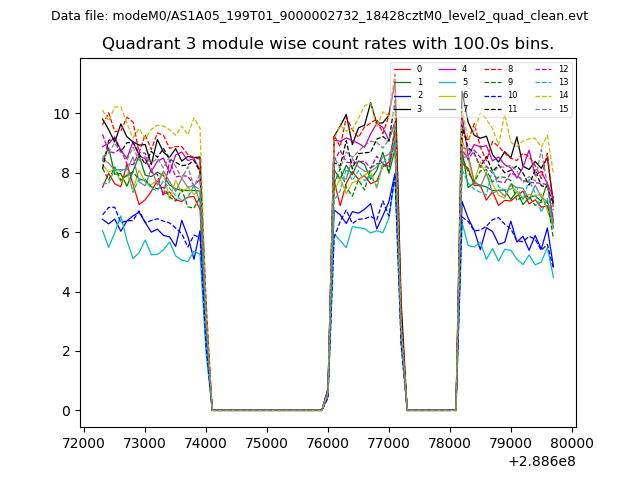
| Module-wise count rates for Quadrant A Data is divided into 100 sec bins |
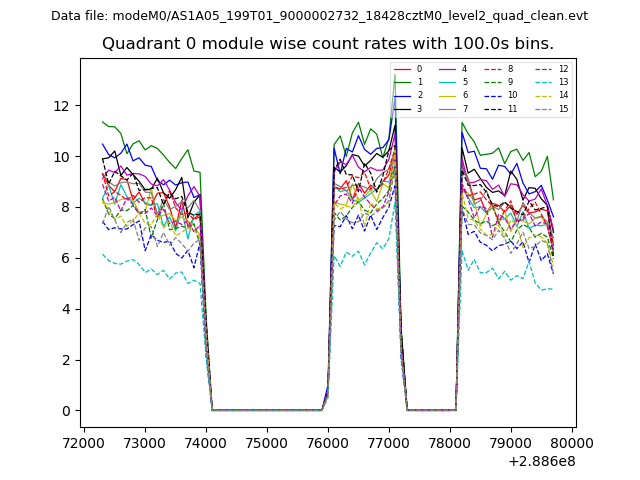 |
 |
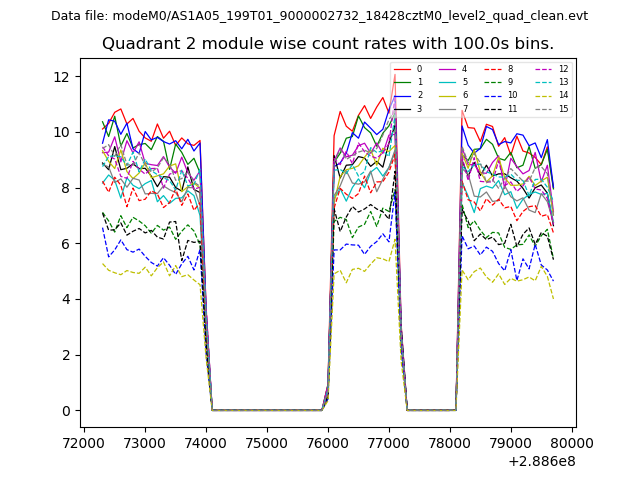
| Module-wise count rates for Quadrant B Data is divided into 100 sec bins |
 |
 |
| Module-wise count rates for Quadrant C Data is divided into 100 sec bins |
 |
 |
| Module-wise count rates for Quadrant D Data is divided into 100 sec bins |
 |
 |
| Parameter | Plot |
|---|---|
| CZT HV Monitor | 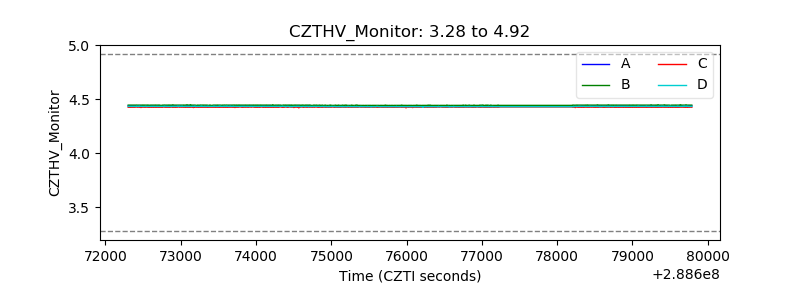 |
| D_VDD | 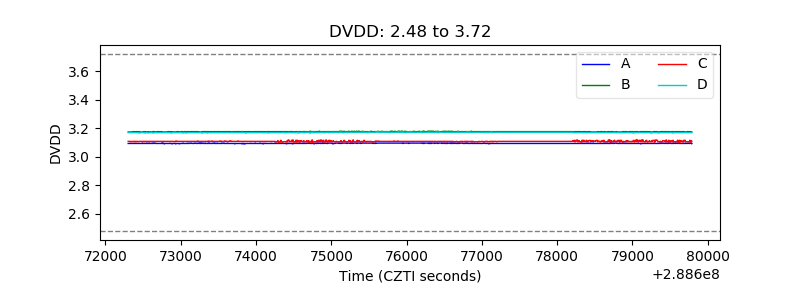 |
| Temperature 1 |  |
| Veto HV Monitor | 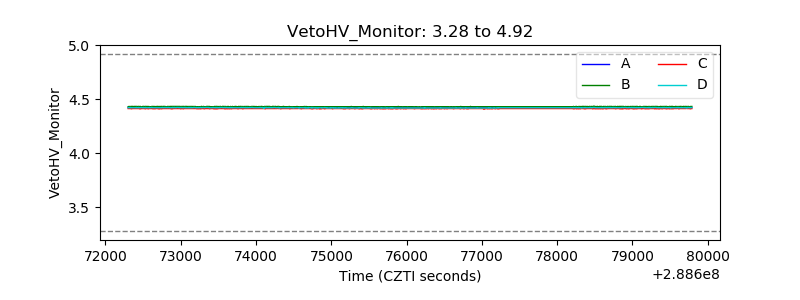 |
| Veto LLD | 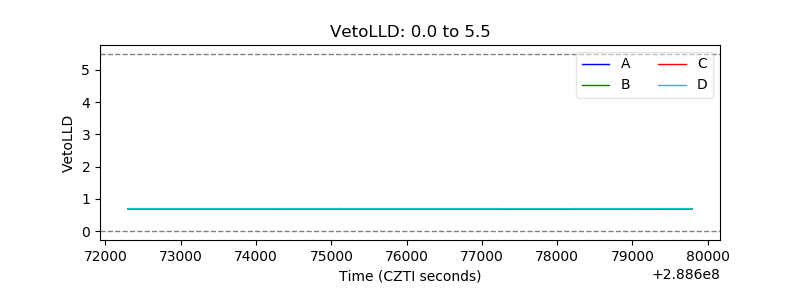 |
| Alpha Counter | 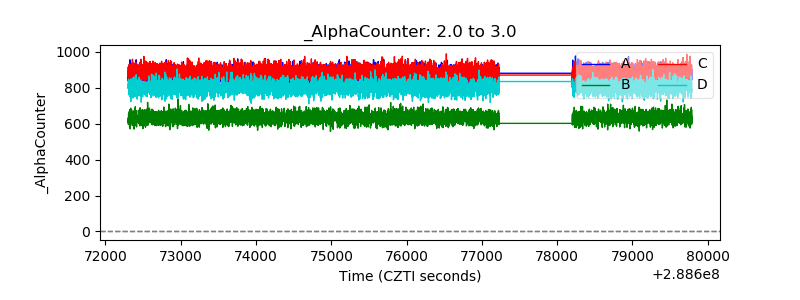 |
| _CPM_Rate | 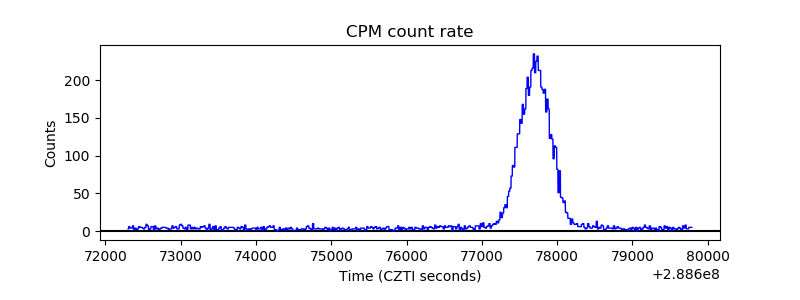 |
| CZT Counter | 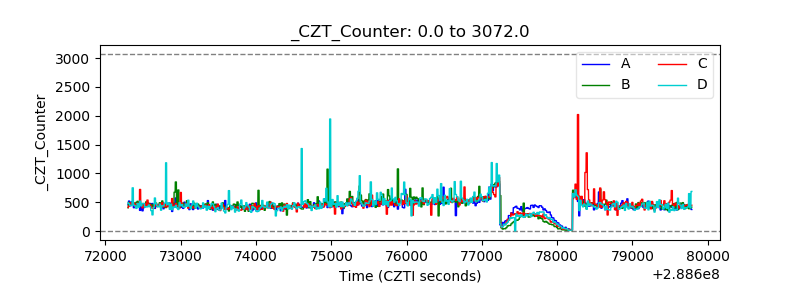 |
| +2.5 Volts monitor |  |
| +5 Volts monitor | 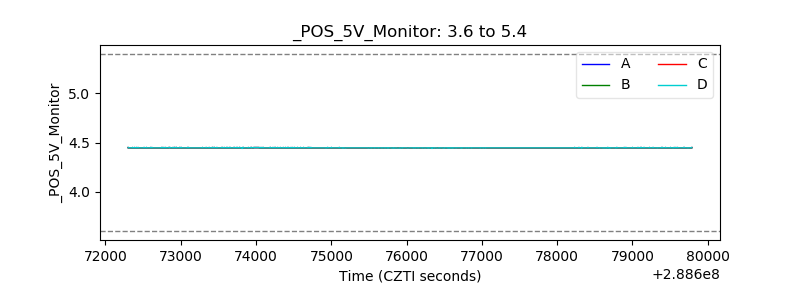 |
| _ROLL_ROT | 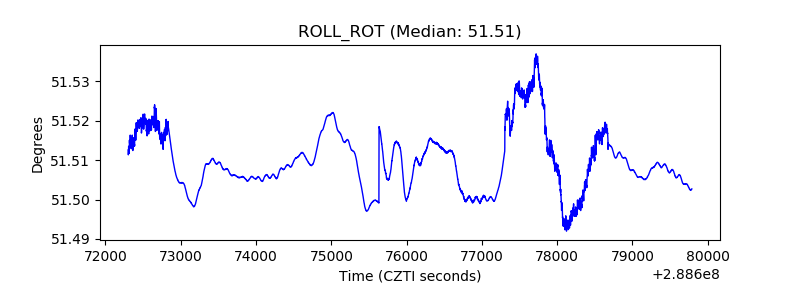 |
| _Roll_DEC |  |
| _Roll_RA | 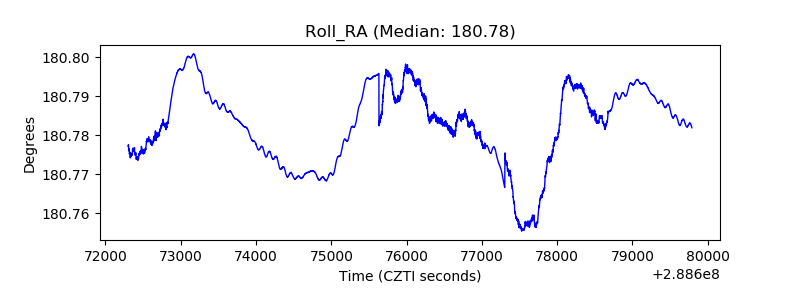 |
| Veto Counter | 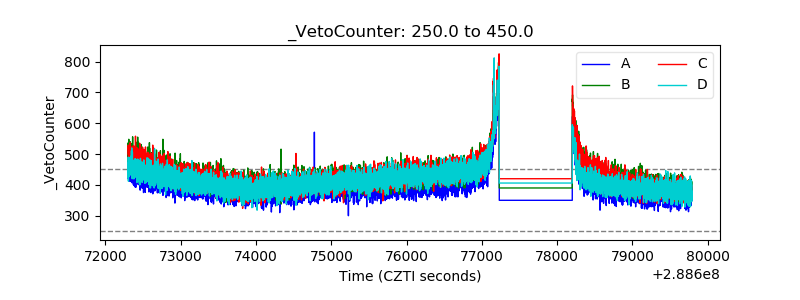 |