| Param | Original file | Final file |
|---|---|---|
| Filename | modeM0/AS1A05_199T01_9000002732_18430cztM0_level2.evt | modeM0/AS1A05_199T01_9000002732_18430cztM0_level2_quad_clean.evt |
| Size (bytes) | 486,475,200 | 89,277,120 |
| Size | 463.9 MB | 85.1 MB |
| Events in quadrant A | 3,298,774 | 553,075 |
| Events in quadrant B | 3,483,802 | 568,299 |
| Events in quadrant C | 3,361,737 | 546,738 |
| Events in quadrant D | 4,099,178 | 533,811 |
| Mode M0 | |||
|---|---|---|---|
| Quadrant | BADHDUFLAG | Total packets | Discarded packets |
| A | 0 | 14752 | 1 |
| B | 0 | 15167 | 1 |
| C | 0 | 14755 | 1 |
| D | 0 | 17152 | 2 |
| Mode SS | |||
|---|---|---|---|
| Quadrant | BADHDUFLAG | Total packets | Discarded packets |
| A | 0 | 146 | 0 |
| B | 0 | 146 | 0 |
| C | 0 | 146 | 0 |
| D | 0 | 146 | 0 |
| Mode M9 | |||
|---|---|---|---|
| Quadrant | BADHDUFLAG | Total packets | Discarded packets |
| A | 0 | 2 | 0 |
| B | 0 | 2 | 0 |
| C | 0 | 2 | 0 |
| D | 0 | 2 | 0 |
| Quadrant | Total seconds | Saturated seconds | Saturation percentage |
|---|---|---|---|
| A | 7199 | 183 | 2.542020% |
| B | 7199 | 236 | 3.278233% |
| C | 7199 | 197 | 2.736491% |
| D | 7198 | 211 | 2.931370% |
Noise dominated data is calculated using 1-second bins in cleaned event files. If a bin has >2000 counts, and if more than 50% of those come from <1% of pixels, then it is considered to be noise-dominated and hence unusable.
| Quadrant | # 1 sec bins | Bins with >0 counts | Bins with >2000 counts | High rate bins dominated by noise | Noise dominated (total time) | Noise dominated (detector-on time) | Marked lightcurve |
|---|---|---|---|---|---|---|---|
| A | 7389 | 7200 | 0 | 0 | 0.00% | 0.00% |  |
| B | 7389 | 7200 | 43 | 43 | 0.58% | 0.60% |  |
| C | 7389 | 7200 | 0 | 0 | 0.00% | 0.00% |  |
| D | 7388 | 7199 | 43 | 43 | 0.58% | 0.60% |  |
Top three noisy pixels from each quadrant. If the there are fewer than three noisy pixels in the level2.evt file, extra rows are filled as -1
| Pixel properties | Quadrant properties | ||||||
|---|---|---|---|---|---|---|---|
| Quadrant | DetID | PixID | Counts | Sigma | Mean | Median | Sigma |
| A | 0 | 226 | 7402 | 37.98 | 855 | 835 | 172.9 |
| A | 3 | 137 | 6908 | 35.12 | 855 | 835 | 172.9 |
| A | 12 | 194 | 6227 | 31.19 | 855 | 835 | 172.9 |
| B | 10 | 245 | 137008 | 828.62 | 853 | 831 | 164.3 |
| B | 12 | 111 | 19916 | 116.13 | 853 | 831 | 164.3 |
| B | 11 | 111 | 17432 | 101.02 | 853 | 831 | 164.3 |
| C | 14 | 238 | 125710 | 649.73 | 819 | 820 | 192.2 |
| C | 3 | 233 | 31851 | 161.44 | 819 | 820 | 192.2 |
| C | 13 | 61 | 5894 | 26.4 | 819 | 820 | 192.2 |
| D | 10 | 66 | 476942 | 2344.57 | 830 | 806 | 203.1 |
| D | 1 | 52 | 347113 | 1705.27 | 830 | 806 | 203.1 |
| D | 2 | 234 | 33958 | 163.25 | 830 | 806 | 203.1 |
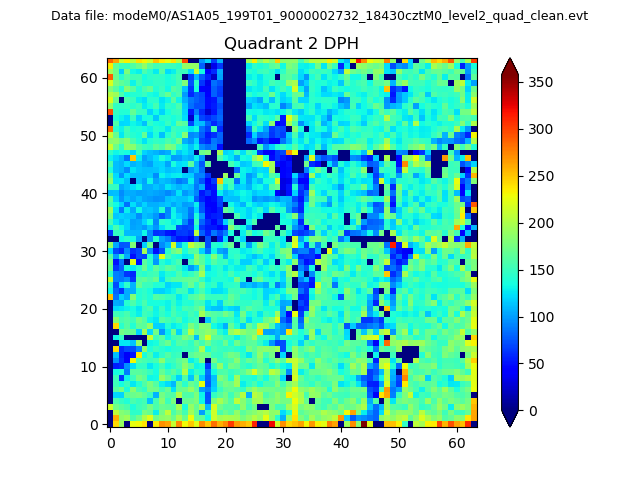
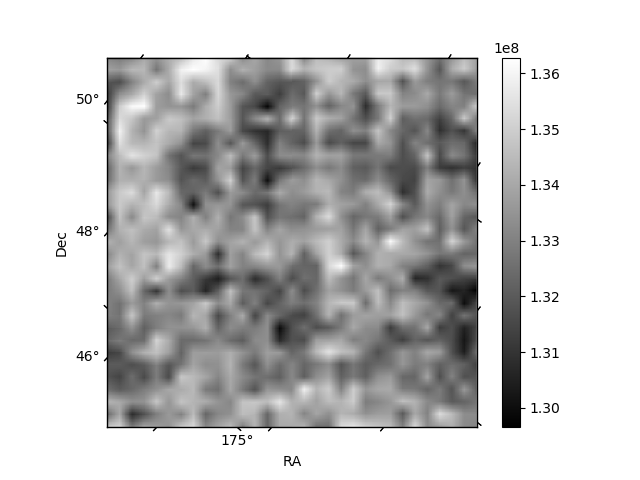
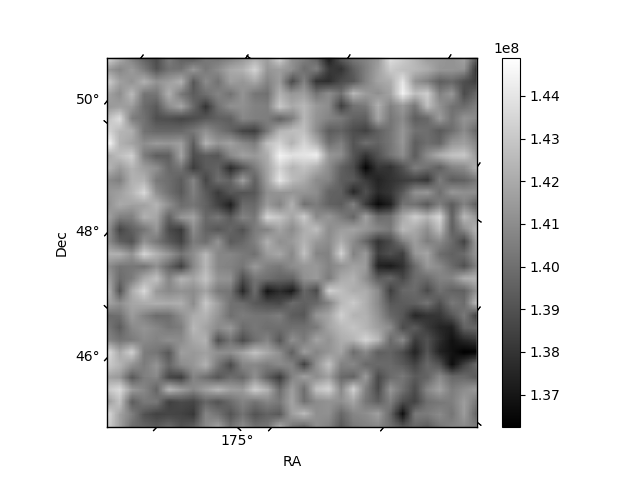
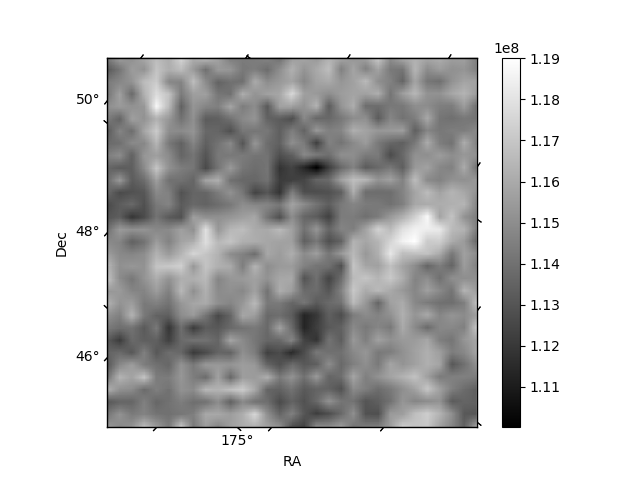
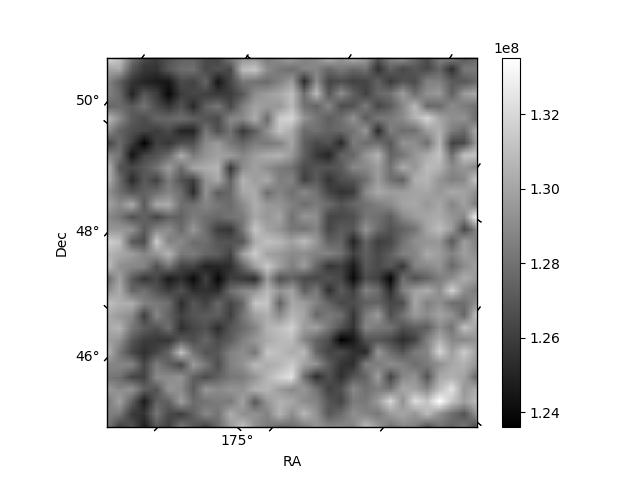
Histogram calculated using DETX and DETY for each event in the final _common_clean file
| Quadrant A | 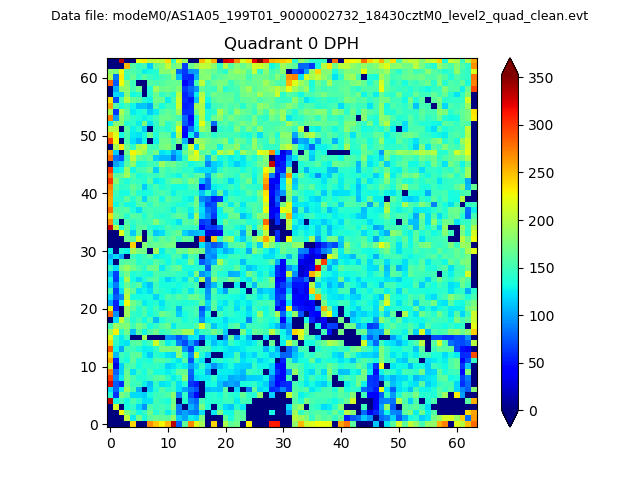 |
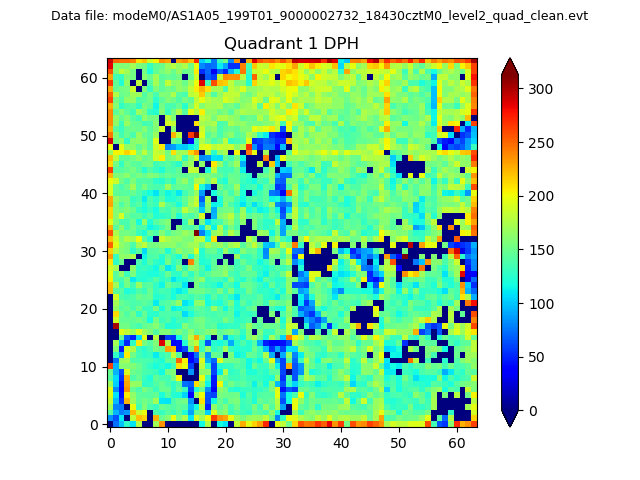 |
Quadrant B |
|---|---|---|---|
| Quadrant D | 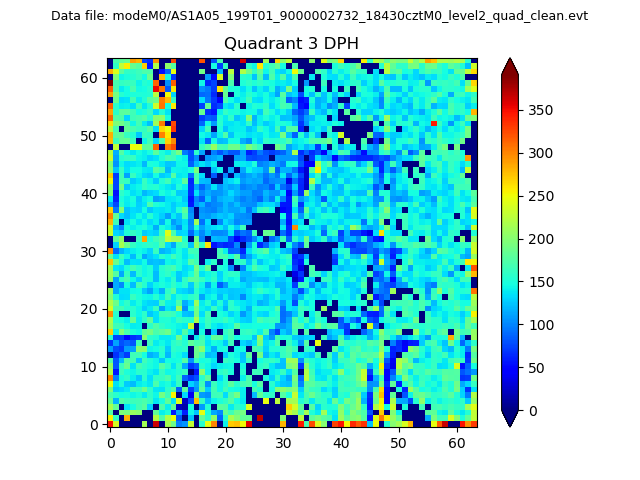 |
 |
Quadrant C |
| Plot type | Count rate plots | Images |
|---|---|---|
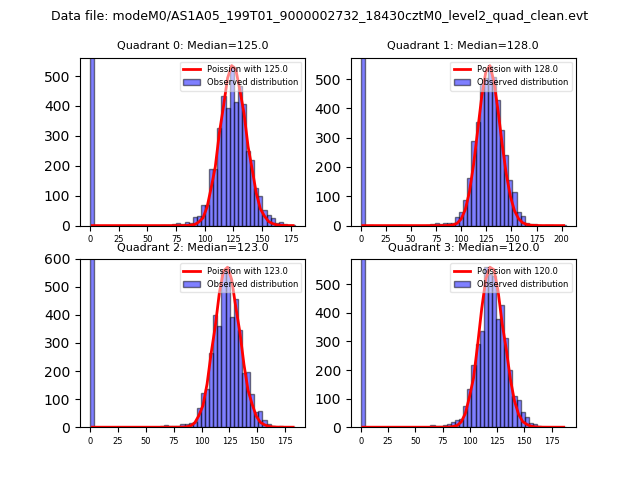
| Comparison with Poisson distribution Blue bars denote a histogram of data divided into 1 sec bins. Red curve is a Poisson curve with rate = median count rate of data. |
 |
 |
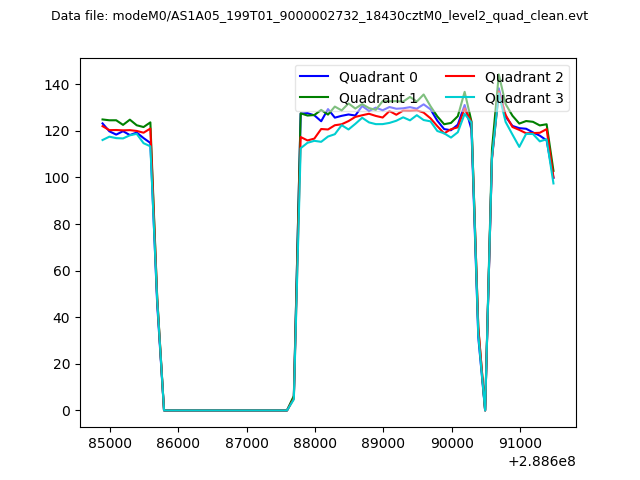
| Quadrant-wise count rates Data is divided into 100 sec bins |
 |
|
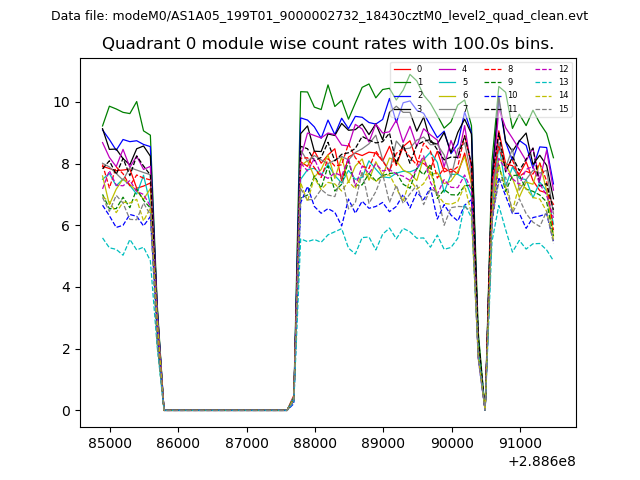
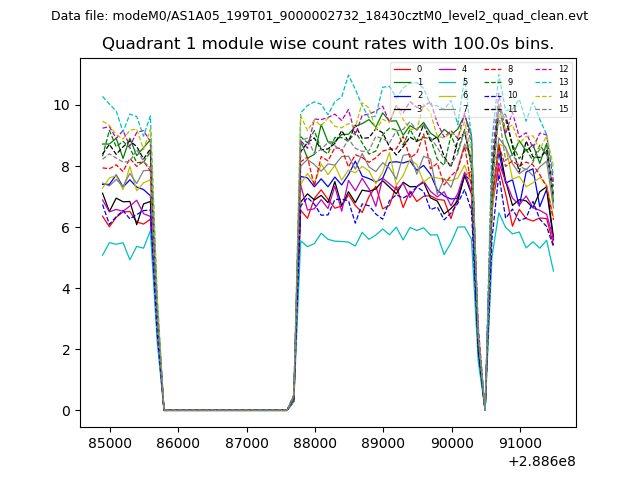
| Module-wise count rates for Quadrant A Data is divided into 100 sec bins |
 |
 |
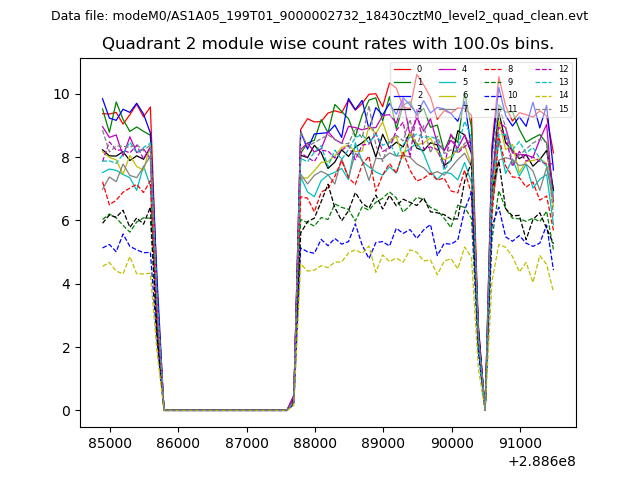
| Module-wise count rates for Quadrant B Data is divided into 100 sec bins |
 |
 |
| Module-wise count rates for Quadrant C Data is divided into 100 sec bins |
 |
 |
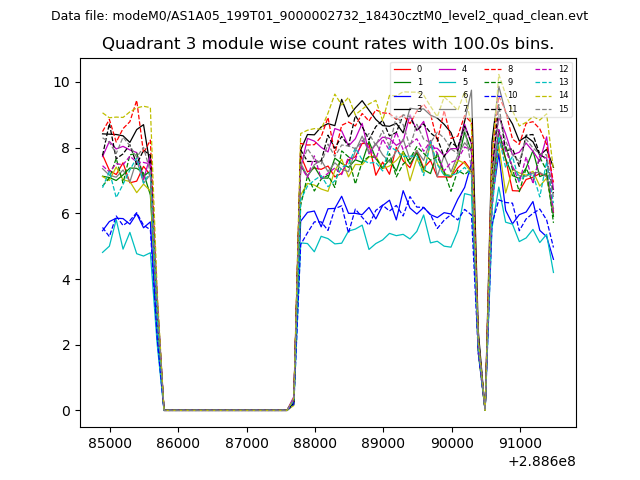
| Module-wise count rates for Quadrant D Data is divided into 100 sec bins |
 |
 |
| Parameter | Plot |
|---|---|
| CZT HV Monitor | 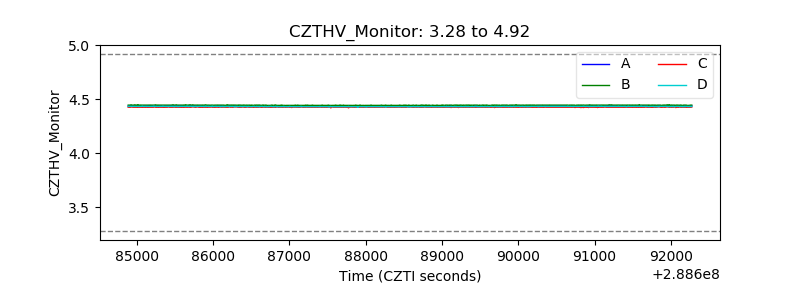 |
| D_VDD | 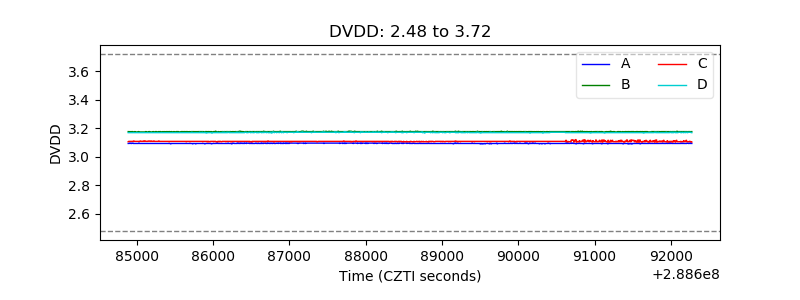 |
| Temperature 1 |  |
| Veto HV Monitor | 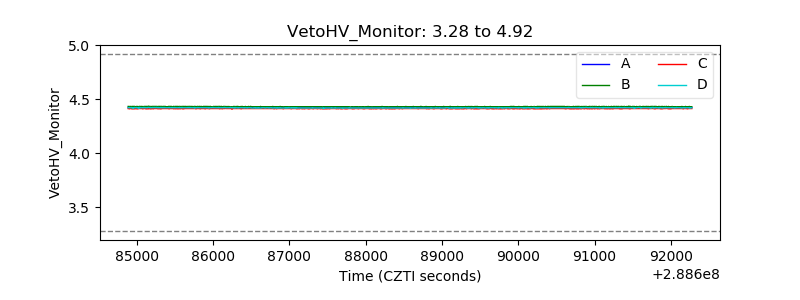 |
| Veto LLD | 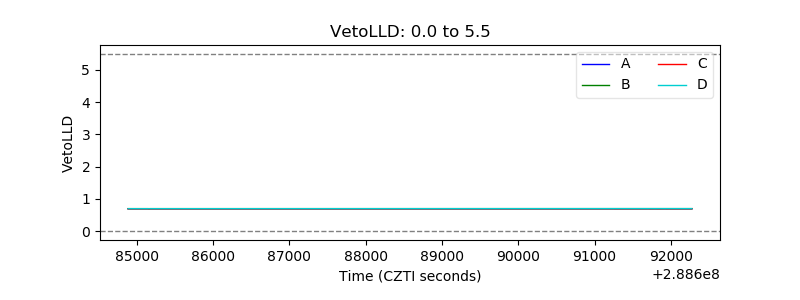 |
| Alpha Counter | 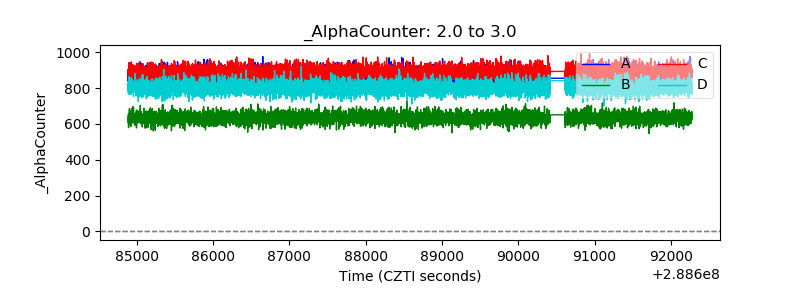 |
| _CPM_Rate | 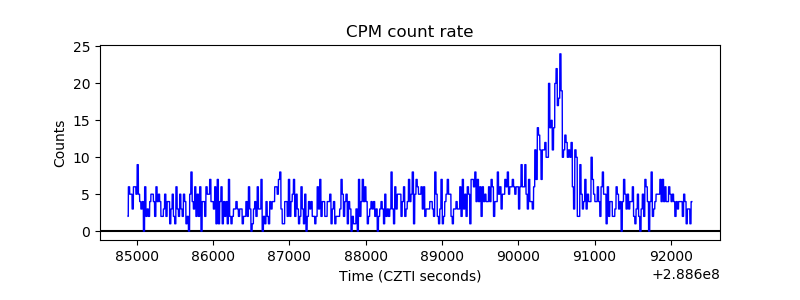 |
| CZT Counter | 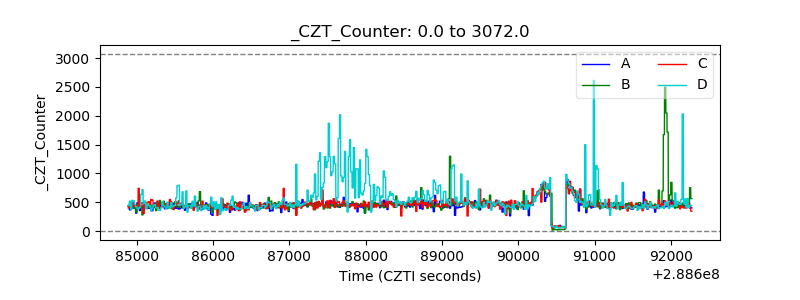 |
| +2.5 Volts monitor |  |
| +5 Volts monitor |  |
| _ROLL_ROT | 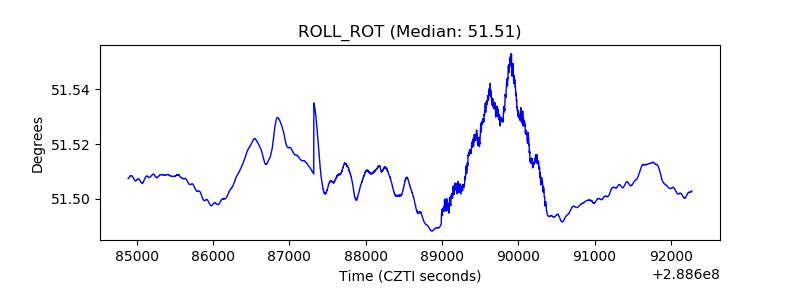 |
| _Roll_DEC |  |
| _Roll_RA | 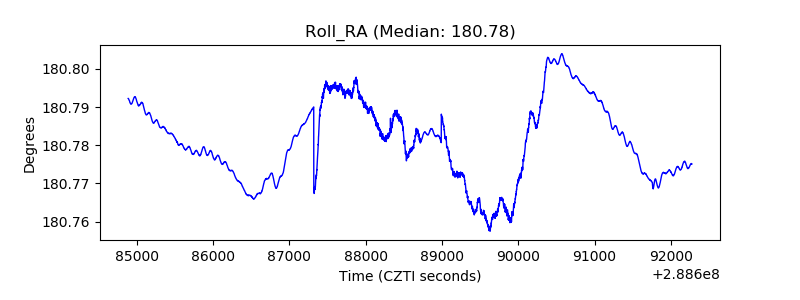 |
| Veto Counter | 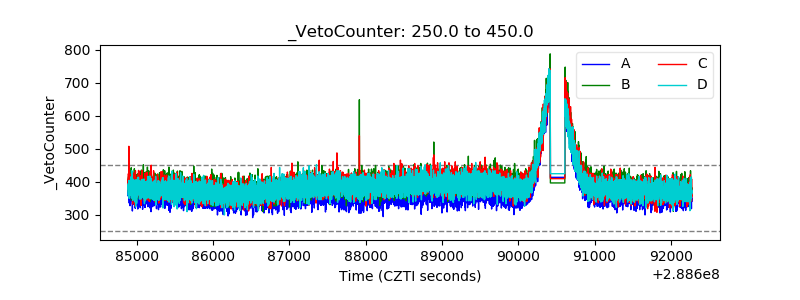 |