| Param | Original file | Final file |
|---|---|---|
| Filename | modeM0/AS1A05_199T01_9000002732_18431cztM0_level2.evt | modeM0/AS1A05_199T01_9000002732_18431cztM0_level2_quad_clean.evt |
| Size (bytes) | 546,863,040 | 96,039,360 |
| Size | 521.5 MB | 91.6 MB |
| Events in quadrant A | 3,741,207 | 594,998 |
| Events in quadrant B | 4,192,514 | 605,026 |
| Events in quadrant C | 3,745,968 | 589,182 |
| Events in quadrant D | 4,350,697 | 574,823 |
| Mode M0 | |||
|---|---|---|---|
| Quadrant | BADHDUFLAG | Total packets | Discarded packets |
| A | 0 | 16403 | 2 |
| B | 0 | 17578 | 2 |
| C | 0 | 16301 | 2 |
| D | 0 | 18198 | 2 |
| Mode SS | |||
|---|---|---|---|
| Quadrant | BADHDUFLAG | Total packets | Discarded packets |
| A | 0 | 162 | 0 |
| B | 0 | 162 | 0 |
| C | 0 | 162 | 0 |
| D | 0 | 162 | 0 |
| Mode M9 | |||
|---|---|---|---|
| Quadrant | BADHDUFLAG | Total packets | Discarded packets |
| A | 0 | 4 | 0 |
| B | 0 | 4 | 0 |
| C | 0 | 4 | 0 |
| D | 0 | 4 | 0 |
| Quadrant | Total seconds | Saturated seconds | Saturation percentage |
|---|---|---|---|
| A | 7812 | 361 | 4.621096% |
| B | 7813 | 497 | 6.361193% |
| C | 7813 | 373 | 4.774094% |
| D | 7813 | 355 | 4.543709% |
Noise dominated data is calculated using 1-second bins in cleaned event files. If a bin has >2000 counts, and if more than 50% of those come from <1% of pixels, then it is considered to be noise-dominated and hence unusable.
| Quadrant | # 1 sec bins | Bins with >0 counts | Bins with >2000 counts | High rate bins dominated by noise | Noise dominated (total time) | Noise dominated (detector-on time) | Marked lightcurve |
|---|---|---|---|---|---|---|---|
| A | 8222 | 7814 | 2 | 2 | 0.02% | 0.03% | 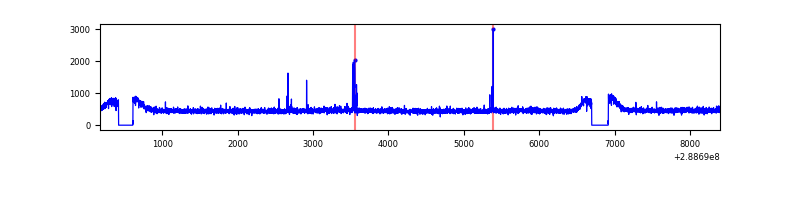 |
| B | 8223 | 7815 | 103 | 103 | 1.25% | 1.32% | 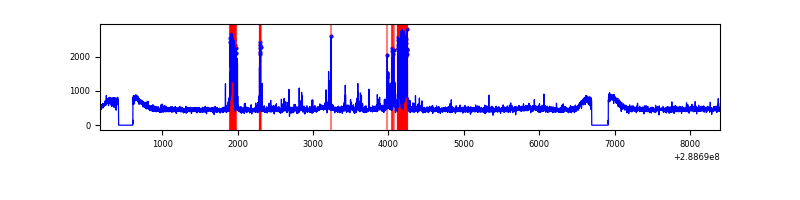 |
| C | 8223 | 7815 | 0 | 0 | 0.00% | 0.00% | 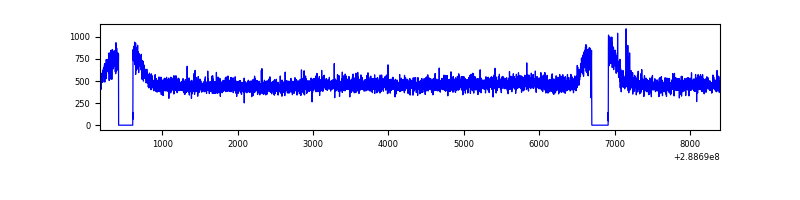 |
| D | 8223 | 7815 | 54 | 54 | 0.66% | 0.69% | 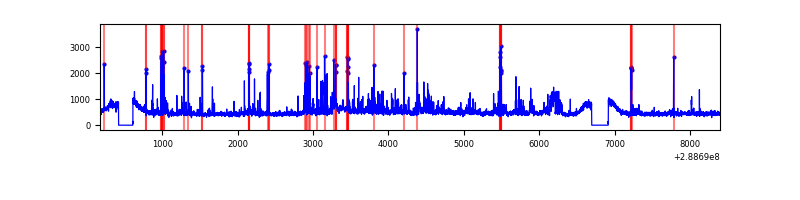 |
Top three noisy pixels from each quadrant. If the there are fewer than three noisy pixels in the level2.evt file, extra rows are filled as -1
| Pixel properties | Quadrant properties | ||||||
|---|---|---|---|---|---|---|---|
| Quadrant | DetID | PixID | Counts | Sigma | Mean | Median | Sigma |
| A | 15 | 174 | 29045 | 144.05 | 958 | 931 | 195.2 |
| A | 4 | 2 | 19325 | 94.25 | 958 | 931 | 195.2 |
| A | 14 | 238 | 9089 | 41.8 | 958 | 931 | 195.2 |
| B | 0 | 244 | 255294 | 1380.29 | 950 | 924 | 184.3 |
| B | 10 | 245 | 184222 | 994.63 | 950 | 924 | 184.3 |
| B | 12 | 111 | 22531 | 117.24 | 950 | 924 | 184.3 |
| C | 14 | 238 | 138592 | 639.42 | 914 | 917 | 215.3 |
| C | 3 | 233 | 28898 | 129.96 | 914 | 917 | 215.3 |
| C | 5 | 112 | 6649 | 26.62 | 914 | 917 | 215.3 |
| D | 1 | 52 | 425148 | 1850.34 | 932 | 902 | 229.3 |
| D | 13 | 168 | 152498 | 661.18 | 932 | 902 | 229.3 |
| D | 10 | 66 | 66073 | 284.24 | 932 | 902 | 229.3 |
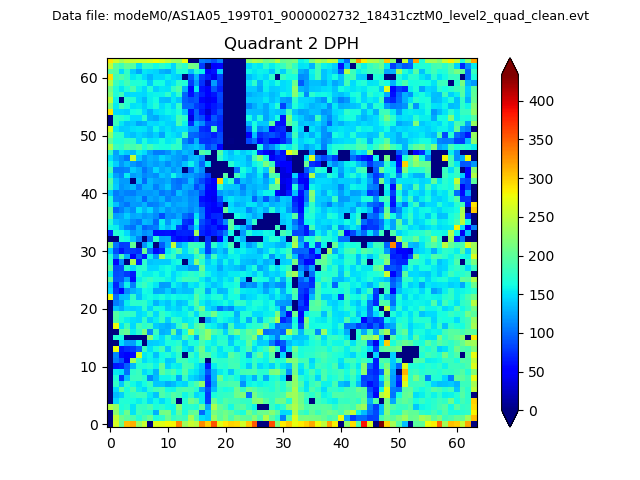
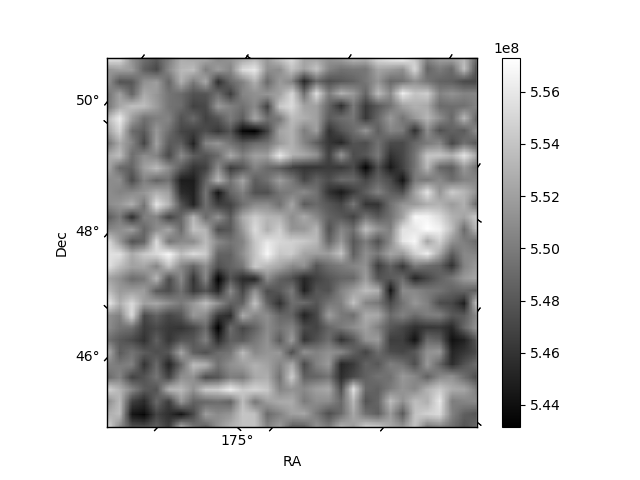
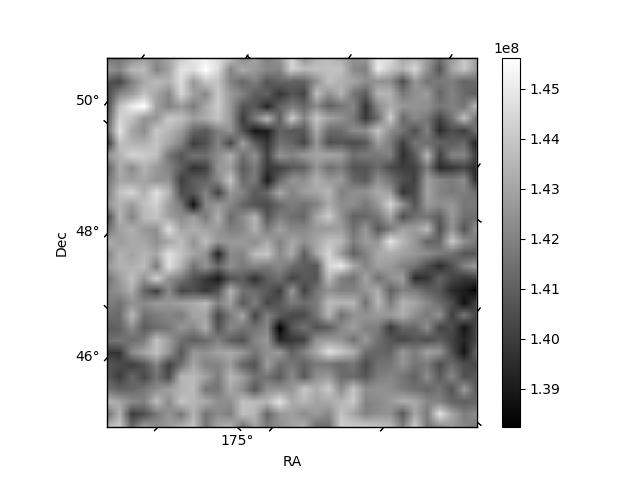
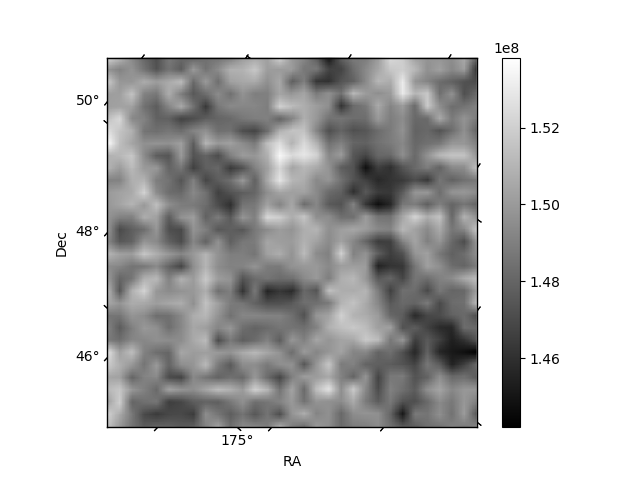
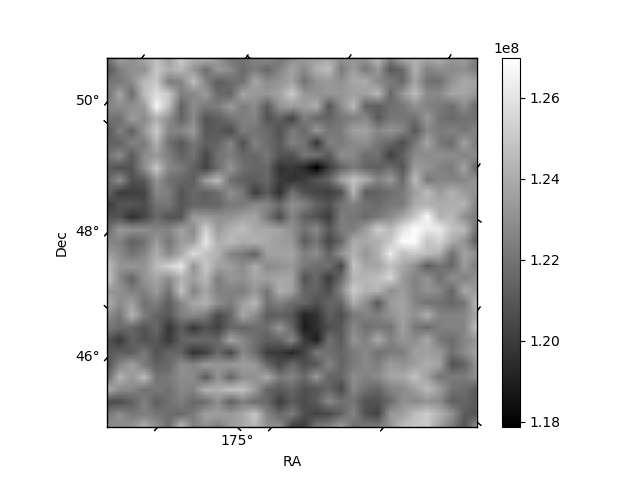
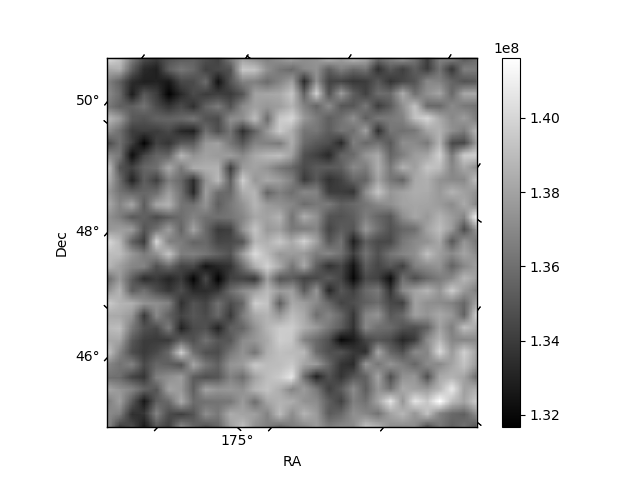
Histogram calculated using DETX and DETY for each event in the final _common_clean file
| Quadrant A | 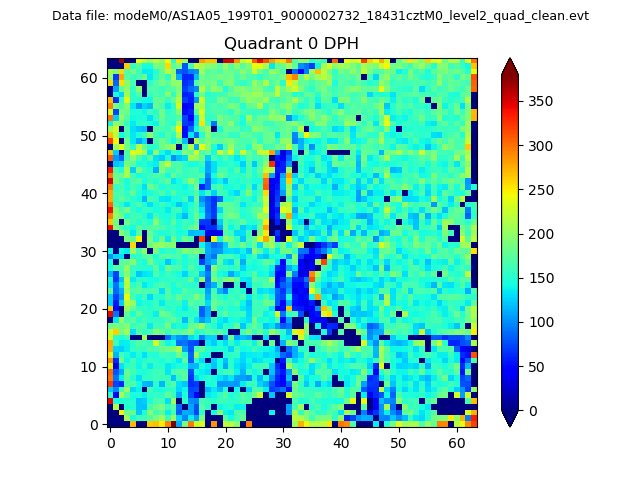 |
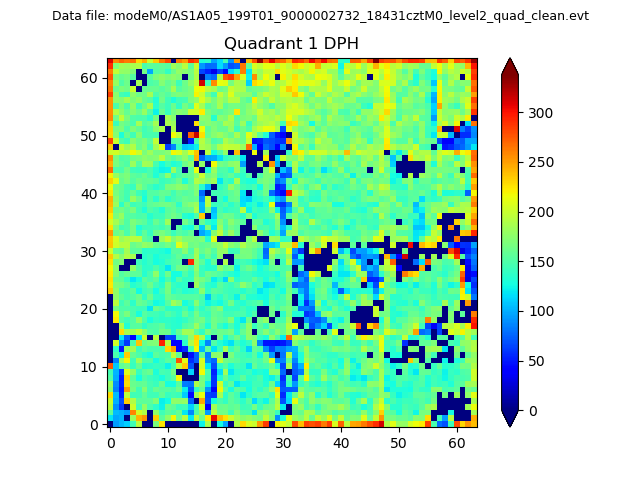 |
Quadrant B |
|---|---|---|---|
| Quadrant D | 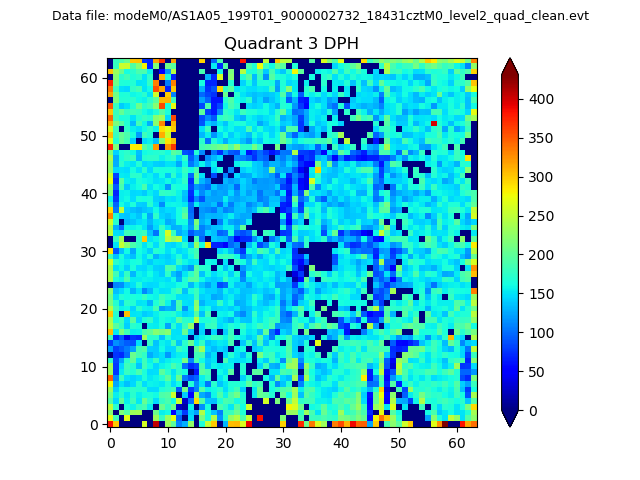 |
 |
Quadrant C |
| Plot type | Count rate plots | Images |
|---|---|---|
| Comparison with Poisson distribution Blue bars denote a histogram of data divided into 1 sec bins. Red curve is a Poisson curve with rate = median count rate of data. |
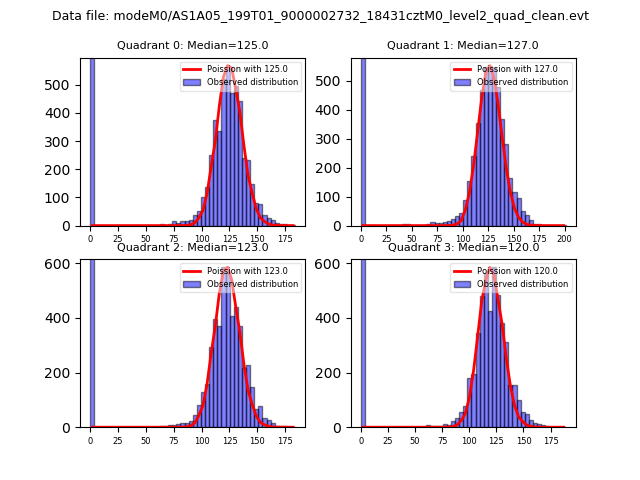 |
 |
| Quadrant-wise count rates Data is divided into 100 sec bins |
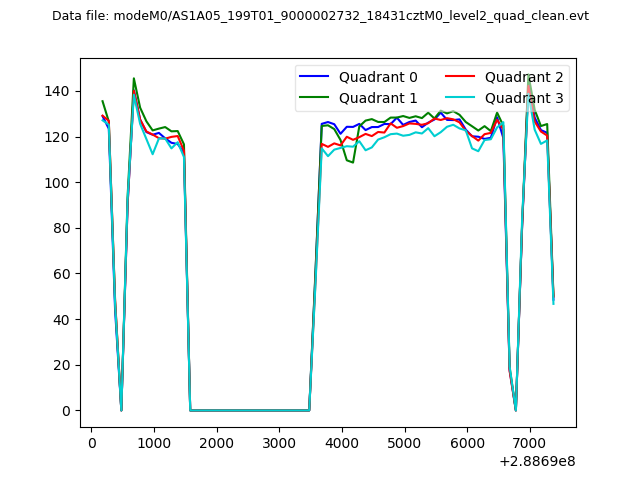 |
|
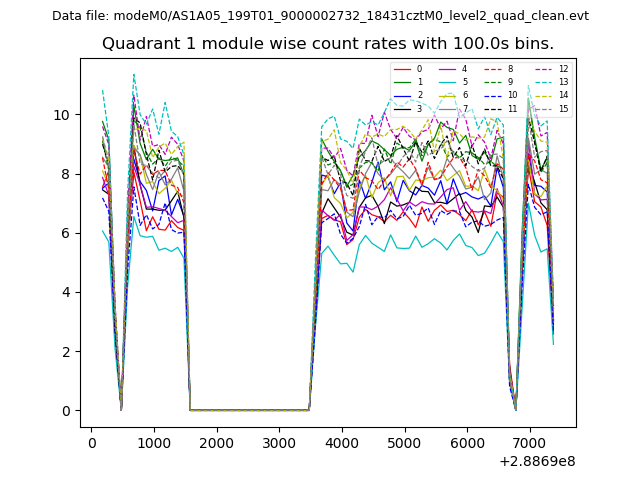
| Module-wise count rates for Quadrant A Data is divided into 100 sec bins |
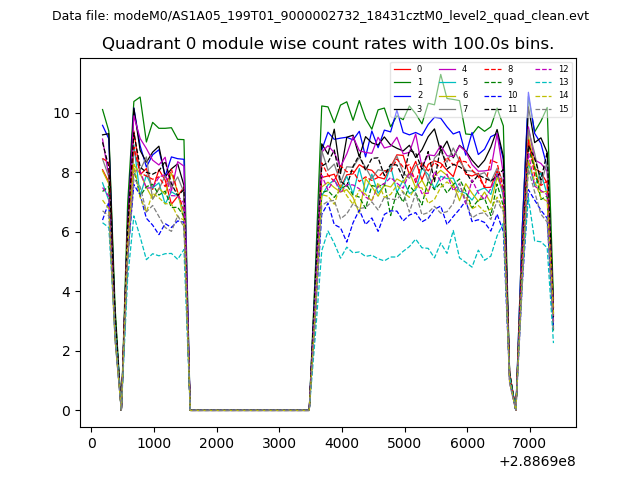 |
 |
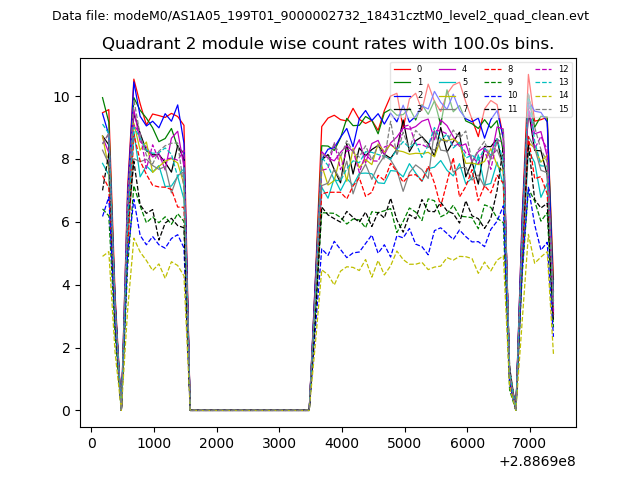
| Module-wise count rates for Quadrant B Data is divided into 100 sec bins |
 |
 |
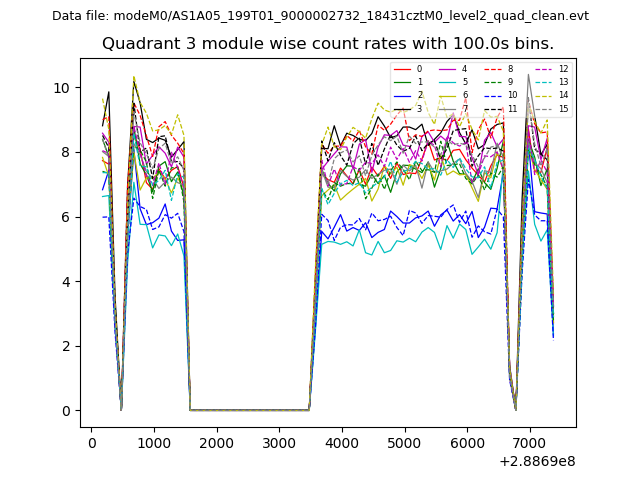
| Module-wise count rates for Quadrant C Data is divided into 100 sec bins |
 |
 |
| Module-wise count rates for Quadrant D Data is divided into 100 sec bins |
 |
 |
| Parameter | Plot |
|---|---|
| CZT HV Monitor | 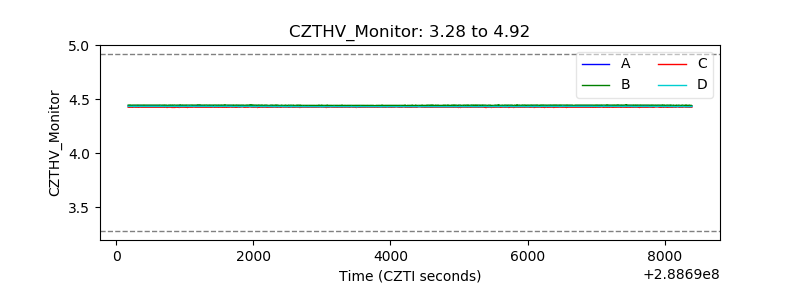 |
| D_VDD | 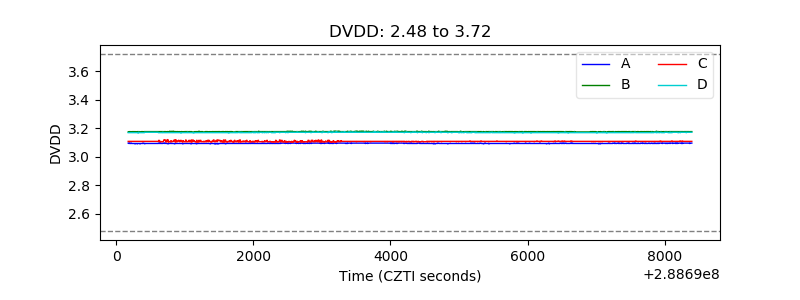 |
| Temperature 1 | 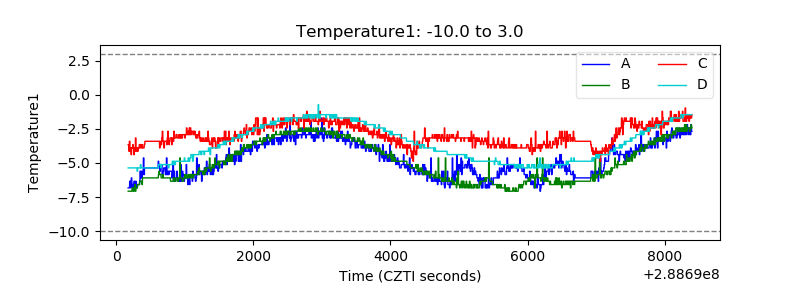 |
| Veto HV Monitor | 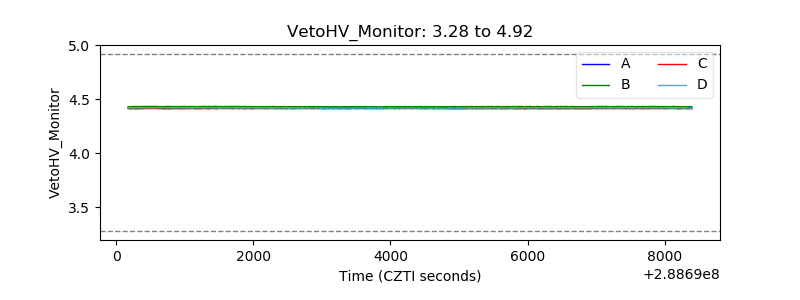 |
| Veto LLD | 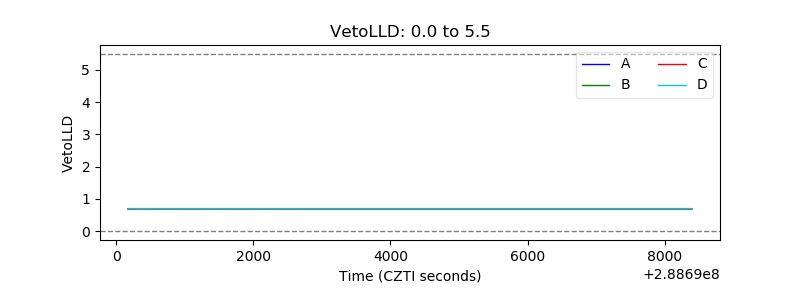 |
| Alpha Counter | 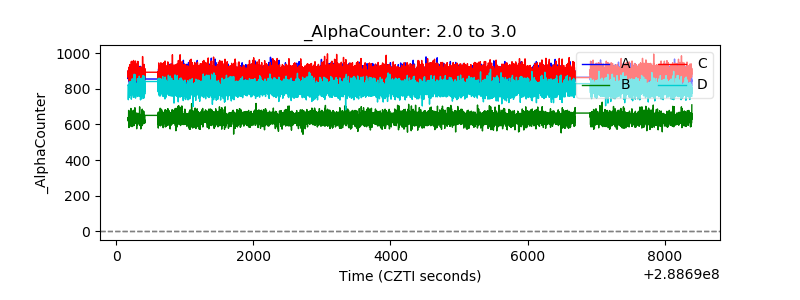 |
| _CPM_Rate | 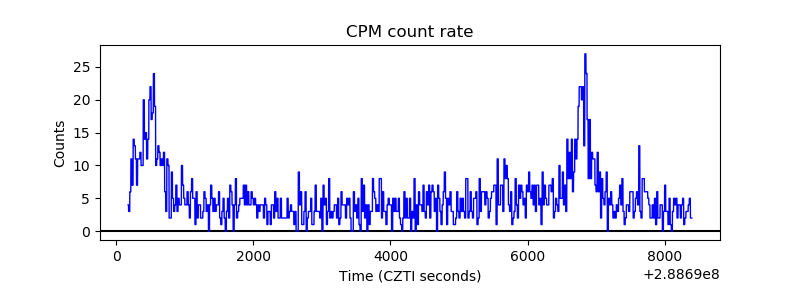 |
| CZT Counter | 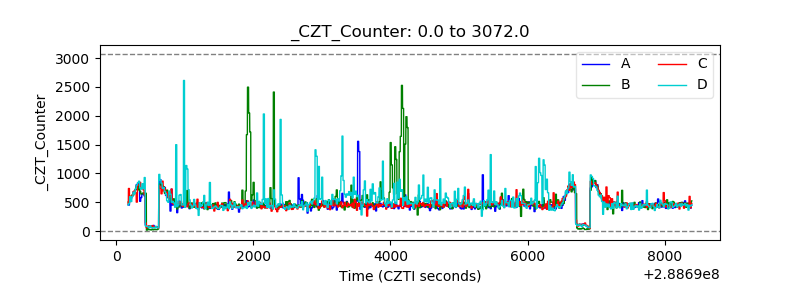 |
| +2.5 Volts monitor |  |
| +5 Volts monitor |  |
| _ROLL_ROT | 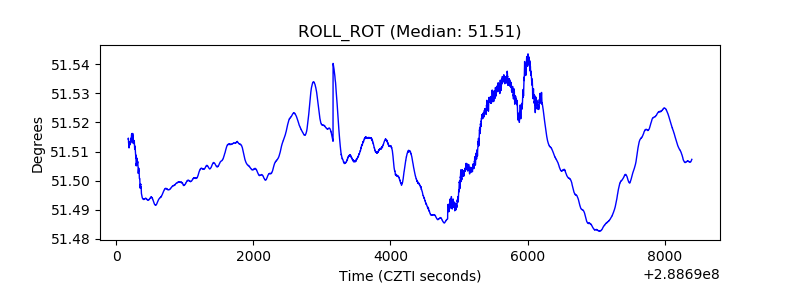 |
| _Roll_DEC | 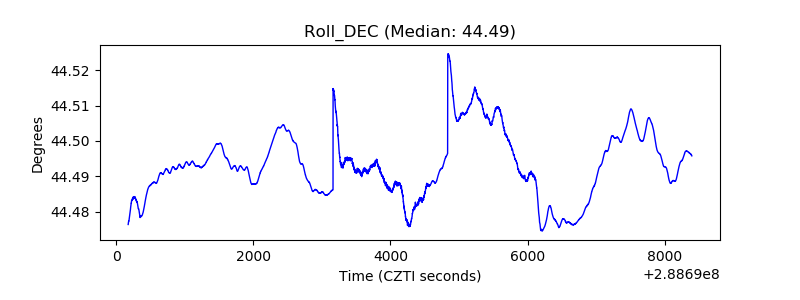 |
| _Roll_RA | 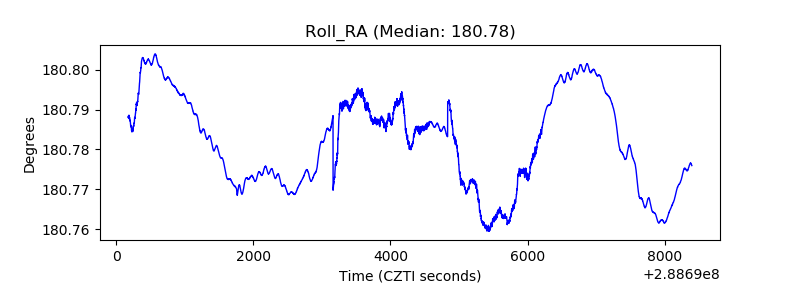 |
| Veto Counter | 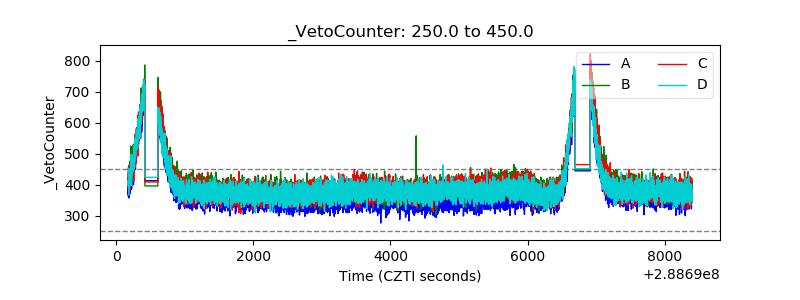 |