| Param | Original file | Final file |
|---|---|---|
| Filename | modeM0/AS1A05_199T01_9000002732_18437cztM0_level2.evt | modeM0/AS1A05_199T01_9000002732_18437cztM0_level2_quad_clean.evt |
| Size (bytes) | 494,066,880 | 102,216,960 |
| Size | 471.2 MB | 97.5 MB |
| Events in quadrant A | 3,470,500 | 654,440 |
| Events in quadrant B | 3,504,489 | 671,357 |
| Events in quadrant C | 3,500,818 | 649,217 |
| Events in quadrant D | 4,012,294 | 633,830 |
| Mode M0 | |||
|---|---|---|---|
| Quadrant | BADHDUFLAG | Total packets | Discarded packets |
| A | 0 | 15031 | 2 |
| B | 0 | 15077 | 2 |
| C | 0 | 15026 | 2 |
| D | 0 | 16750 | 2 |
| Mode SS | |||
|---|---|---|---|
| Quadrant | BADHDUFLAG | Total packets | Discarded packets |
| A | 0 | 144 | 0 |
| B | 0 | 144 | 0 |
| C | 0 | 144 | 0 |
| D | 0 | 144 | 0 |
| Mode M9 | |||
|---|---|---|---|
| Quadrant | BADHDUFLAG | Total packets | Discarded packets |
| A | 0 | 21 | 0 |
| B | 0 | 21 | 0 |
| C | 0 | 21 | 0 |
| D | 0 | 21 | 0 |
| Quadrant | Total seconds | Saturated seconds | Saturation percentage |
|---|---|---|---|
| A | 6989 | 77 | 1.101731% |
| B | 6990 | 112 | 1.602289% |
| C | 6990 | 128 | 1.831187% |
| D | 6990 | 149 | 2.131617% |
Noise dominated data is calculated using 1-second bins in cleaned event files. If a bin has >2000 counts, and if more than 50% of those come from <1% of pixels, then it is considered to be noise-dominated and hence unusable.
| Quadrant | # 1 sec bins | Bins with >0 counts | Bins with >2000 counts | High rate bins dominated by noise | Noise dominated (total time) | Noise dominated (detector-on time) | Marked lightcurve |
|---|---|---|---|---|---|---|---|
| A | 9099 | 6991 | 1 | 1 | 0.01% | 0.01% | 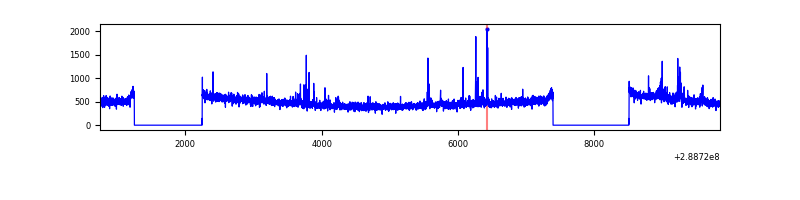 |
| B | 9100 | 6992 | 10 | 10 | 0.11% | 0.14% | 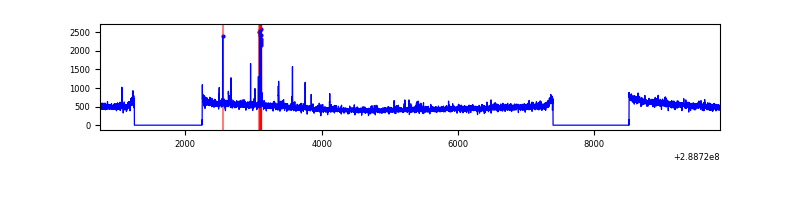 |
| C | 9100 | 6992 | 0 | 0 | 0.00% | 0.00% | 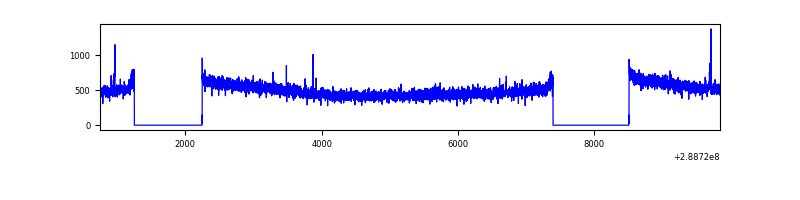 |
| D | 9100 | 6992 | 47 | 47 | 0.52% | 0.67% | 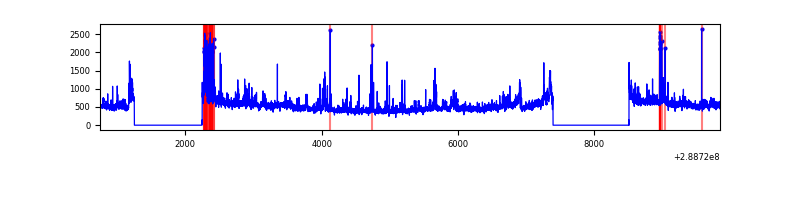 |
Top three noisy pixels from each quadrant. If the there are fewer than three noisy pixels in the level2.evt file, extra rows are filled as -1
| Pixel properties | Quadrant properties | ||||||
|---|---|---|---|---|---|---|---|
| Quadrant | DetID | PixID | Counts | Sigma | Mean | Median | Sigma |
| A | 14 | 238 | 87245 | 494.64 | 872 | 855 | 174.7 |
| A | 4 | 2 | 20170 | 110.59 | 872 | 855 | 174.7 |
| A | 15 | 174 | 9260 | 48.12 | 872 | 855 | 174.7 |
| B | 3 | 64 | 40827 | 240.05 | 875 | 852 | 166.5 |
| B | 10 | 245 | 38132 | 223.87 | 875 | 852 | 166.5 |
| B | 12 | 111 | 19777 | 113.64 | 875 | 852 | 166.5 |
| C | 14 | 238 | 130962 | 656.42 | 849 | 854 | 198.2 |
| C | 3 | 233 | 37424 | 184.5 | 849 | 854 | 198.2 |
| C | 9 | 54 | 20603 | 99.64 | 849 | 854 | 198.2 |
| D | 1 | 52 | 518318 | 2480.09 | 855 | 828 | 208.7 |
| D | 12 | 110 | 158157 | 754.0 | 855 | 828 | 208.7 |
| D | 13 | 168 | 90903 | 431.69 | 855 | 828 | 208.7 |
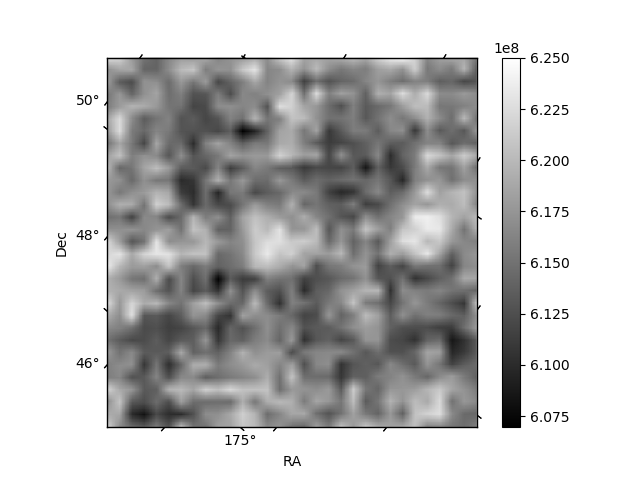
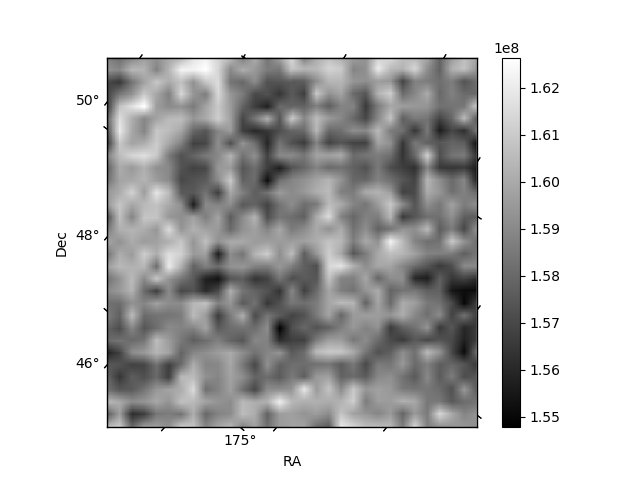
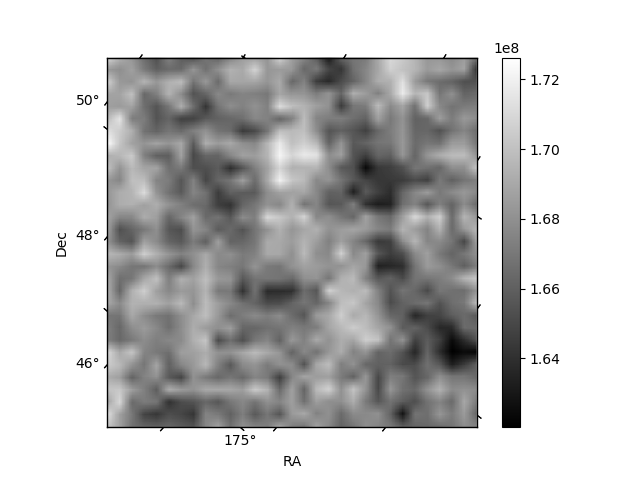
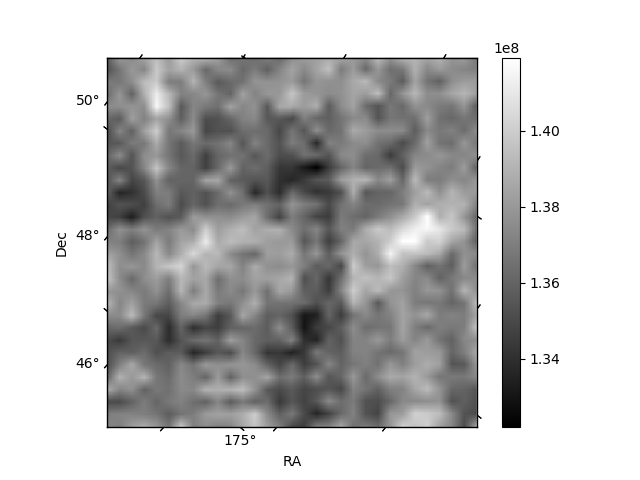
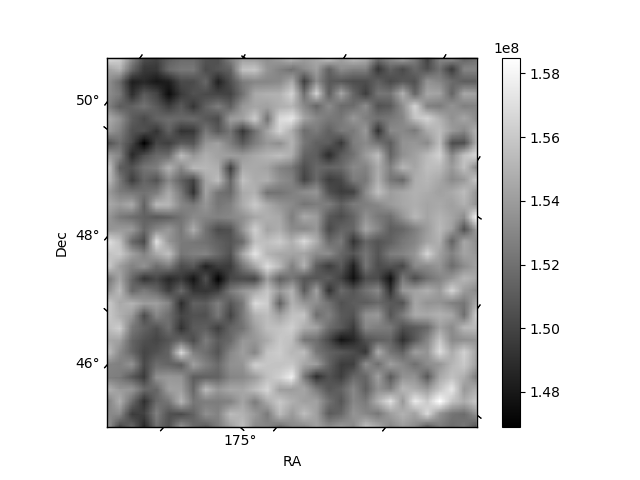
Histogram calculated using DETX and DETY for each event in the final _common_clean file
| Quadrant A | 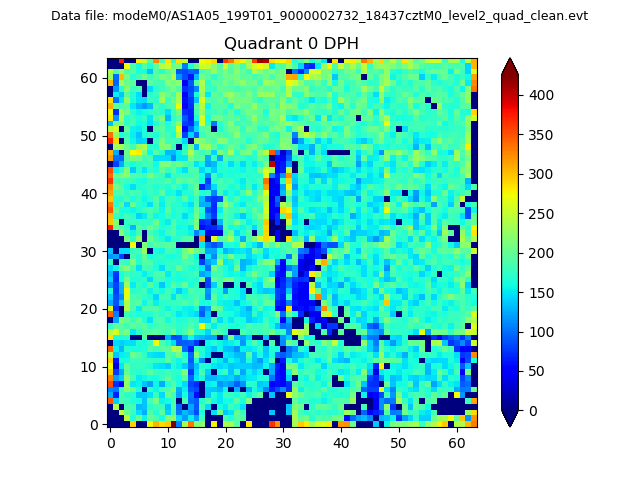 |
 |
Quadrant B |
|---|---|---|---|
| Quadrant D | 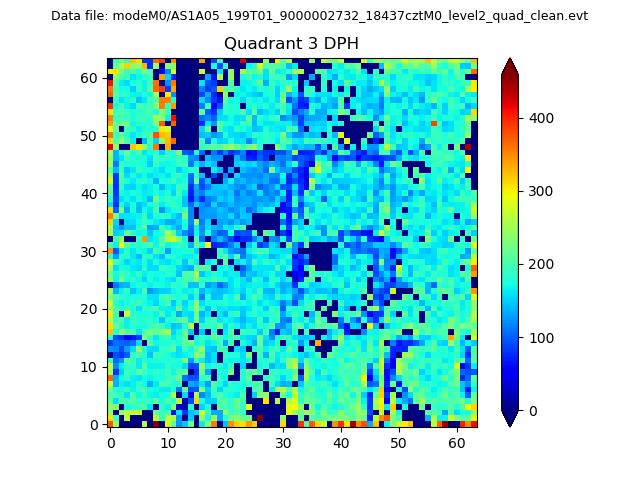 |
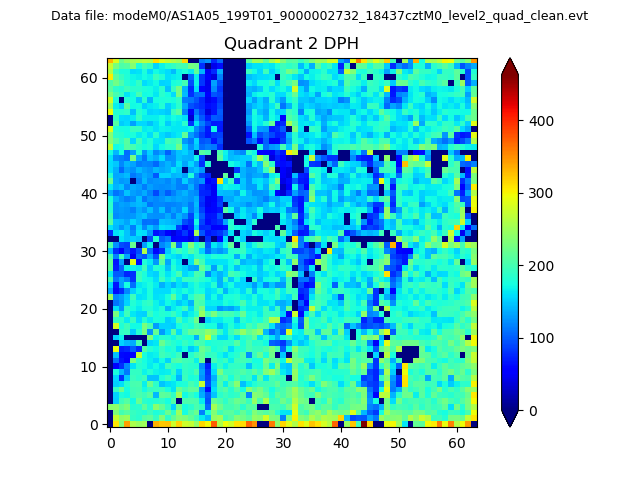 |
Quadrant C |
| Plot type | Count rate plots | Images |
|---|---|---|
| Comparison with Poisson distribution Blue bars denote a histogram of data divided into 1 sec bins. Red curve is a Poisson curve with rate = median count rate of data. |
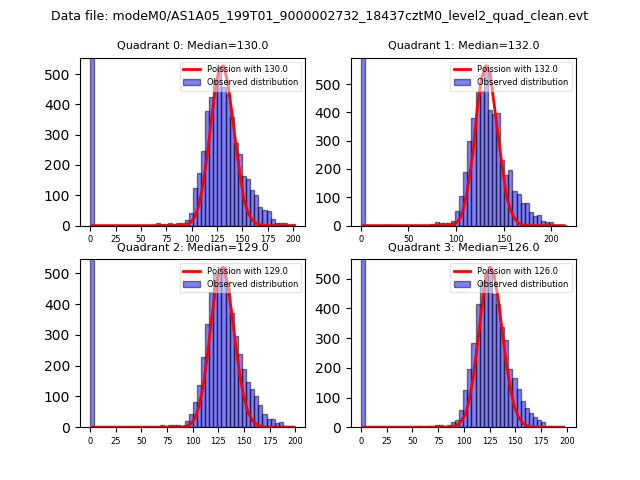 |
 |
| Quadrant-wise count rates Data is divided into 100 sec bins |
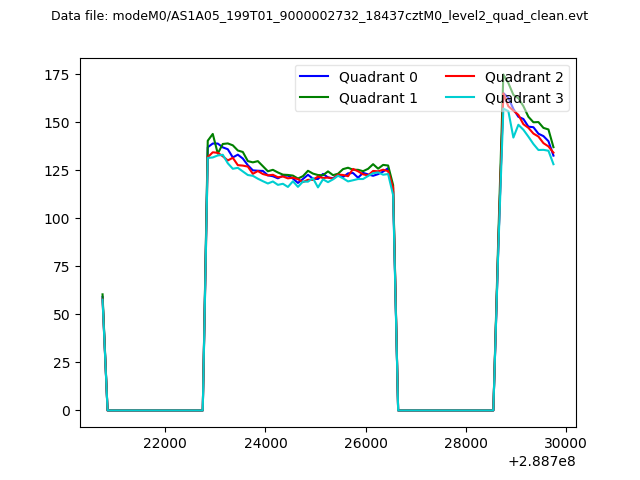 |
|
| Module-wise count rates for Quadrant A Data is divided into 100 sec bins |
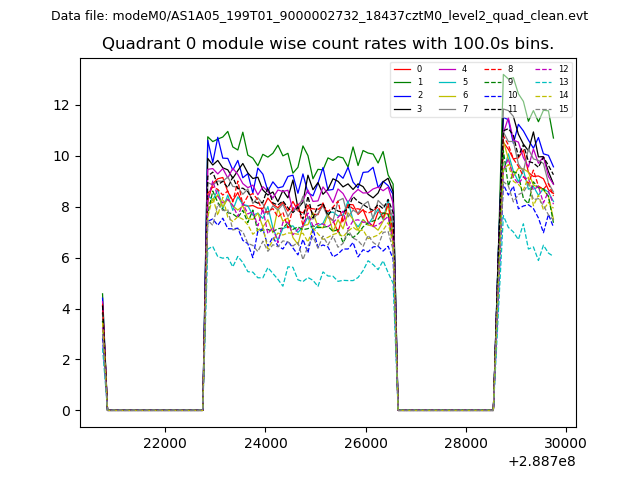 |
 |
| Module-wise count rates for Quadrant B Data is divided into 100 sec bins |
 |
 |
| Module-wise count rates for Quadrant C Data is divided into 100 sec bins |
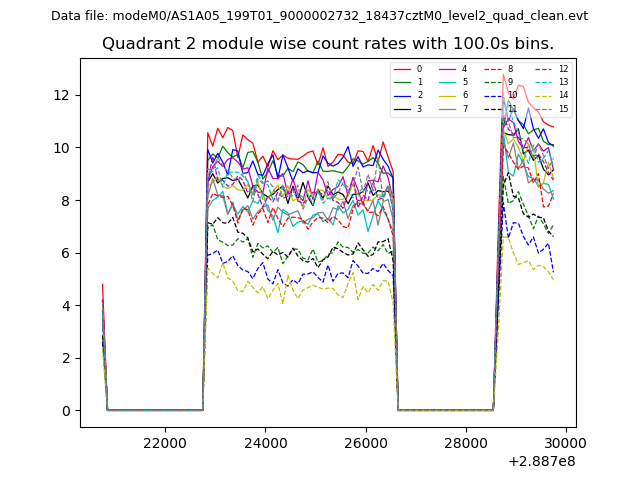 |
 |
| Module-wise count rates for Quadrant D Data is divided into 100 sec bins |
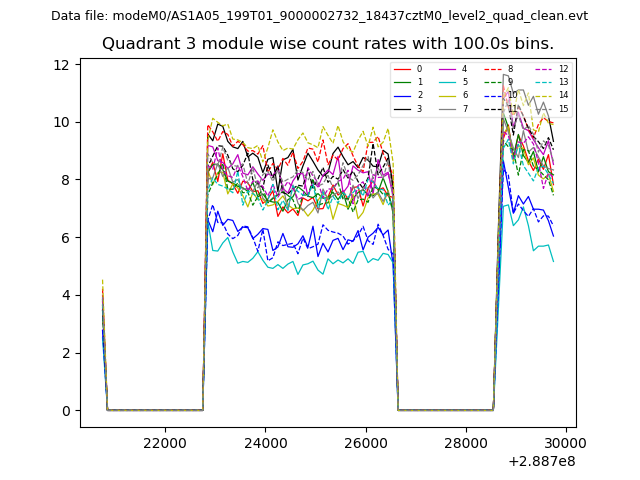 |
 |
| Parameter | Plot |
|---|---|
| CZT HV Monitor |  |
| D_VDD | 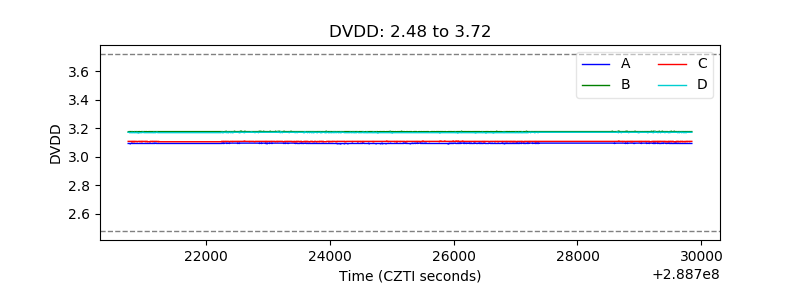 |
| Temperature 1 | 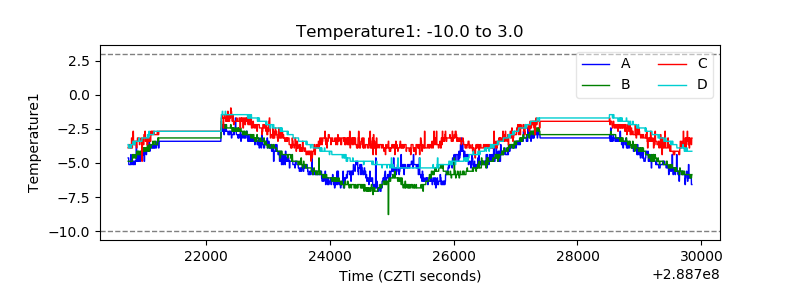 |
| Veto HV Monitor | 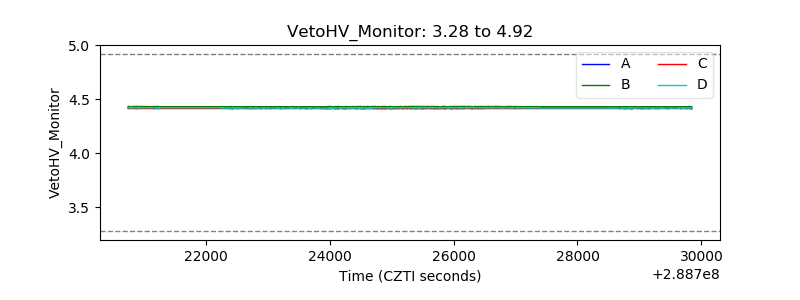 |
| Veto LLD | 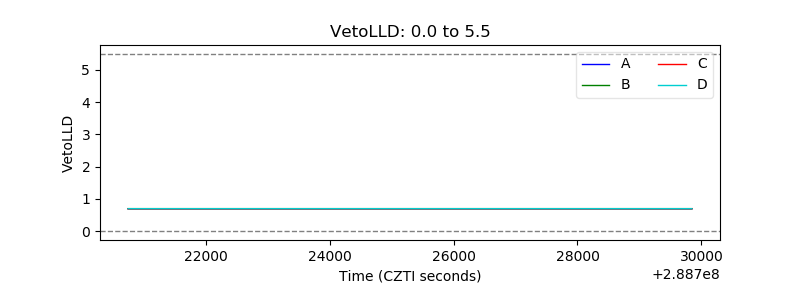 |
| Alpha Counter | 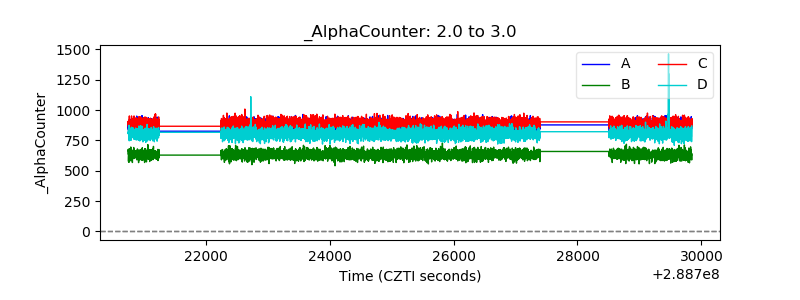 |
| _CPM_Rate | 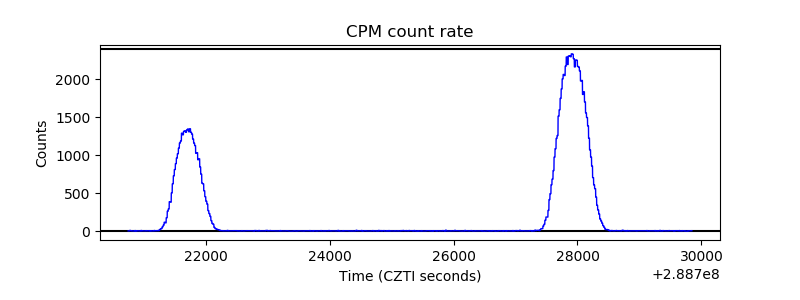 |
| CZT Counter | 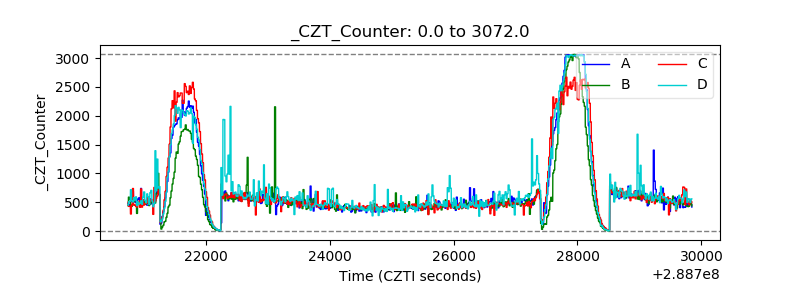 |
| +2.5 Volts monitor |  |
| +5 Volts monitor | 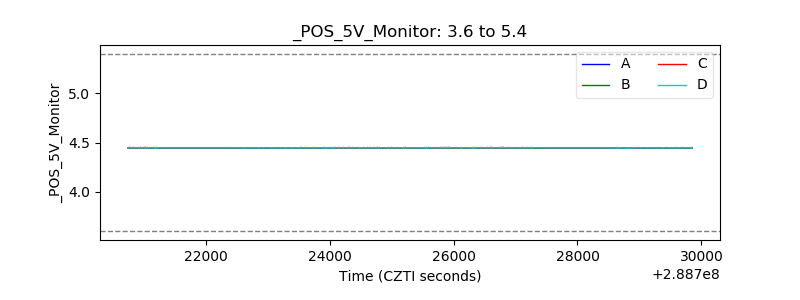 |
| _ROLL_ROT | 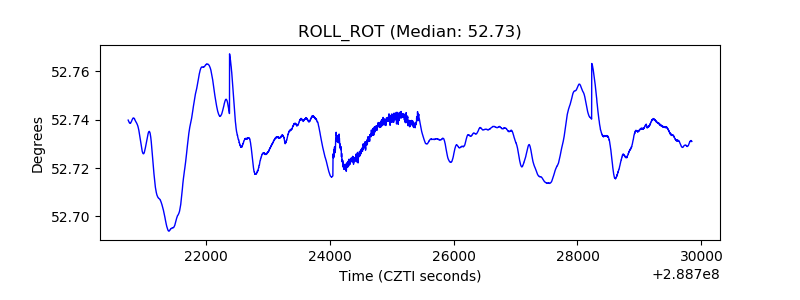 |
| _Roll_DEC | 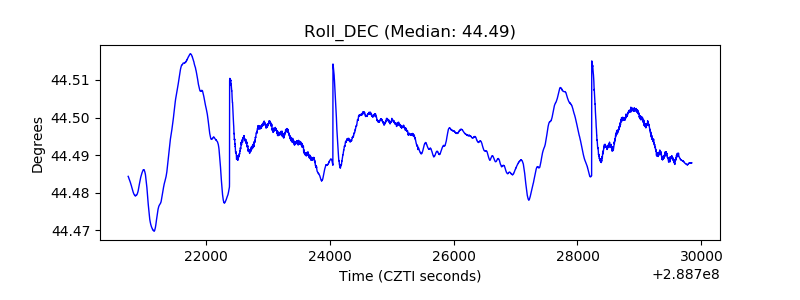 |
| _Roll_RA | 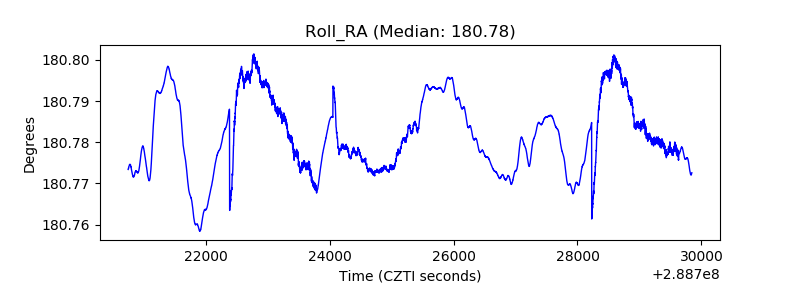 |
| Veto Counter | 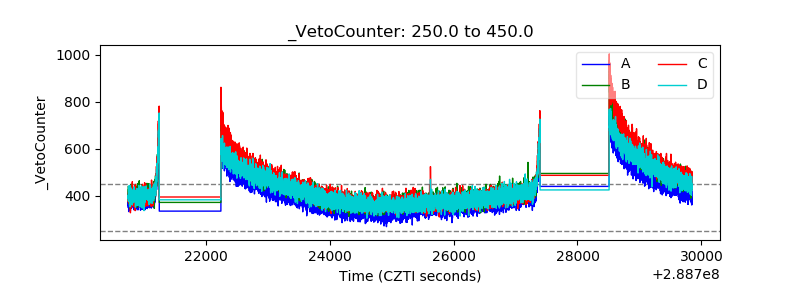 |