| Param | Original file | Final file |
|---|---|---|
| Filename | modeM0/AS1A05_199T01_9000002732_18440cztM0_level2.evt | modeM0/AS1A05_199T01_9000002732_18440cztM0_level2_quad_clean.evt |
| Size (bytes) | 466,352,640 | 104,515,200 |
| Size | 444.7 MB | 99.7 MB |
| Events in quadrant A | 3,357,011 | 674,521 |
| Events in quadrant B | 3,351,261 | 707,071 |
| Events in quadrant C | 3,353,801 | 678,974 |
| Events in quadrant D | 3,619,600 | 651,072 |
| Mode M0 | |||
|---|---|---|---|
| Quadrant | BADHDUFLAG | Total packets | Discarded packets |
| A | 0 | 14194 | 2 |
| B | 0 | 14031 | 2 |
| C | 0 | 14070 | 2 |
| D | 0 | 14939 | 2 |
| Mode SS | |||
|---|---|---|---|
| Quadrant | BADHDUFLAG | Total packets | Discarded packets |
| A | 0 | 136 | 0 |
| B | 0 | 136 | 0 |
| C | 0 | 136 | 0 |
| D | 0 | 136 | 0 |
| Mode M9 | |||
|---|---|---|---|
| Quadrant | BADHDUFLAG | Total packets | Discarded packets |
| A | 0 | 26 | 0 |
| B | 0 | 26 | 0 |
| C | 0 | 26 | 0 |
| D | 0 | 26 | 0 |
| Quadrant | Total seconds | Saturated seconds | Saturation percentage |
|---|---|---|---|
| A | 6500 | 48 | 0.738462% |
| B | 6499 | 92 | 1.415602% |
| C | 6500 | 145 | 2.230769% |
| D | 6500 | 101 | 1.553846% |
Noise dominated data is calculated using 1-second bins in cleaned event files. If a bin has >2000 counts, and if more than 50% of those come from <1% of pixels, then it is considered to be noise-dominated and hence unusable.
| Quadrant | # 1 sec bins | Bins with >0 counts | Bins with >2000 counts | High rate bins dominated by noise | Noise dominated (total time) | Noise dominated (detector-on time) | Marked lightcurve |
|---|---|---|---|---|---|---|---|
| A | 9135 | 6501 | 3 | 3 | 0.03% | 0.05% | 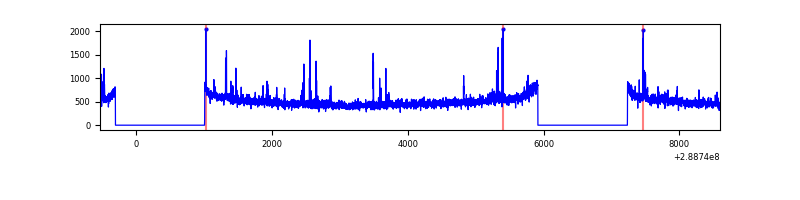 |
| B | 9134 | 6500 | 1 | 1 | 0.01% | 0.02% | 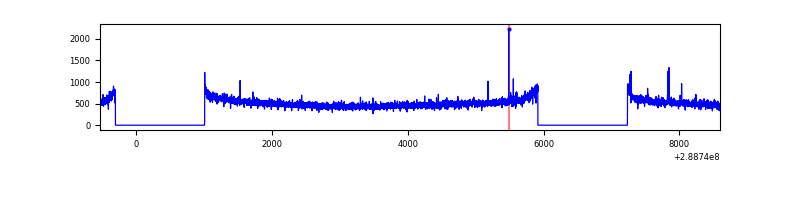 |
| C | 9135 | 6502 | 0 | 0 | 0.00% | 0.00% | 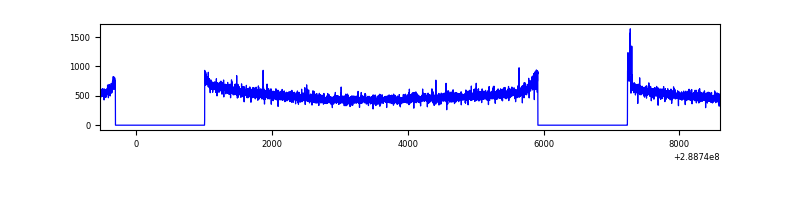 |
| D | 9135 | 6502 | 26 | 26 | 0.28% | 0.40% | 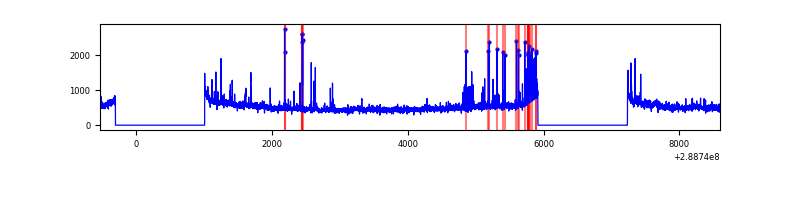 |
Top three noisy pixels from each quadrant. If the there are fewer than three noisy pixels in the level2.evt file, extra rows are filled as -1
| Pixel properties | Quadrant properties | ||||||
|---|---|---|---|---|---|---|---|
| Quadrant | DetID | PixID | Counts | Sigma | Mean | Median | Sigma |
| A | 14 | 238 | 90801 | 539.96 | 835 | 820 | 166.6 |
| A | 15 | 174 | 39885 | 234.42 | 835 | 820 | 166.6 |
| A | 4 | 2 | 18352 | 105.21 | 835 | 820 | 166.6 |
| B | 0 | 229 | 26940 | 163.71 | 850 | 830 | 159.5 |
| B | 12 | 111 | 18314 | 109.62 | 850 | 830 | 159.5 |
| B | 11 | 111 | 15845 | 94.14 | 850 | 830 | 159.5 |
| C | 14 | 238 | 129448 | 675.73 | 820 | 825 | 190.3 |
| C | 9 | 54 | 15856 | 78.97 | 820 | 825 | 190.3 |
| C | 3 | 233 | 9709 | 46.67 | 820 | 825 | 190.3 |
| D | 12 | 110 | 215466 | 1083.19 | 815 | 792 | 198.2 |
| D | 1 | 52 | 149446 | 750.07 | 815 | 792 | 198.2 |
| D | 13 | 168 | 140291 | 703.88 | 815 | 792 | 198.2 |
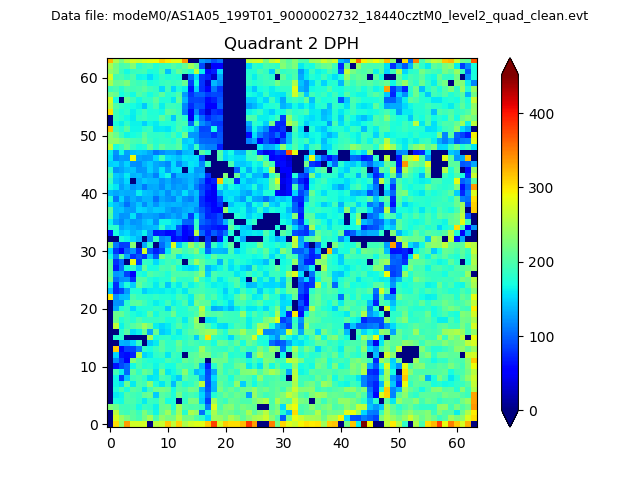
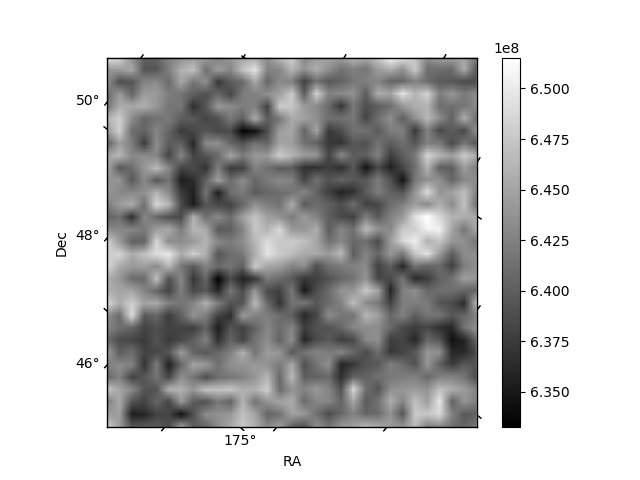
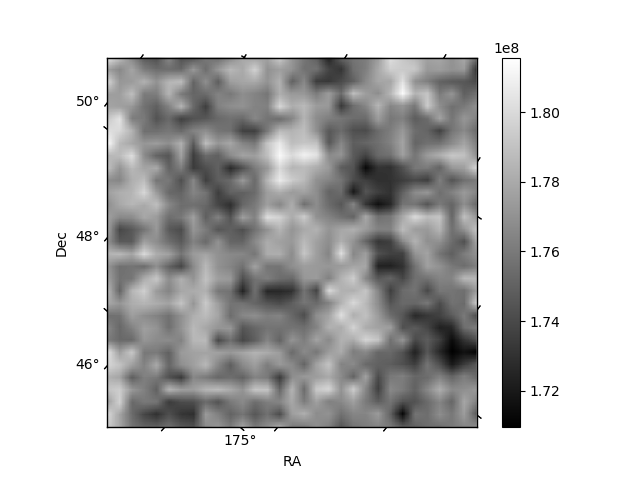
Histogram calculated using DETX and DETY for each event in the final _common_clean file
| Quadrant A | 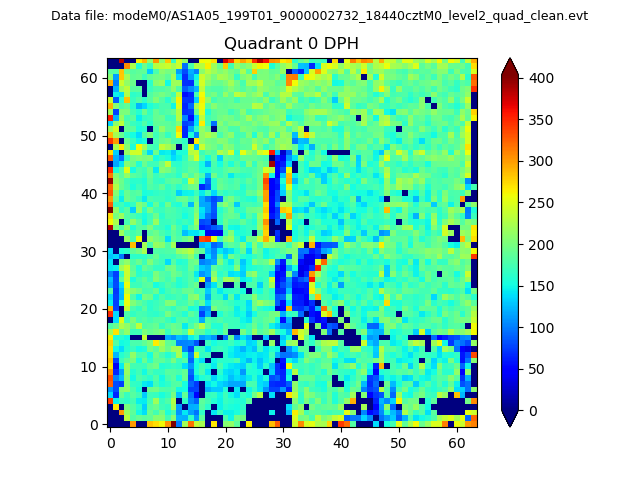 |
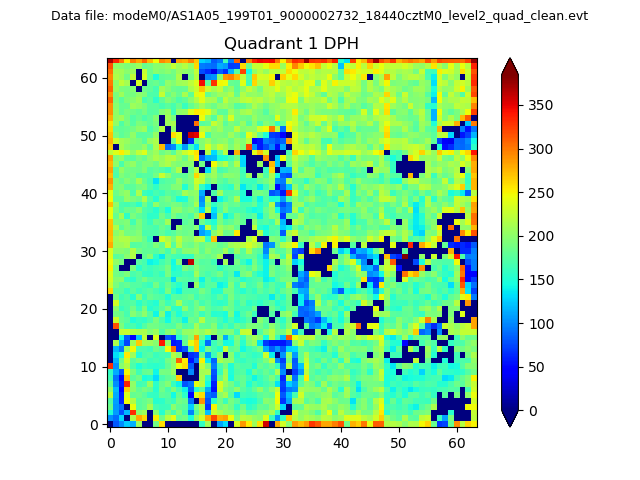 |
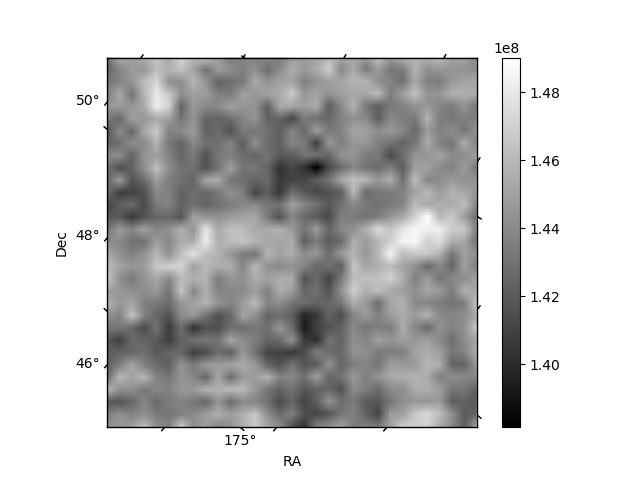
Quadrant B |
|---|---|---|---|
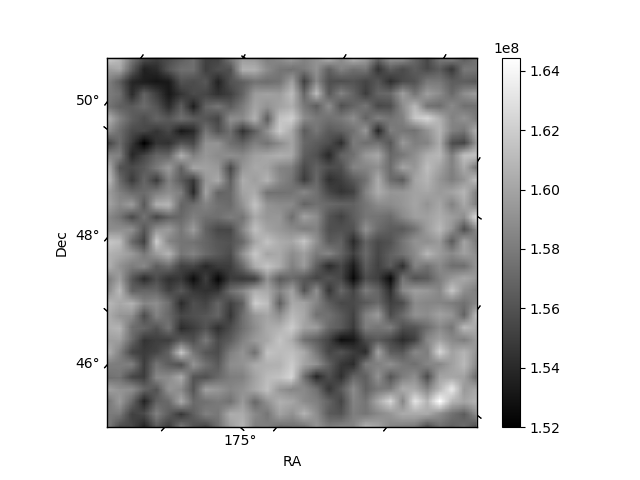
| Quadrant D | 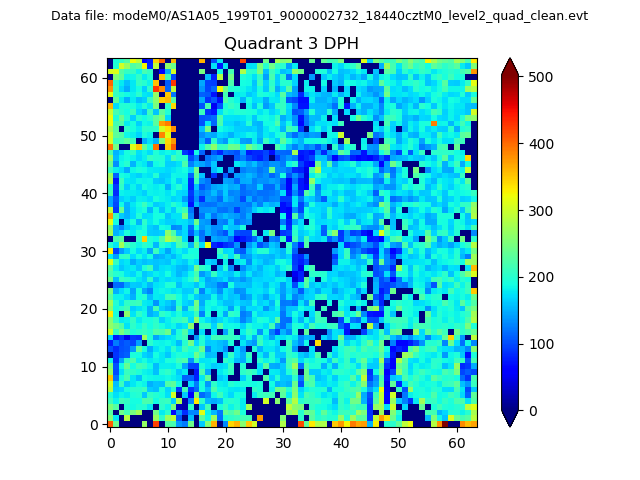 |
 |
Quadrant C |
| Plot type | Count rate plots | Images |
|---|---|---|
| Comparison with Poisson distribution Blue bars denote a histogram of data divided into 1 sec bins. Red curve is a Poisson curve with rate = median count rate of data. |
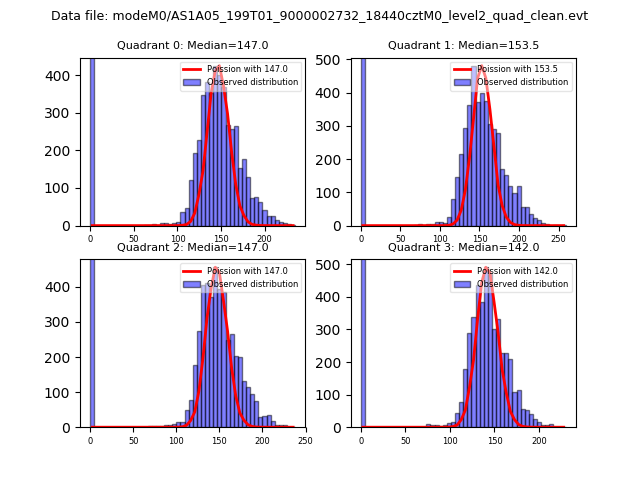 |
 |
| Quadrant-wise count rates Data is divided into 100 sec bins |
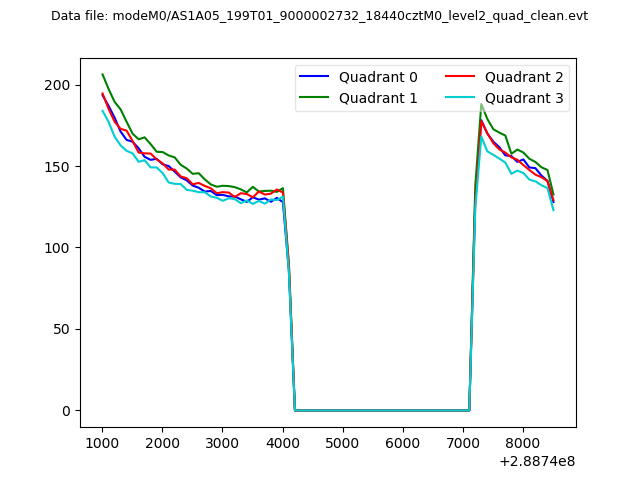 |
|
| Module-wise count rates for Quadrant A Data is divided into 100 sec bins |
 |
 |
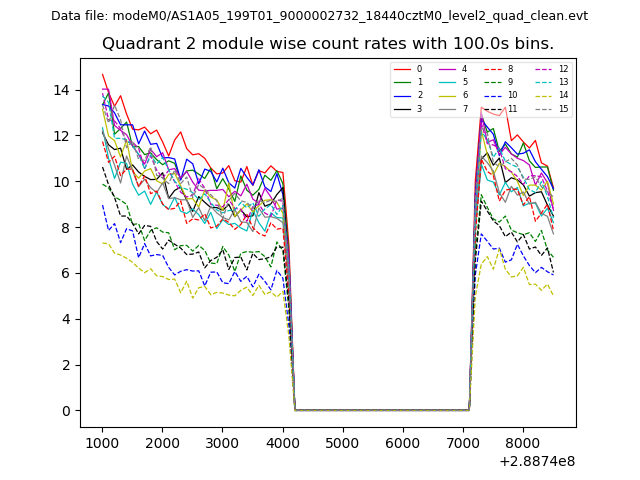
| Module-wise count rates for Quadrant B Data is divided into 100 sec bins |
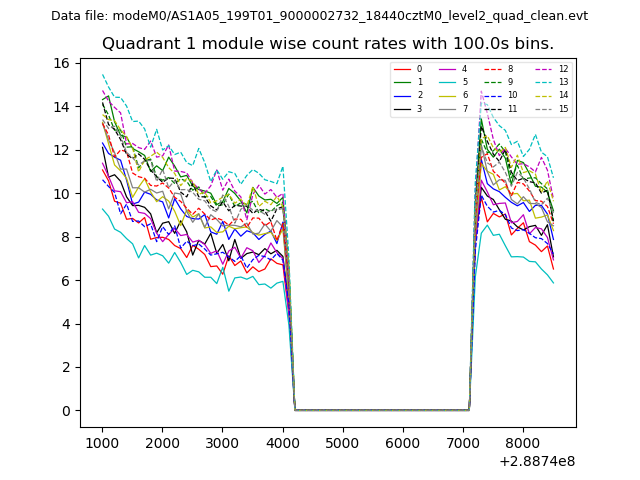 |
 |
| Module-wise count rates for Quadrant C Data is divided into 100 sec bins |
 |
 |
| Module-wise count rates for Quadrant D Data is divided into 100 sec bins |
 |
 |
| Parameter | Plot |
|---|---|
| CZT HV Monitor | 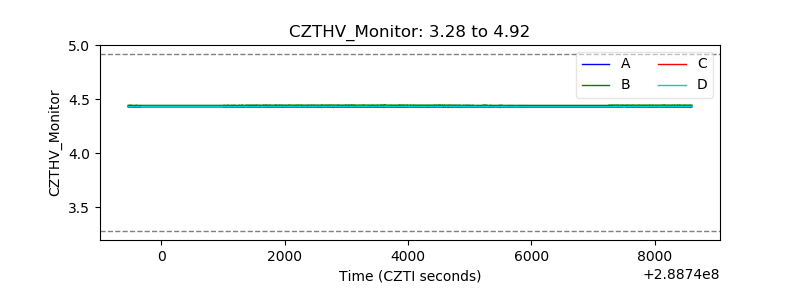 |
| D_VDD | 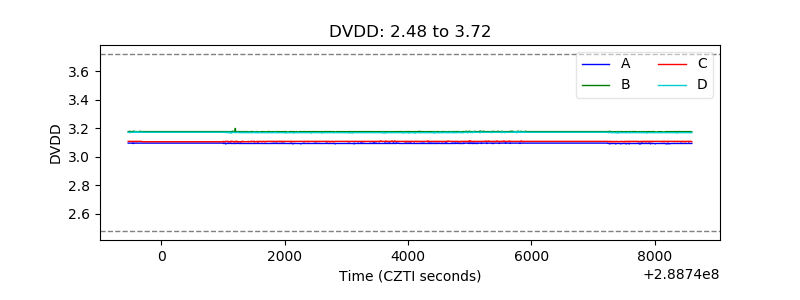 |
| Temperature 1 | 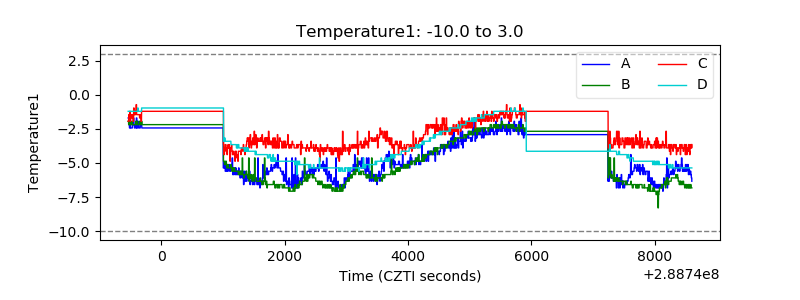 |
| Veto HV Monitor | 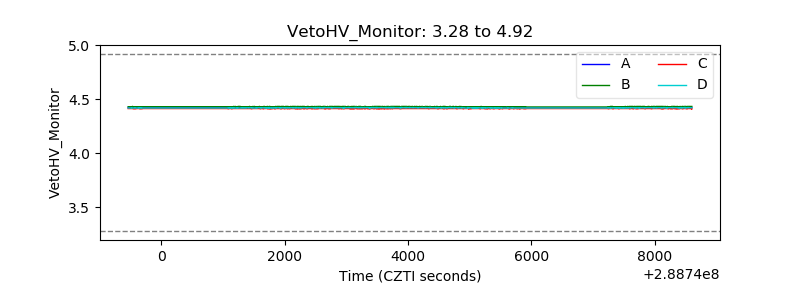 |
| Veto LLD | 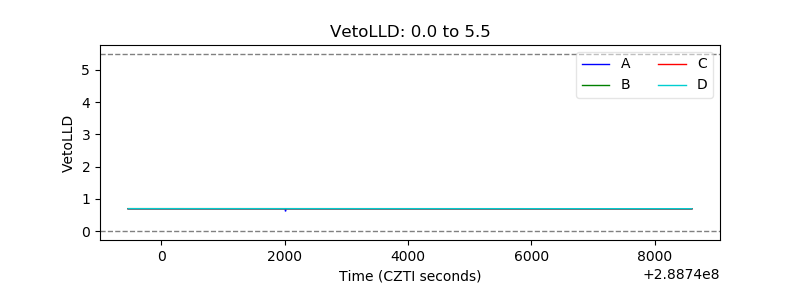 |
| Alpha Counter | 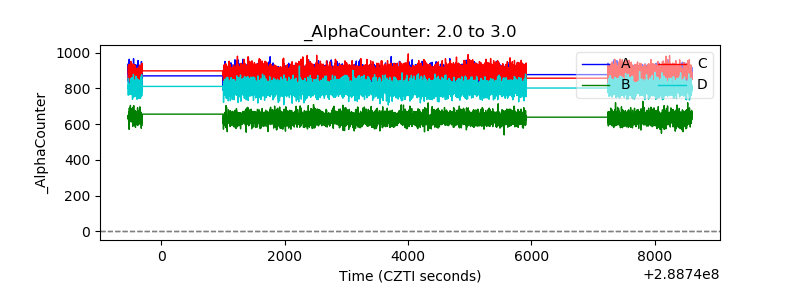 |
| _CPM_Rate | 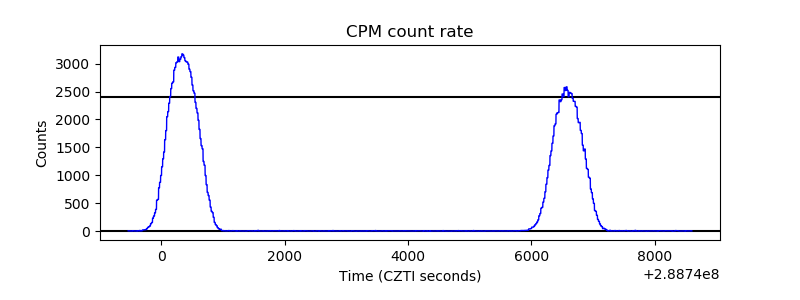 |
| CZT Counter | 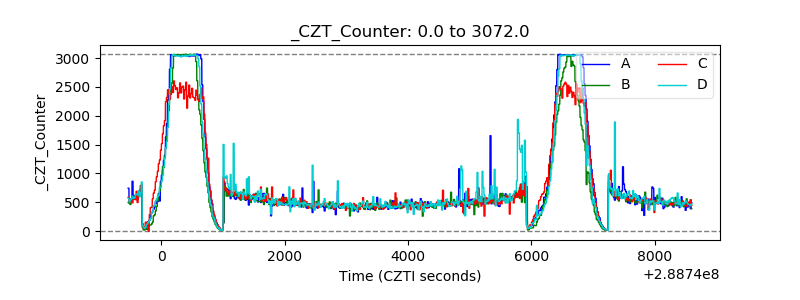 |
| +2.5 Volts monitor | 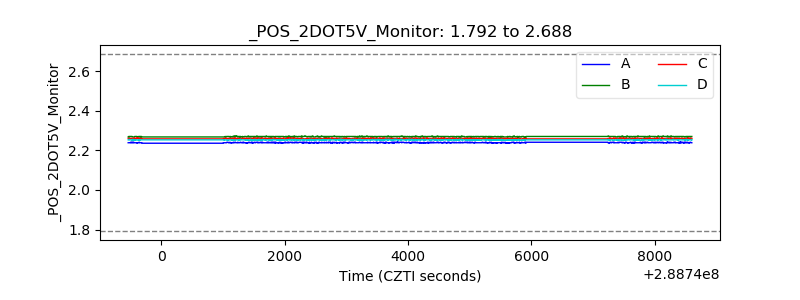 |
| +5 Volts monitor |  |
| _ROLL_ROT | 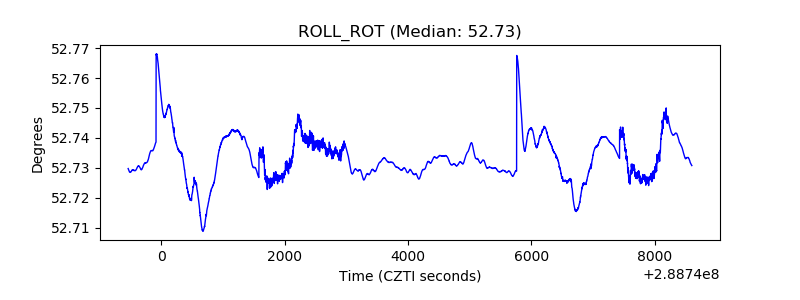 |
| _Roll_DEC | 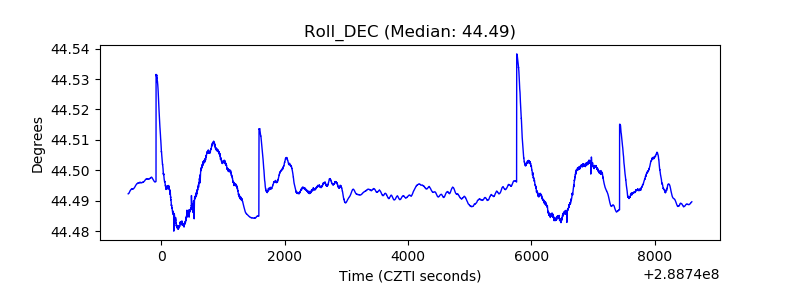 |
| _Roll_RA | 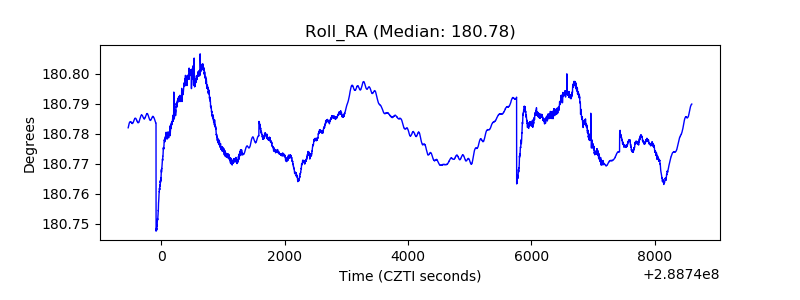 |
| Veto Counter | 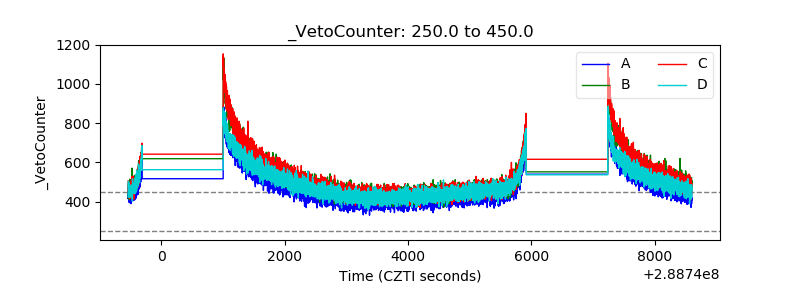 |