| Param | Original file | Final file |
|---|---|---|
| Filename | modeM0/AS1A05_199T01_9000002732_18442cztM0_level2.evt | modeM0/AS1A05_199T01_9000002732_18442cztM0_level2_quad_clean.evt |
| Size (bytes) | 446,748,480 | 98,216,640 |
| Size | 426.1 MB | 93.7 MB |
| Events in quadrant A | 3,164,935 | 628,966 |
| Events in quadrant B | 3,307,310 | 647,253 |
| Events in quadrant C | 3,197,869 | 624,757 |
| Events in quadrant D | 3,403,501 | 605,847 |
| Mode M0 | |||
|---|---|---|---|
| Quadrant | BADHDUFLAG | Total packets | Discarded packets |
| A | 0 | 13888 | 2 |
| B | 0 | 14171 | 2 |
| C | 0 | 13911 | 2 |
| D | 0 | 14654 | 2 |
| Mode SS | |||
|---|---|---|---|
| Quadrant | BADHDUFLAG | Total packets | Discarded packets |
| A | 0 | 134 | 0 |
| B | 0 | 134 | 0 |
| C | 0 | 134 | 0 |
| D | 0 | 134 | 0 |
| Mode M9 | |||
|---|---|---|---|
| Quadrant | BADHDUFLAG | Total packets | Discarded packets |
| A | 0 | 17 | 0 |
| B | 0 | 18 | 0 |
| C | 0 | 18 | 0 |
| D | 0 | 18 | 0 |
| Quadrant | Total seconds | Saturated seconds | Saturation percentage |
|---|---|---|---|
| A | 6718 | 17 | 0.253052% |
| B | 6718 | 42 | 0.625186% |
| C | 6718 | 49 | 0.729384% |
| D | 6718 | 39 | 0.580530% |
Noise dominated data is calculated using 1-second bins in cleaned event files. If a bin has >2000 counts, and if more than 50% of those come from <1% of pixels, then it is considered to be noise-dominated and hence unusable.
| Quadrant | # 1 sec bins | Bins with >0 counts | Bins with >2000 counts | High rate bins dominated by noise | Noise dominated (total time) | Noise dominated (detector-on time) | Marked lightcurve |
|---|---|---|---|---|---|---|---|
| A | 7883 | 6718 | 8 | 8 | 0.10% | 0.12% | 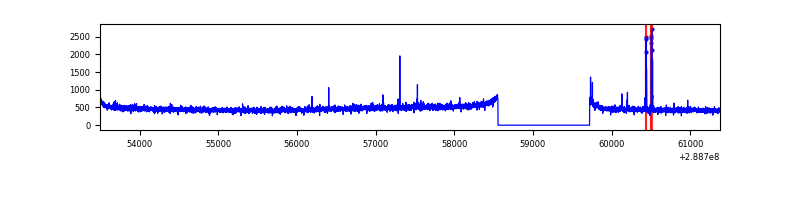 |
| B | 7883 | 6718 | 12 | 12 | 0.15% | 0.18% | 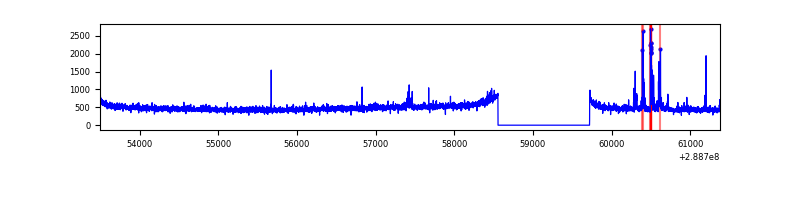 |
| C | 7882 | 6717 | 0 | 0 | 0.00% | 0.00% | 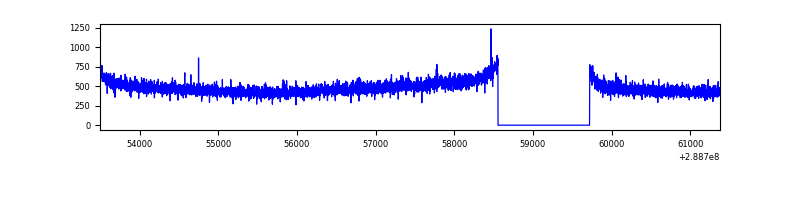 |
| D | 7882 | 6717 | 27 | 27 | 0.34% | 0.40% | 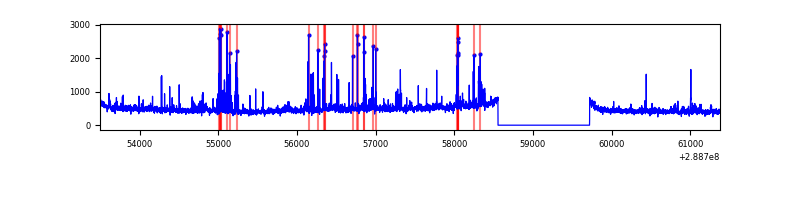 |
Top three noisy pixels from each quadrant. If the there are fewer than three noisy pixels in the level2.evt file, extra rows are filled as -1
| Pixel properties | Quadrant properties | ||||||
|---|---|---|---|---|---|---|---|
| Quadrant | DetID | PixID | Counts | Sigma | Mean | Median | Sigma |
| A | 4 | 2 | 40030 | 239.86 | 810 | 792 | 163.6 |
| A | 14 | 238 | 12104 | 69.15 | 810 | 792 | 163.6 |
| A | 0 | 226 | 7055 | 38.29 | 810 | 792 | 163.6 |
| B | 10 | 245 | 101658 | 649.89 | 816 | 797 | 155.2 |
| B | 12 | 111 | 17947 | 110.5 | 816 | 797 | 155.2 |
| B | 11 | 111 | 15677 | 95.88 | 816 | 797 | 155.2 |
| C | 14 | 238 | 124154 | 680.56 | 781 | 786 | 181.3 |
| C | 3 | 233 | 26383 | 141.21 | 781 | 786 | 181.3 |
| C | 13 | 61 | 5589 | 26.5 | 781 | 786 | 181.3 |
| D | 1 | 52 | 278265 | 1465.28 | 782 | 759 | 189.4 |
| D | 12 | 110 | 95480 | 500.14 | 782 | 759 | 189.4 |
| D | 13 | 168 | 43324 | 224.75 | 782 | 759 | 189.4 |
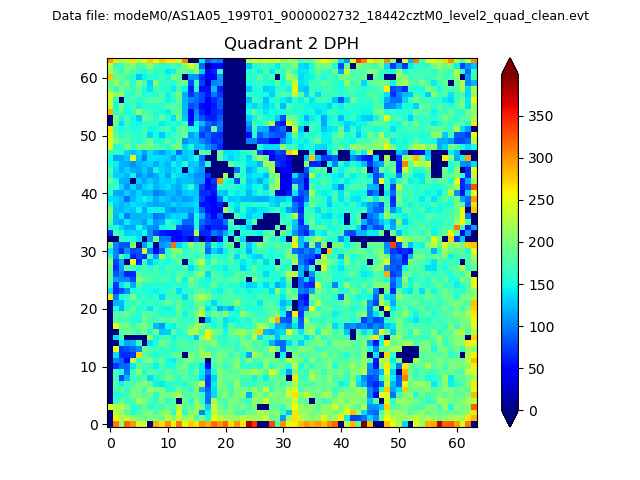
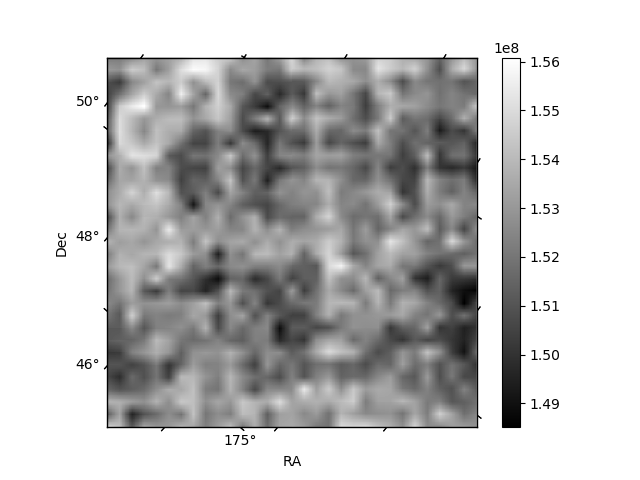
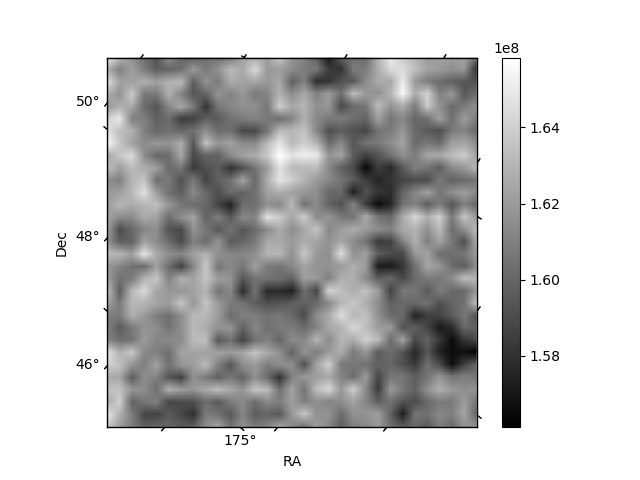
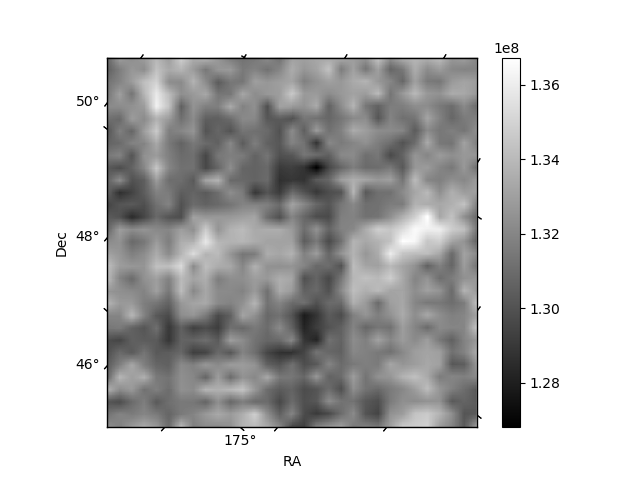
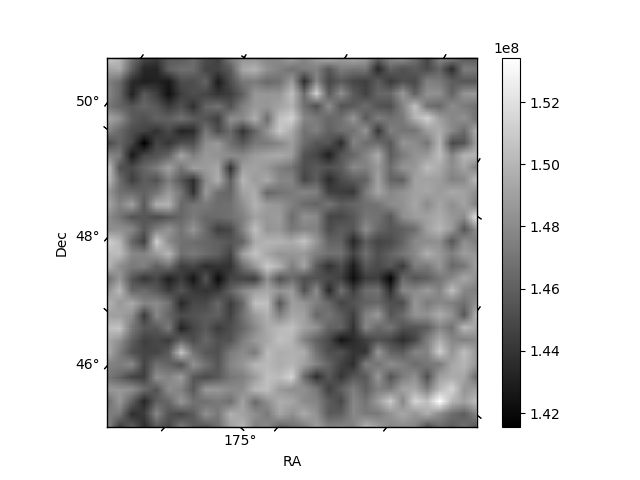
Histogram calculated using DETX and DETY for each event in the final _common_clean file
| Quadrant A | 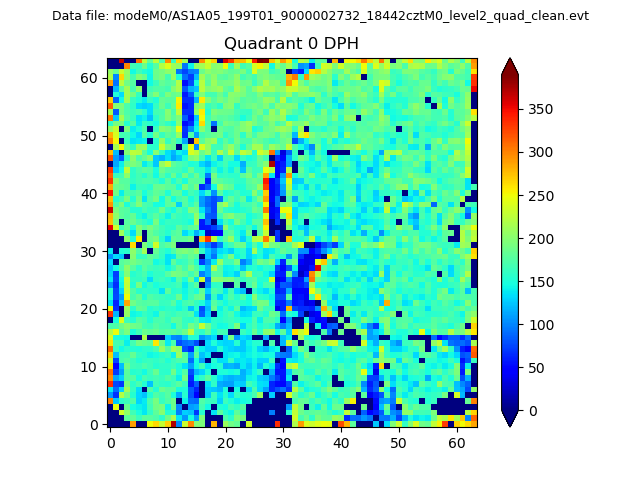 |
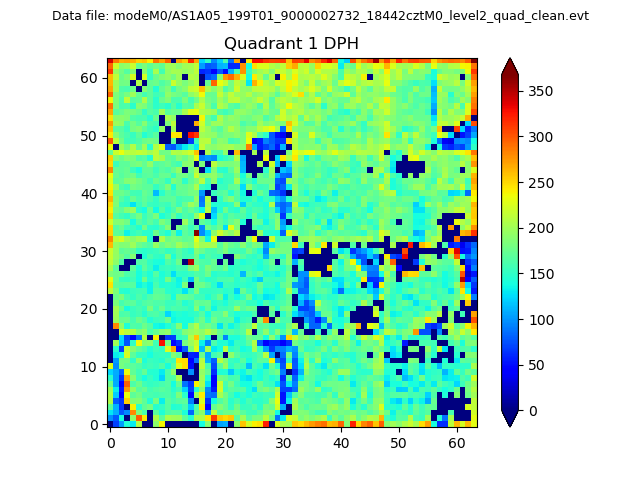 |
Quadrant B |
|---|---|---|---|
| Quadrant D | 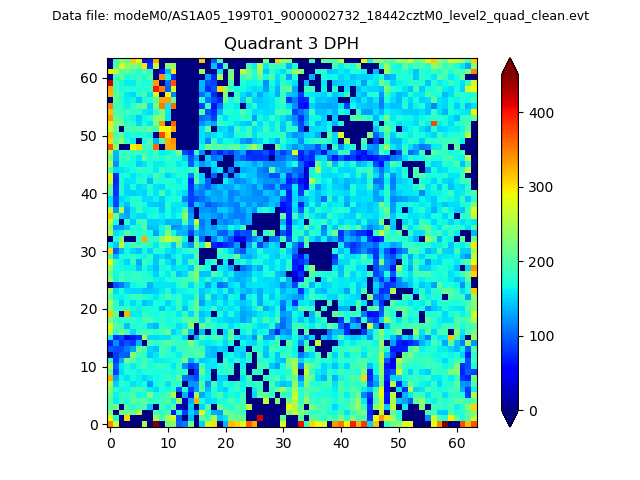 |
 |
Quadrant C |
| Plot type | Count rate plots | Images |
|---|---|---|
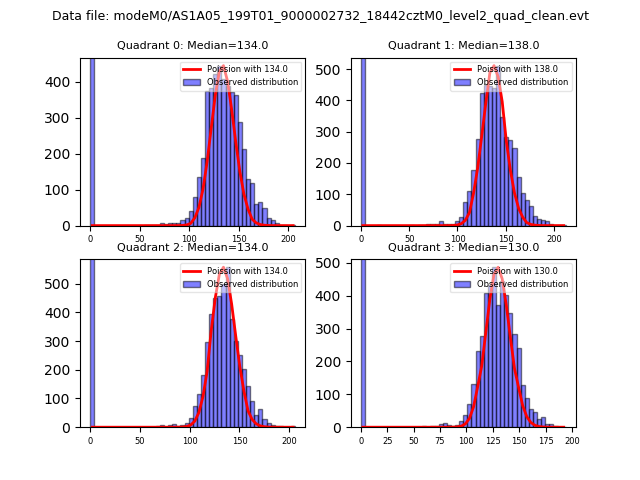
| Comparison with Poisson distribution Blue bars denote a histogram of data divided into 1 sec bins. Red curve is a Poisson curve with rate = median count rate of data. |
 |
 |
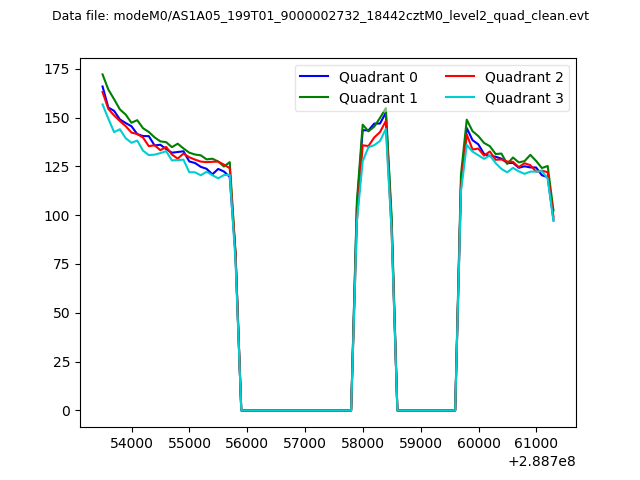
| Quadrant-wise count rates Data is divided into 100 sec bins |
 |
|
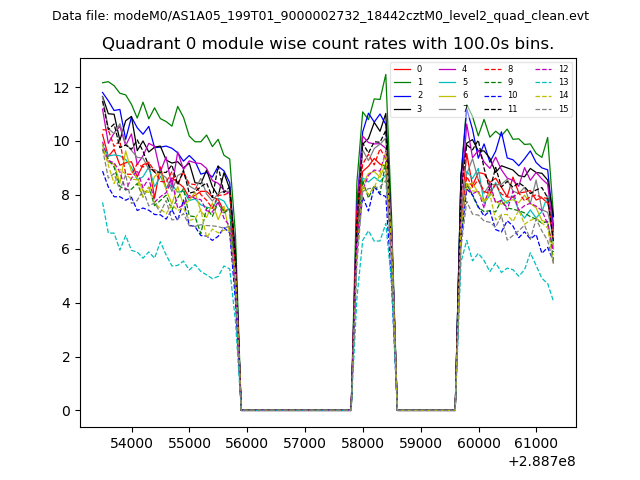
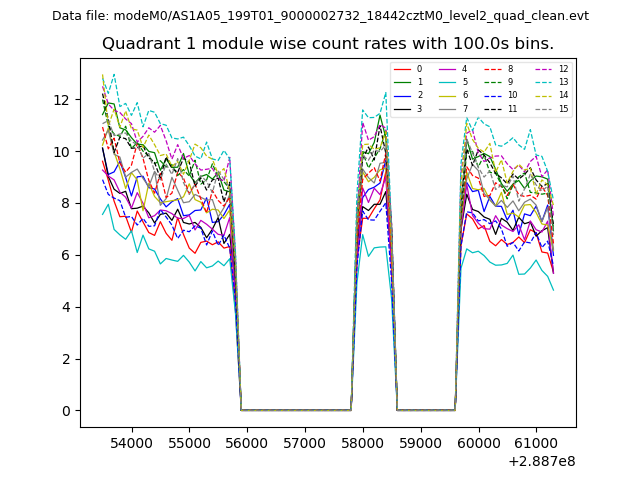
| Module-wise count rates for Quadrant A Data is divided into 100 sec bins |
 |
 |
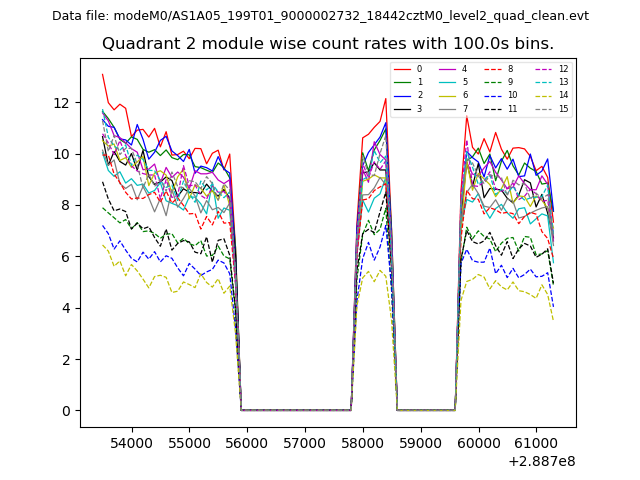
| Module-wise count rates for Quadrant B Data is divided into 100 sec bins |
 |
 |
| Module-wise count rates for Quadrant C Data is divided into 100 sec bins |
 |
 |
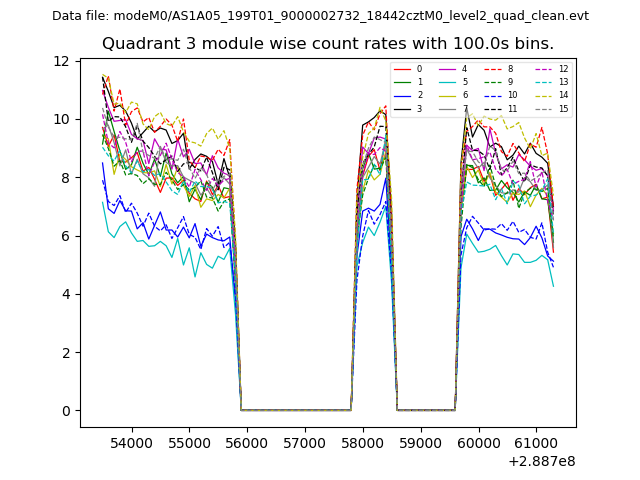
| Module-wise count rates for Quadrant D Data is divided into 100 sec bins |
 |
 |
| Parameter | Plot |
|---|---|
| CZT HV Monitor | 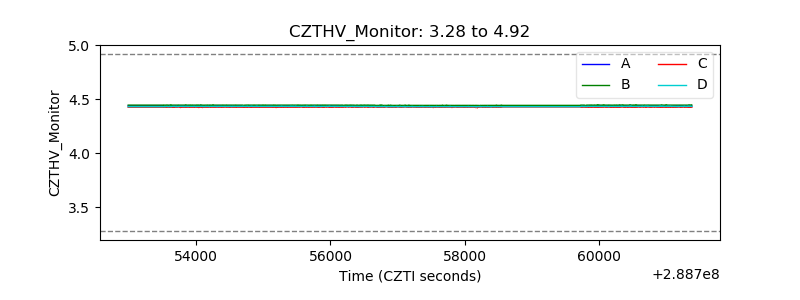 |
| D_VDD | 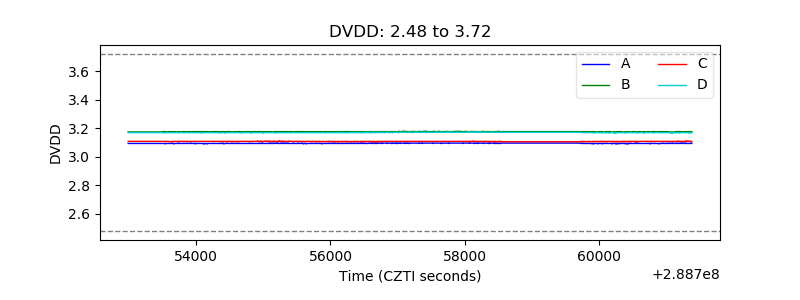 |
| Temperature 1 | 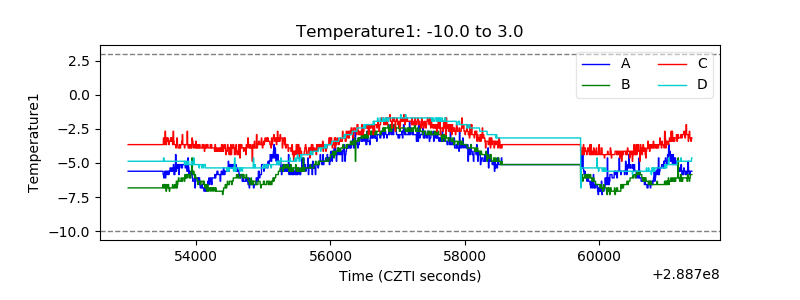 |
| Veto HV Monitor | 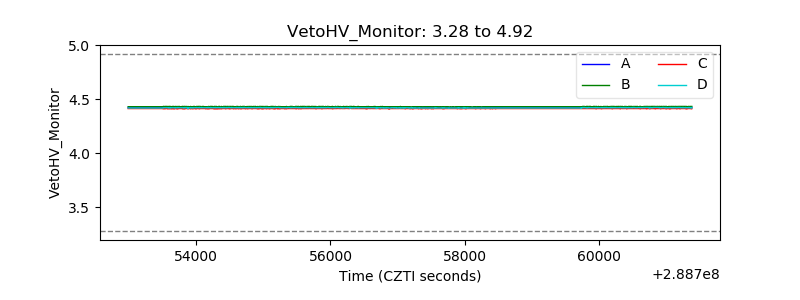 |
| Veto LLD |  |
| Alpha Counter | 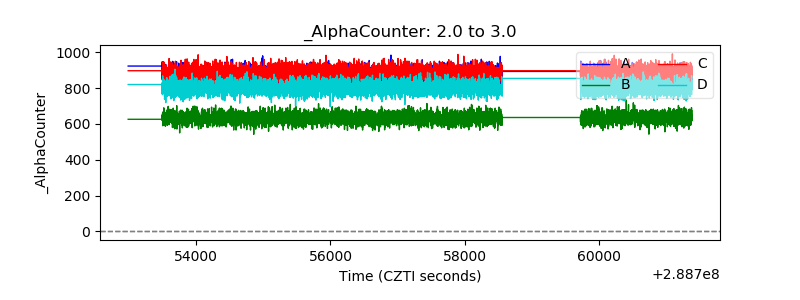 |
| _CPM_Rate | 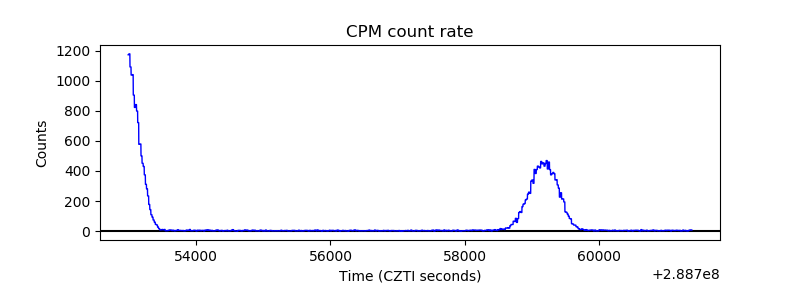 |
| CZT Counter | 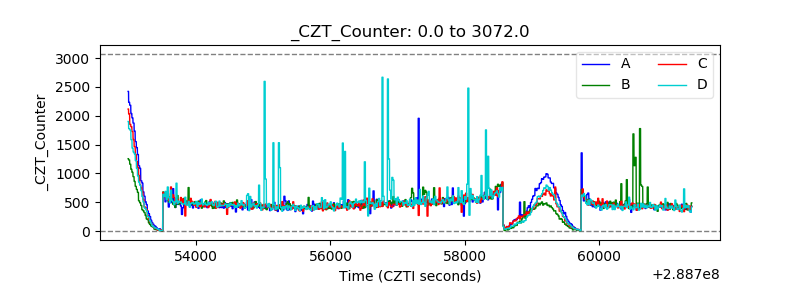 |
| +2.5 Volts monitor |  |
| +5 Volts monitor |  |
| _ROLL_ROT | 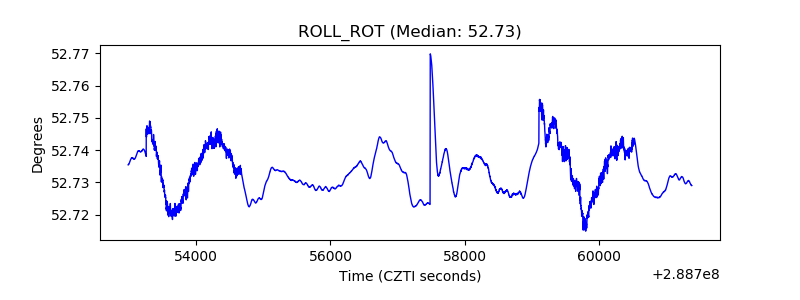 |
| _Roll_DEC | 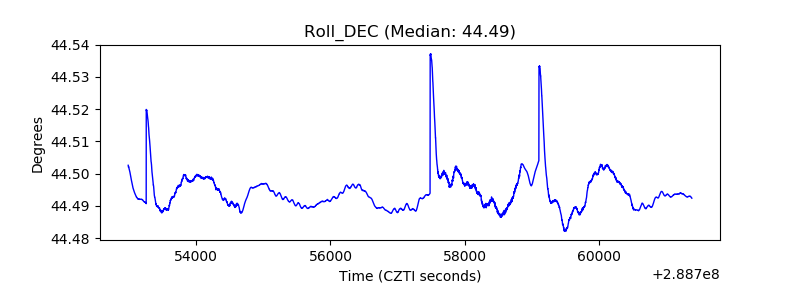 |
| _Roll_RA | 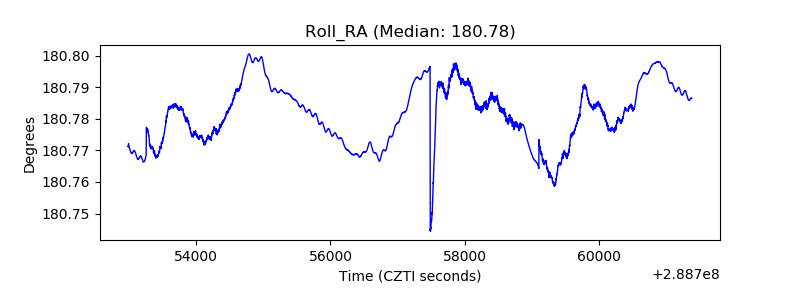 |
| Veto Counter | 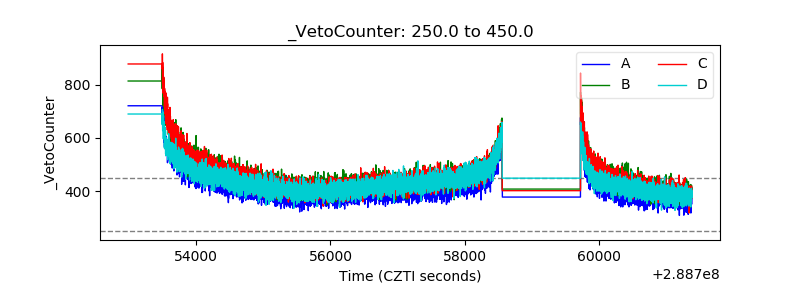 |