| Param | Original file | Final file |
|---|---|---|
| Filename | modeM0/AS1A05_199T01_9000002732_18443cztM0_level2.evt | modeM0/AS1A05_199T01_9000002732_18443cztM0_level2_quad_clean.evt |
| Size (bytes) | 437,172,480 | 91,768,320 |
| Size | 416.9 MB | 87.5 MB |
| Events in quadrant A | 3,034,960 | 582,258 |
| Events in quadrant B | 3,271,891 | 596,536 |
| Events in quadrant C | 3,074,293 | 576,914 |
| Events in quadrant D | 3,408,806 | 562,297 |
| Mode M0 | |||
|---|---|---|---|
| Quadrant | BADHDUFLAG | Total packets | Discarded packets |
| A | 0 | 13482 | 1 |
| B | 0 | 13974 | 1 |
| C | 0 | 13474 | 1 |
| D | 0 | 14742 | 1 |
| Mode SS | |||
|---|---|---|---|
| Quadrant | BADHDUFLAG | Total packets | Discarded packets |
| A | 0 | 136 | 0 |
| B | 0 | 136 | 0 |
| C | 0 | 136 | 0 |
| D | 0 | 136 | 0 |
| Mode M9 | |||
|---|---|---|---|
| Quadrant | BADHDUFLAG | Total packets | Discarded packets |
| A | 0 | 8 | 0 |
| B | 0 | 8 | 0 |
| C | 0 | 8 | 0 |
| D | 0 | 8 | 0 |
| Quadrant | Total seconds | Saturated seconds | Saturation percentage |
|---|---|---|---|
| A | 6606 | 63 | 0.953678% |
| B | 6607 | 89 | 1.347056% |
| C | 6607 | 66 | 0.998941% |
| D | 6607 | 125 | 1.891933% |
Noise dominated data is calculated using 1-second bins in cleaned event files. If a bin has >2000 counts, and if more than 50% of those come from <1% of pixels, then it is considered to be noise-dominated and hence unusable.
| Quadrant | # 1 sec bins | Bins with >0 counts | Bins with >2000 counts | High rate bins dominated by noise | Noise dominated (total time) | Noise dominated (detector-on time) | Marked lightcurve |
|---|---|---|---|---|---|---|---|
| A | 7410 | 6605 | 8 | 8 | 0.11% | 0.12% | 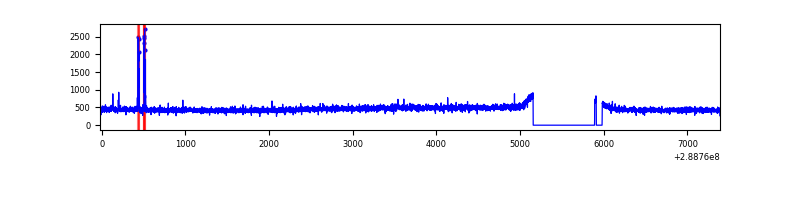 |
| B | 7412 | 6609 | 15 | 15 | 0.20% | 0.23% | 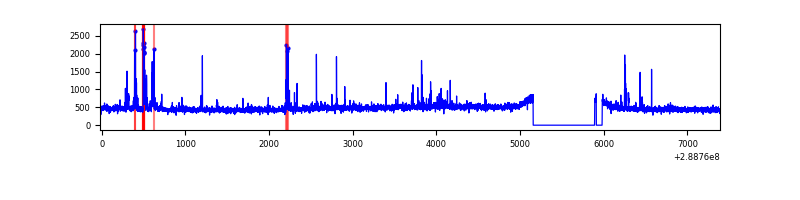 |
| C | 7411 | 6606 | 0 | 0 | 0.00% | 0.00% | 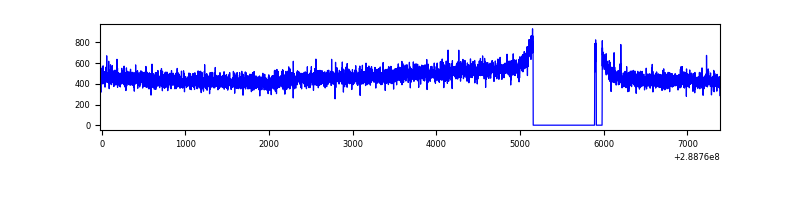 |
| D | 7412 | 6608 | 84 | 84 | 1.13% | 1.27% | 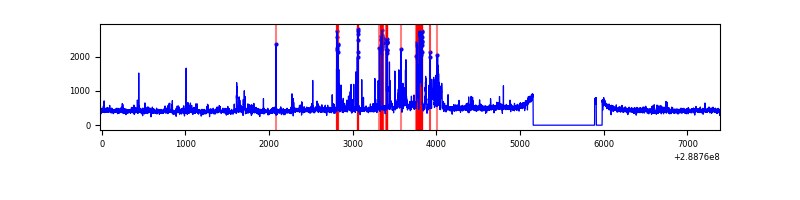 |
Top three noisy pixels from each quadrant. If the there are fewer than three noisy pixels in the level2.evt file, extra rows are filled as -1
| Pixel properties | Quadrant properties | ||||||
|---|---|---|---|---|---|---|---|
| Quadrant | DetID | PixID | Counts | Sigma | Mean | Median | Sigma |
| A | 4 | 2 | 34719 | 213.93 | 780 | 762 | 158.7 |
| A | 0 | 226 | 6783 | 37.93 | 780 | 762 | 158.7 |
| A | 3 | 137 | 5972 | 32.82 | 780 | 762 | 158.7 |
| B | 10 | 245 | 173628 | 1157.85 | 782 | 761 | 149.3 |
| B | 12 | 111 | 18042 | 115.75 | 782 | 761 | 149.3 |
| B | 11 | 111 | 15511 | 98.79 | 782 | 761 | 149.3 |
| C | 14 | 238 | 116963 | 658.96 | 749 | 752 | 176.4 |
| C | 3 | 233 | 32787 | 181.65 | 749 | 752 | 176.4 |
| C | 13 | 61 | 5283 | 25.69 | 749 | 752 | 176.4 |
| D | 1 | 52 | 422024 | 2308.99 | 750 | 727 | 182.5 |
| D | 12 | 110 | 71764 | 389.33 | 750 | 727 | 182.5 |
| D | 13 | 168 | 34427 | 184.7 | 750 | 727 | 182.5 |
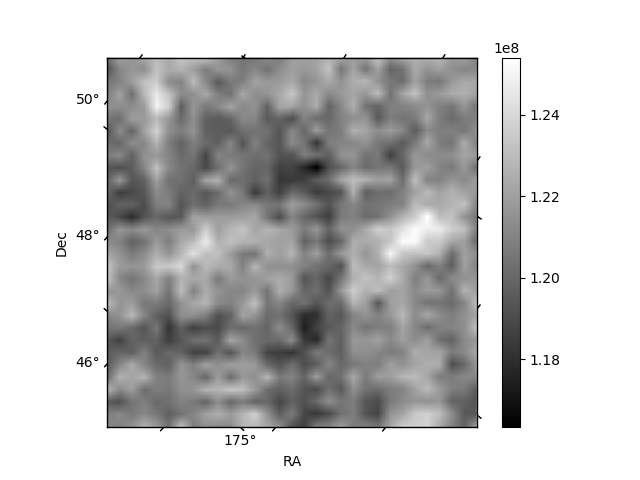
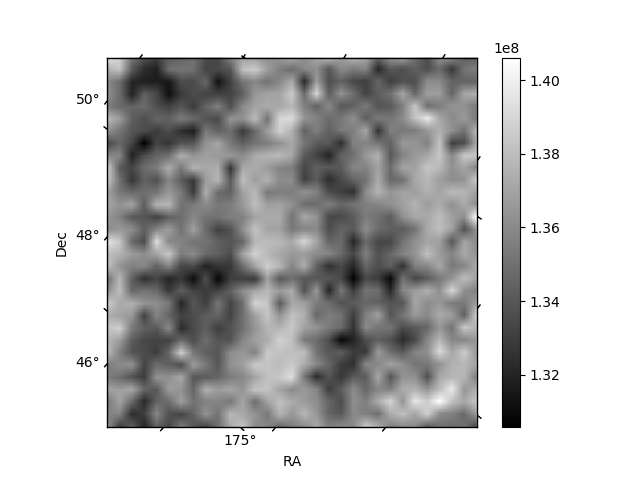
Histogram calculated using DETX and DETY for each event in the final _common_clean file
| Quadrant A | 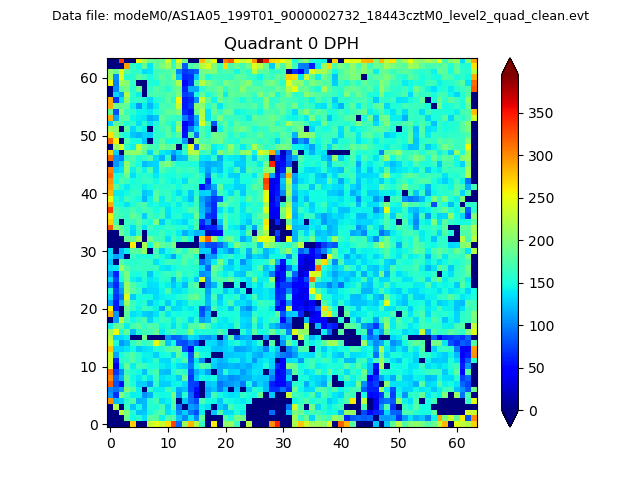 |
 |
Quadrant B |
|---|---|---|---|
| Quadrant D |  |
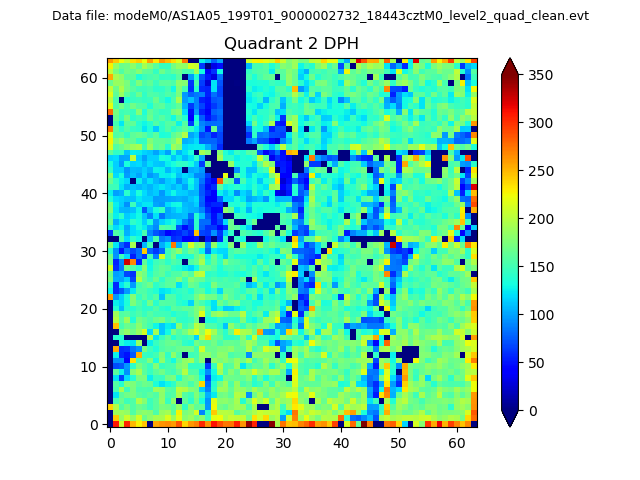 |
Quadrant C |
| Plot type | Count rate plots | Images |
|---|---|---|
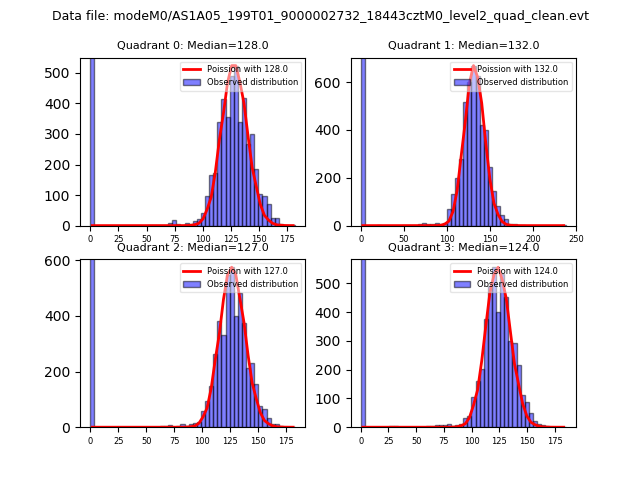
| Comparison with Poisson distribution Blue bars denote a histogram of data divided into 1 sec bins. Red curve is a Poisson curve with rate = median count rate of data. |
 |
 |
| Quadrant-wise count rates Data is divided into 100 sec bins |
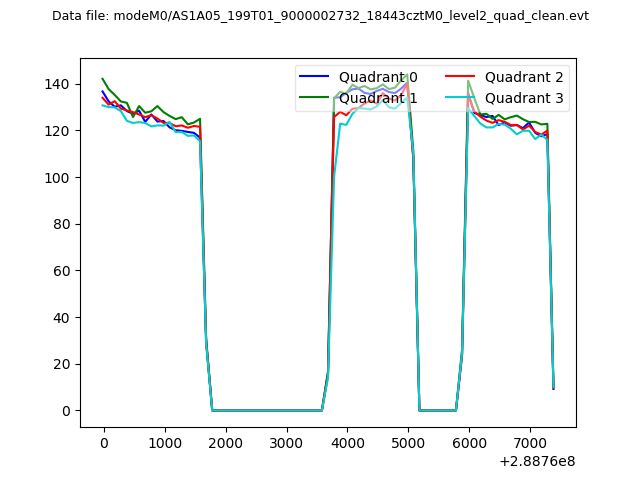 |
|
| Module-wise count rates for Quadrant A Data is divided into 100 sec bins |
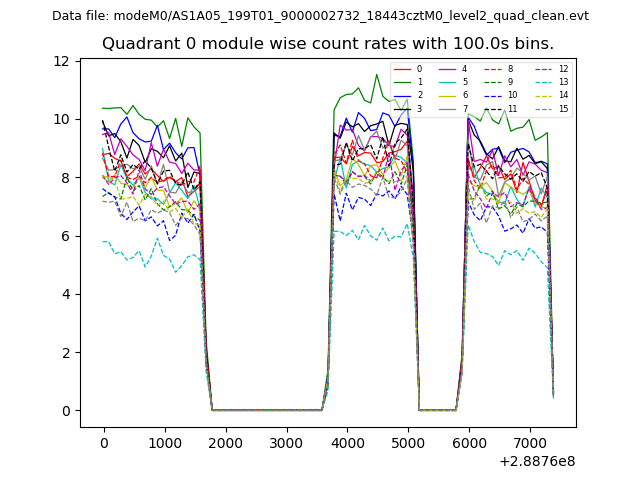 |
 |
| Module-wise count rates for Quadrant B Data is divided into 100 sec bins |
 |
 |
| Module-wise count rates for Quadrant C Data is divided into 100 sec bins |
 |
 |
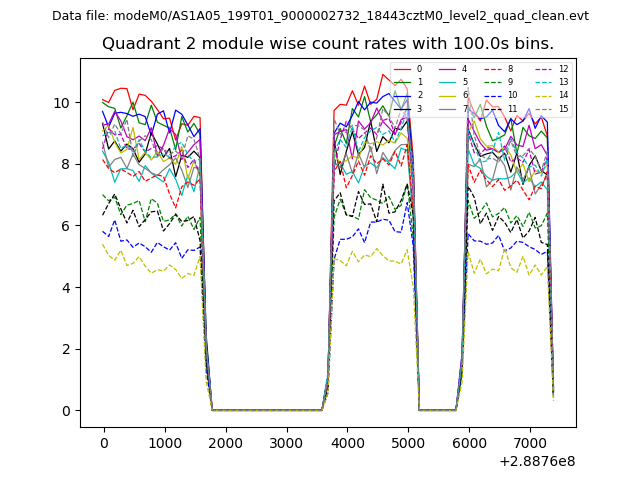
| Module-wise count rates for Quadrant D Data is divided into 100 sec bins |
 |
 |
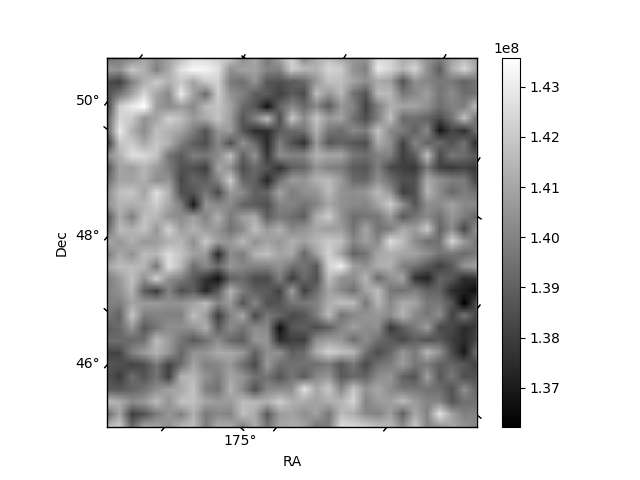
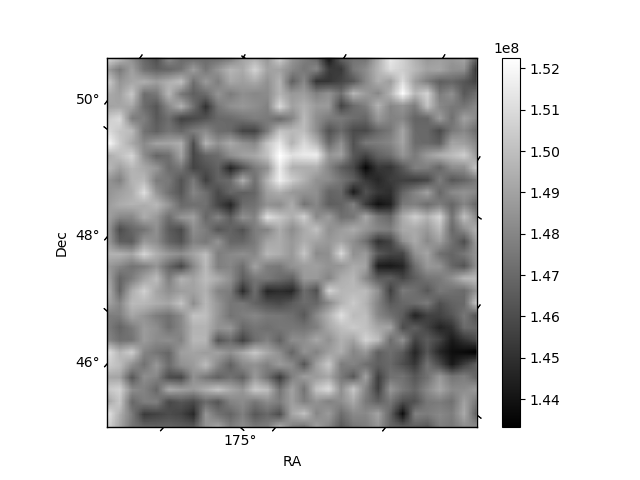
| Parameter | Plot |
|---|---|
| CZT HV Monitor | 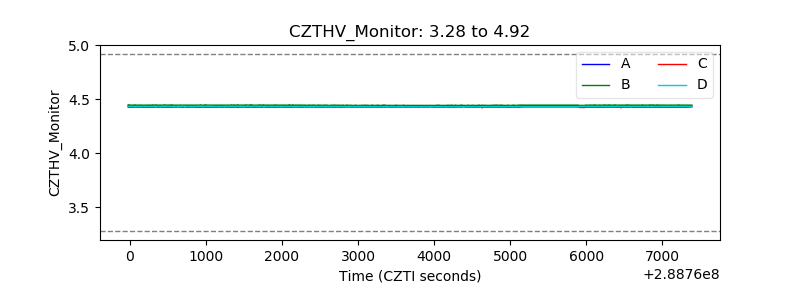 |
| D_VDD | 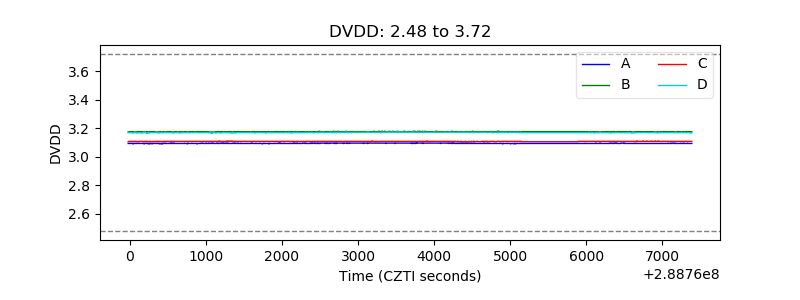 |
| Temperature 1 | 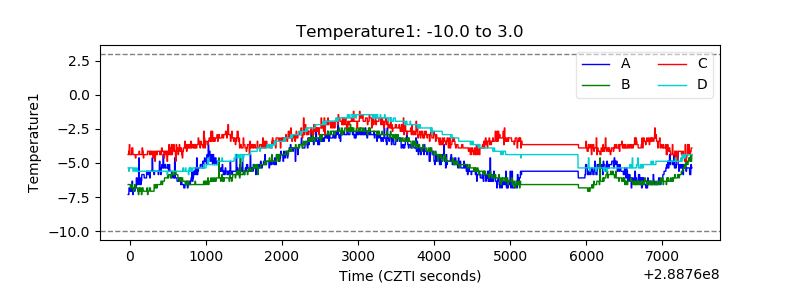 |
| Veto HV Monitor | 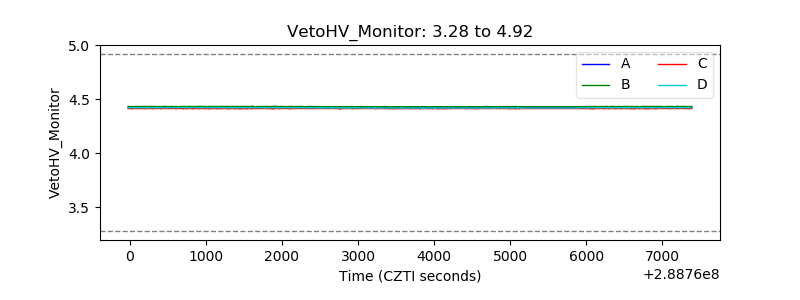 |
| Veto LLD | 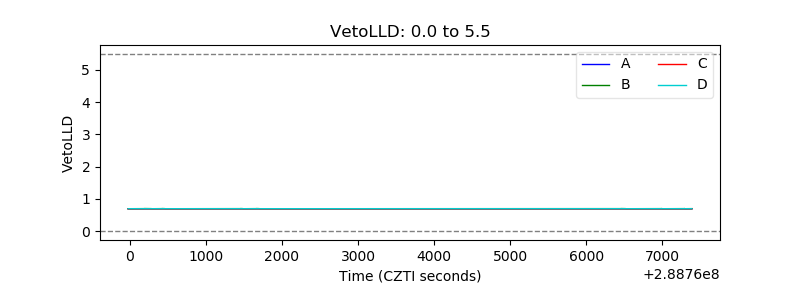 |
| Alpha Counter | 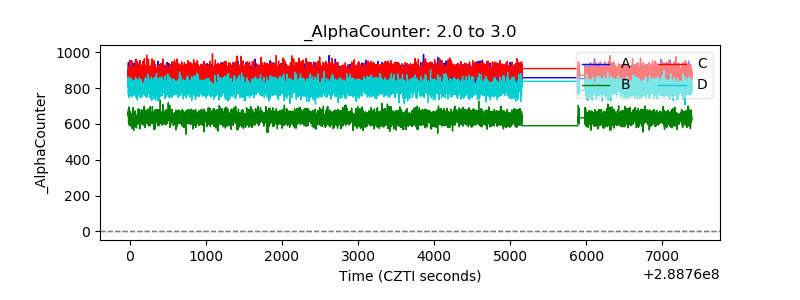 |
| _CPM_Rate | 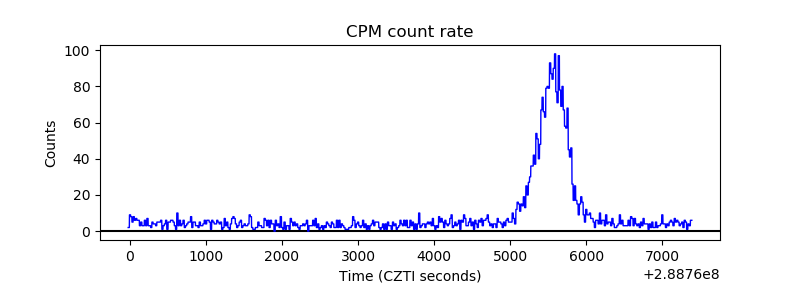 |
| CZT Counter | 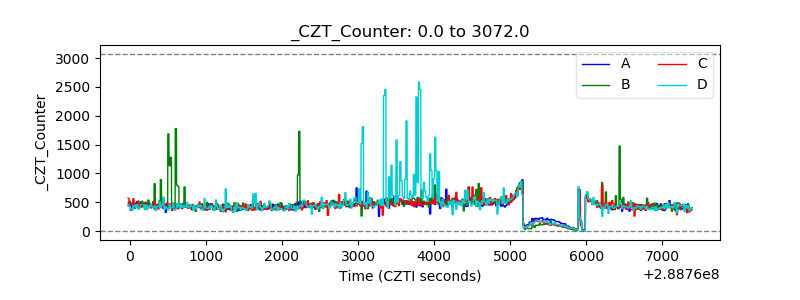 |
| +2.5 Volts monitor |  |
| +5 Volts monitor |  |
| _ROLL_ROT | 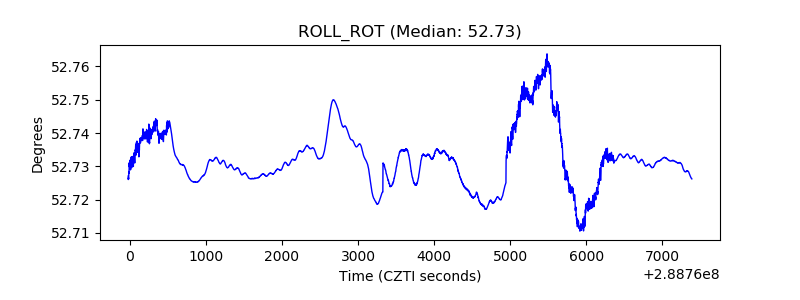 |
| _Roll_DEC | 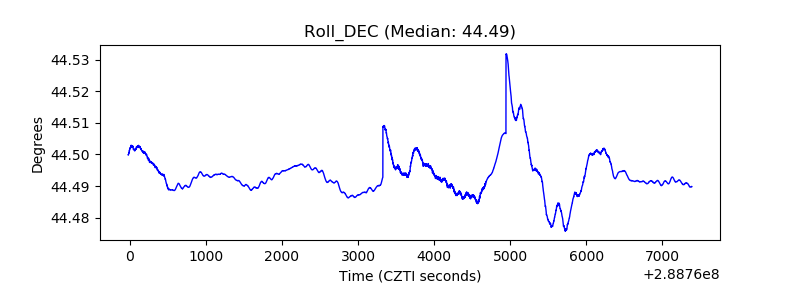 |
| _Roll_RA | 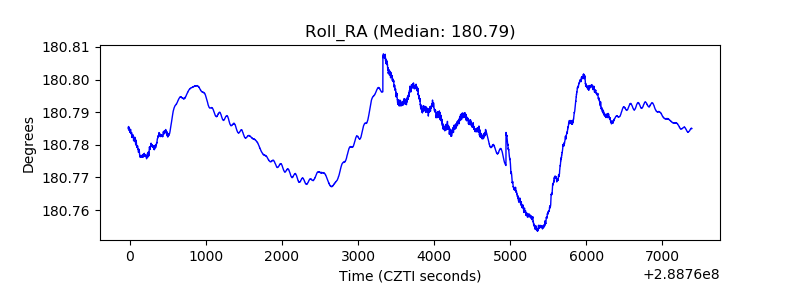 |
| Veto Counter | 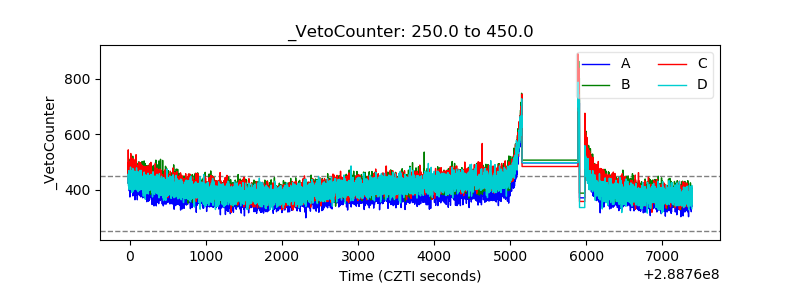 |