| Param | Original file | Final file |
|---|---|---|
| Filename | modeM0/AS1A05_199T01_9000002732_18444cztM0_level2.evt | modeM0/AS1A05_199T01_9000002732_18444cztM0_level2_quad_clean.evt |
| Size (bytes) | 500,497,920 | 99,688,320 |
| Size | 477.3 MB | 95.1 MB |
| Events in quadrant A | 3,387,718 | 630,604 |
| Events in quadrant B | 4,165,072 | 635,288 |
| Events in quadrant C | 3,431,429 | 623,876 |
| Events in quadrant D | 3,667,827 | 611,436 |
| Mode M0 | |||
|---|---|---|---|
| Quadrant | BADHDUFLAG | Total packets | Discarded packets |
| A | 0 | 15180 | 2 |
| B | 0 | 17279 | 2 |
| C | 0 | 15200 | 2 |
| D | 0 | 15978 | 2 |
| Mode SS | |||
|---|---|---|---|
| Quadrant | BADHDUFLAG | Total packets | Discarded packets |
| A | 0 | 150 | 0 |
| B | 0 | 150 | 0 |
| C | 0 | 150 | 0 |
| D | 0 | 150 | 0 |
| Mode M9 | |||
|---|---|---|---|
| Quadrant | BADHDUFLAG | Total packets | Discarded packets |
| A | 0 | 10 | 0 |
| B | 0 | 11 | 0 |
| C | 0 | 11 | 0 |
| D | 0 | 11 | 0 |
| Quadrant | Total seconds | Saturated seconds | Saturation percentage |
|---|---|---|---|
| A | 7442 | 108 | 1.451223% |
| B | 7442 | 282 | 3.789304% |
| C | 7442 | 106 | 1.424348% |
| D | 7442 | 103 | 1.384037% |
Noise dominated data is calculated using 1-second bins in cleaned event files. If a bin has >2000 counts, and if more than 50% of those come from <1% of pixels, then it is considered to be noise-dominated and hence unusable.
| Quadrant | # 1 sec bins | Bins with >0 counts | Bins with >2000 counts | High rate bins dominated by noise | Noise dominated (total time) | Noise dominated (detector-on time) | Marked lightcurve |
|---|---|---|---|---|---|---|---|
| A | 7881 | 7441 | 0 | 0 | 0.00% | 0.00% | 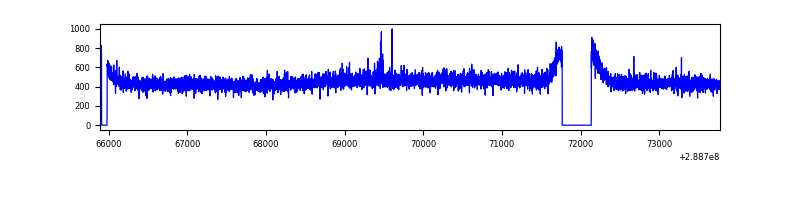 |
| B | 7882 | 7443 | 125 | 125 | 1.59% | 1.68% | 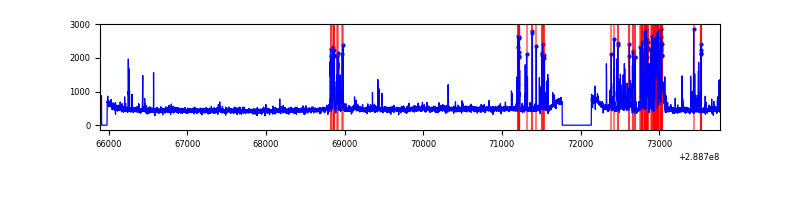 |
| C | 7881 | 7442 | 0 | 0 | 0.00% | 0.00% | 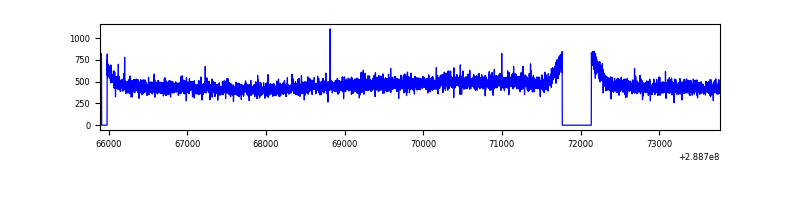 |
| D | 7882 | 7442 | 26 | 26 | 0.33% | 0.35% | 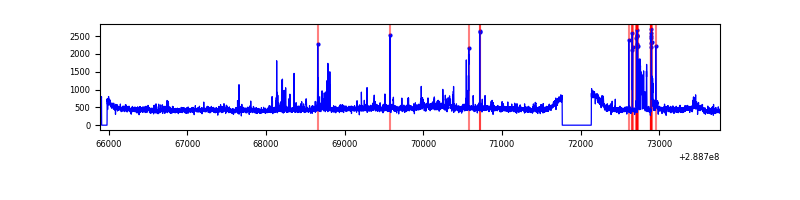 |
Top three noisy pixels from each quadrant. If the there are fewer than three noisy pixels in the level2.evt file, extra rows are filled as -1
| Pixel properties | Quadrant properties | ||||||
|---|---|---|---|---|---|---|---|
| Quadrant | DetID | PixID | Counts | Sigma | Mean | Median | Sigma |
| A | 0 | 226 | 7607 | 37.96 | 878 | 858 | 177.8 |
| A | 14 | 238 | 7162 | 35.45 | 878 | 858 | 177.8 |
| A | 3 | 137 | 6952 | 34.27 | 878 | 858 | 177.8 |
| B | 10 | 245 | 725747 | 4283.77 | 874 | 849 | 169.2 |
| B | 12 | 111 | 20346 | 115.21 | 874 | 849 | 169.2 |
| B | 11 | 111 | 17551 | 98.7 | 874 | 849 | 169.2 |
| C | 14 | 238 | 128910 | 641.77 | 845 | 848 | 199.5 |
| C | 3 | 233 | 10065 | 46.19 | 845 | 848 | 199.5 |
| C | 13 | 61 | 6046 | 26.05 | 845 | 848 | 199.5 |
| D | 14 | 34 | 174007 | 827.82 | 854 | 828 | 209.2 |
| D | 12 | 110 | 141935 | 674.51 | 854 | 828 | 209.2 |
| D | 13 | 168 | 50527 | 237.57 | 854 | 828 | 209.2 |
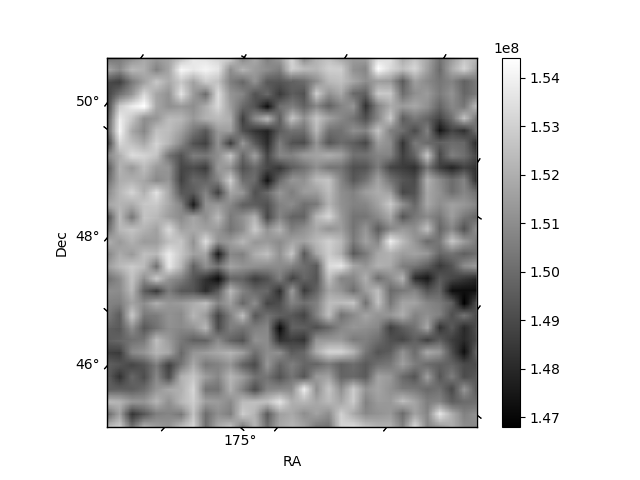
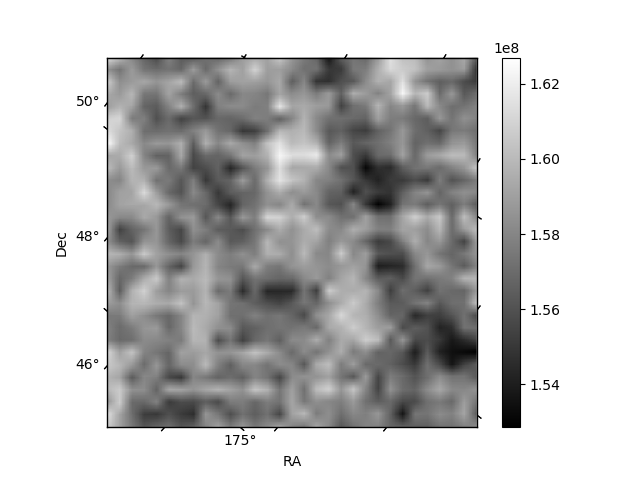
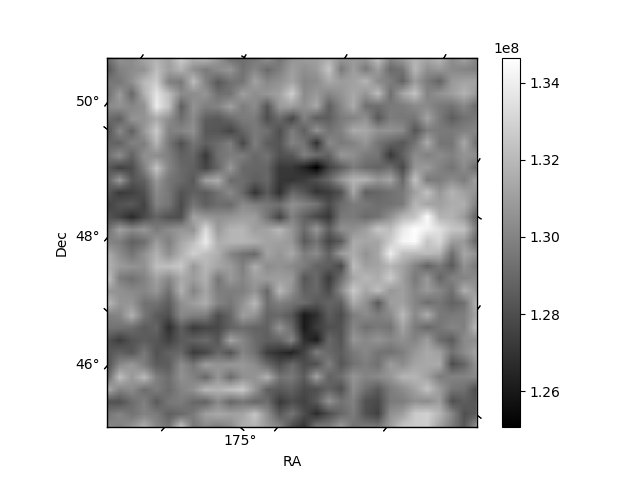
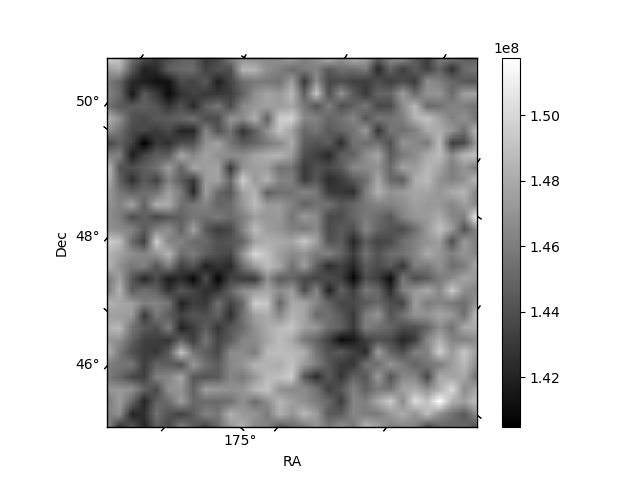
Histogram calculated using DETX and DETY for each event in the final _common_clean file
| Quadrant A |  |
 |
Quadrant B |
|---|---|---|---|
| Quadrant D |  |
 |
Quadrant C |
| Plot type | Count rate plots | Images |
|---|---|---|
| Comparison with Poisson distribution Blue bars denote a histogram of data divided into 1 sec bins. Red curve is a Poisson curve with rate = median count rate of data. |
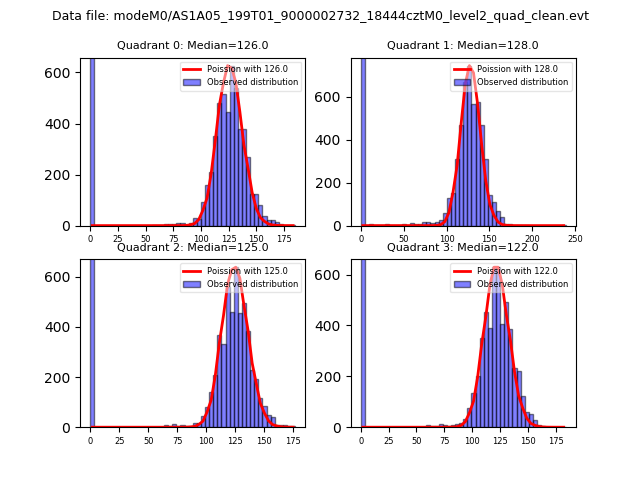 |
 |
| Quadrant-wise count rates Data is divided into 100 sec bins |
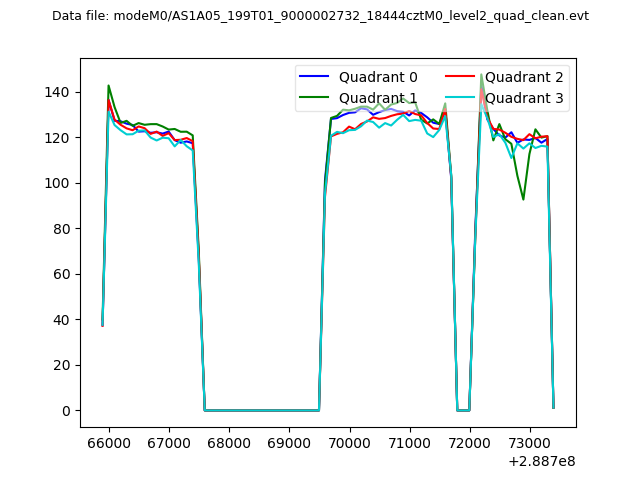 |
|
| Module-wise count rates for Quadrant A Data is divided into 100 sec bins |
 |
 |
| Module-wise count rates for Quadrant B Data is divided into 100 sec bins |
 |
 |
| Module-wise count rates for Quadrant C Data is divided into 100 sec bins |
 |
 |
| Module-wise count rates for Quadrant D Data is divided into 100 sec bins |
 |
 |
| Parameter | Plot |
|---|---|
| CZT HV Monitor |  |
| D_VDD |  |
| Temperature 1 |  |
| Veto HV Monitor |  |
| Veto LLD |  |
| Alpha Counter | 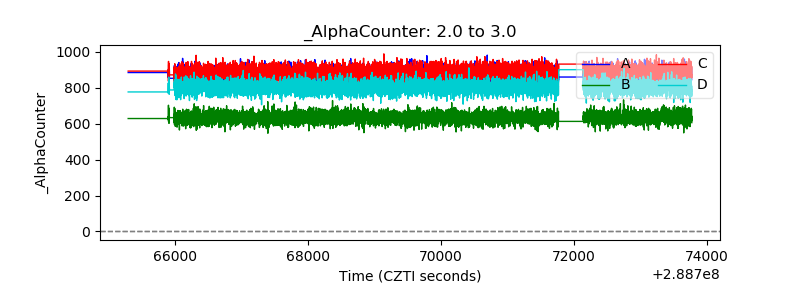 |
| _CPM_Rate | 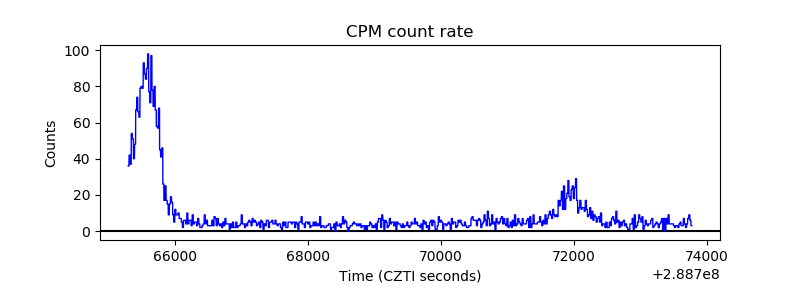 |
| CZT Counter |  |
| +2.5 Volts monitor |  |
| +5 Volts monitor |  |
| _ROLL_ROT |  |
| _Roll_DEC |  |
| _Roll_RA |  |
| Veto Counter |  |