| Param | Original file | Final file |
|---|---|---|
| Filename | modeM0/AS1A05_199T01_9000002732_18445cztM0_level2.evt | modeM0/AS1A05_199T01_9000002732_18445cztM0_level2_quad_clean.evt |
| Size (bytes) | 535,717,440 | 88,801,920 |
| Size | 510.9 MB | 84.7 MB |
| Events in quadrant A | 3,328,697 | 552,659 |
| Events in quadrant B | 5,192,887 | 546,694 |
| Events in quadrant C | 3,369,196 | 547,676 |
| Events in quadrant D | 3,839,294 | 534,980 |
| Mode M0 | |||
|---|---|---|---|
| Quadrant | BADHDUFLAG | Total packets | Discarded packets |
| A | 0 | 14886 | 1 |
| B | 0 | 20285 | 1 |
| C | 0 | 14871 | 1 |
| D | 0 | 16135 | 1 |
| Mode SS | |||
|---|---|---|---|
| Quadrant | BADHDUFLAG | Total packets | Discarded packets |
| A | 0 | 150 | 0 |
| B | 0 | 150 | 0 |
| C | 0 | 150 | 0 |
| D | 0 | 150 | 0 |
| Mode M9 | |||
|---|---|---|---|
| Quadrant | BADHDUFLAG | Total packets | Discarded packets |
| A | 0 | 2 | 0 |
| B | 0 | 2 | 0 |
| C | 0 | 2 | 0 |
| D | 0 | 2 | 0 |
| Quadrant | Total seconds | Saturated seconds | Saturation percentage |
|---|---|---|---|
| A | 7276 | 160 | 2.199010% |
| B | 7277 | 440 | 6.046448% |
| C | 7276 | 170 | 2.336449% |
| D | 7276 | 174 | 2.391424% |
Noise dominated data is calculated using 1-second bins in cleaned event files. If a bin has >2000 counts, and if more than 50% of those come from <1% of pixels, then it is considered to be noise-dominated and hence unusable.
| Quadrant | # 1 sec bins | Bins with >0 counts | Bins with >2000 counts | High rate bins dominated by noise | Noise dominated (total time) | Noise dominated (detector-on time) | Marked lightcurve |
|---|---|---|---|---|---|---|---|
| A | 7456 | 7276 | 0 | 0 | 0.00% | 0.00% | 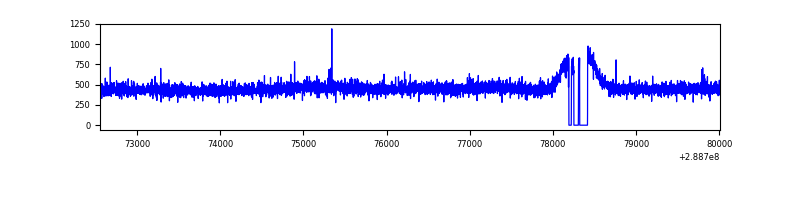 |
| B | 7457 | 7277 | 180 | 180 | 2.41% | 2.47% | 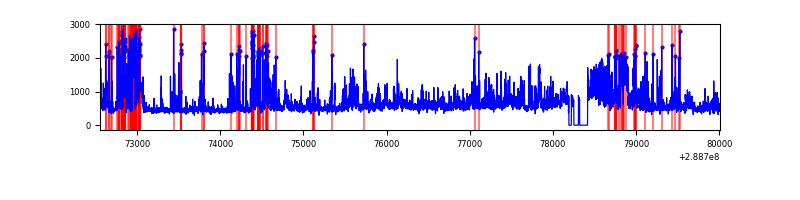 |
| C | 7456 | 7276 | 0 | 0 | 0.00% | 0.00% | 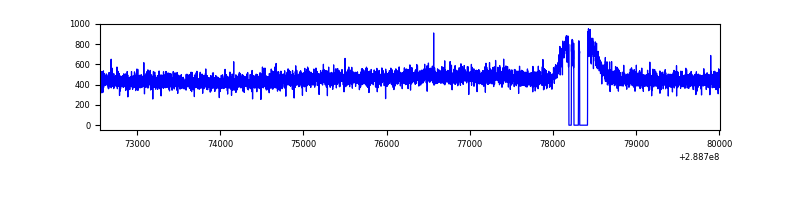 |
| D | 7455 | 7275 | 47 | 47 | 0.63% | 0.65% | 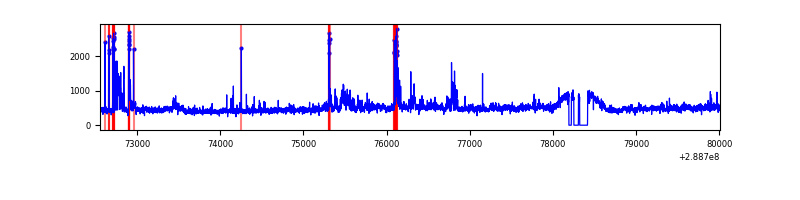 |
Top three noisy pixels from each quadrant. If the there are fewer than three noisy pixels in the level2.evt file, extra rows are filled as -1
| Pixel properties | Quadrant properties | ||||||
|---|---|---|---|---|---|---|---|
| Quadrant | DetID | PixID | Counts | Sigma | Mean | Median | Sigma |
| A | 0 | 226 | 7379 | 37.01 | 864 | 844 | 176.6 |
| A | 3 | 137 | 7014 | 34.94 | 864 | 844 | 176.6 |
| A | 12 | 194 | 6156 | 30.08 | 864 | 844 | 176.6 |
| B | 10 | 245 | 1835792 | 11150.6 | 850 | 827 | 164.6 |
| B | 0 | 244 | 24410 | 143.3 | 850 | 827 | 164.6 |
| B | 12 | 111 | 20239 | 117.96 | 850 | 827 | 164.6 |
| C | 14 | 238 | 126310 | 640.95 | 829 | 833 | 195.8 |
| C | 13 | 61 | 5856 | 25.66 | 829 | 833 | 195.8 |
| C | 8 | 128 | 5010 | 21.34 | 829 | 833 | 195.8 |
| D | 12 | 110 | 350435 | 1716.91 | 838 | 812 | 203.6 |
| D | 14 | 34 | 142522 | 695.9 | 838 | 812 | 203.6 |
| D | 13 | 168 | 68721 | 333.48 | 838 | 812 | 203.6 |
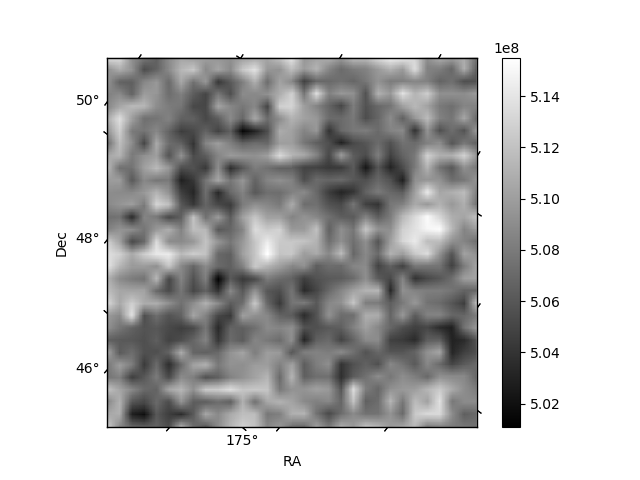
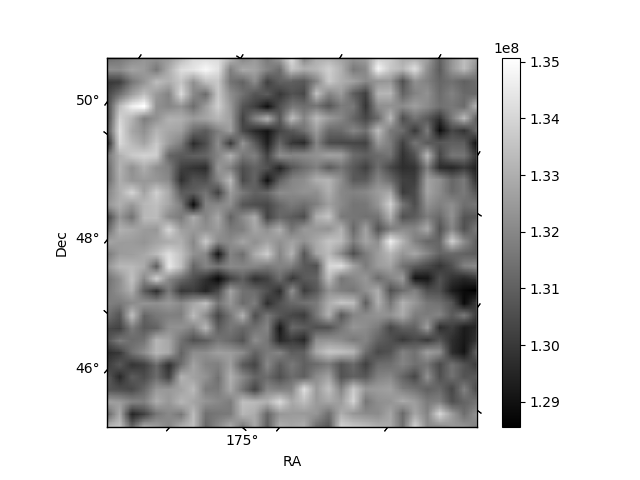
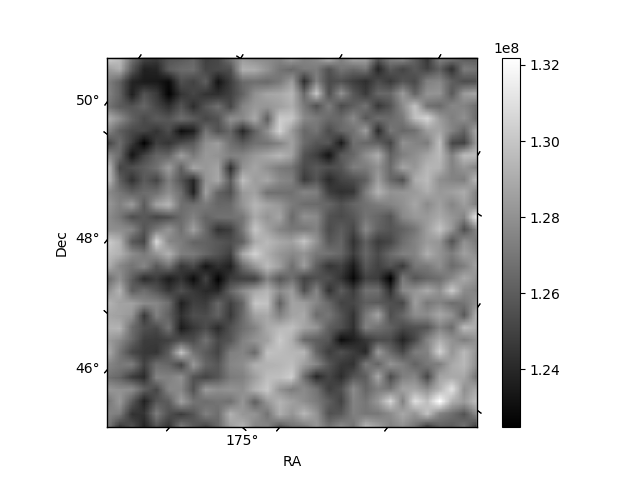
Histogram calculated using DETX and DETY for each event in the final _common_clean file
| Quadrant A | 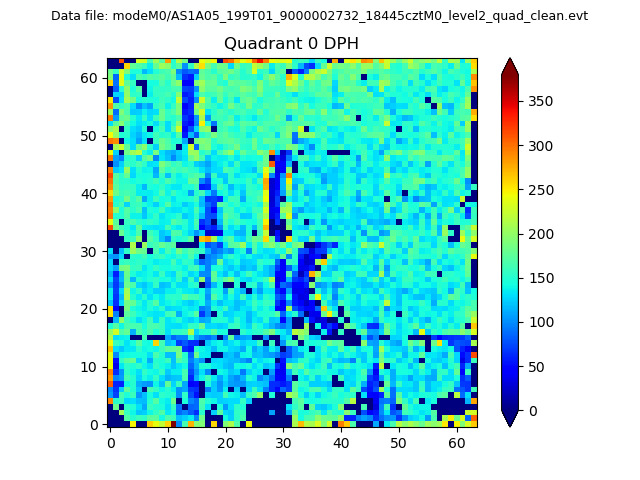 |
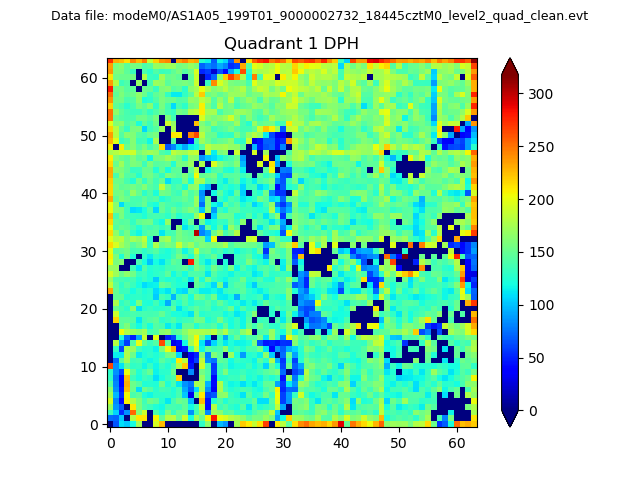 |
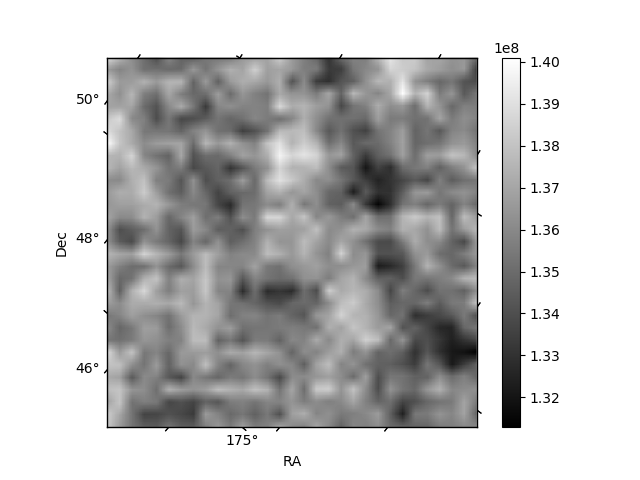
Quadrant B |
|---|---|---|---|
| Quadrant D | 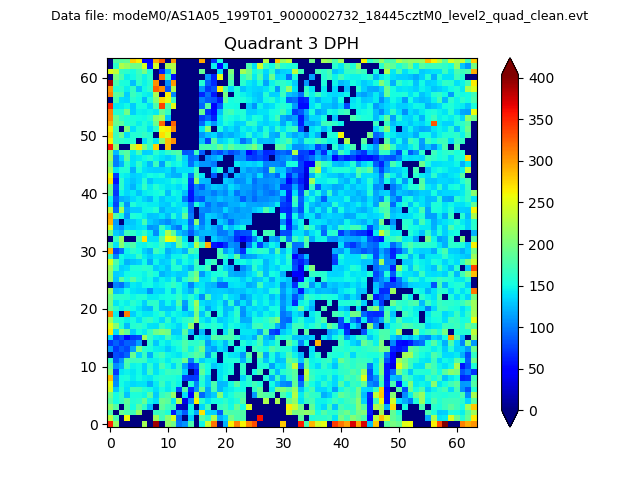 |
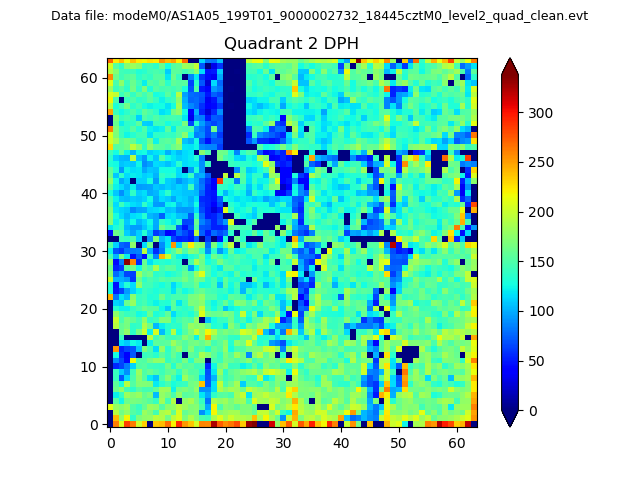 |
Quadrant C |
| Plot type | Count rate plots | Images |
|---|---|---|
| Comparison with Poisson distribution Blue bars denote a histogram of data divided into 1 sec bins. Red curve is a Poisson curve with rate = median count rate of data. |
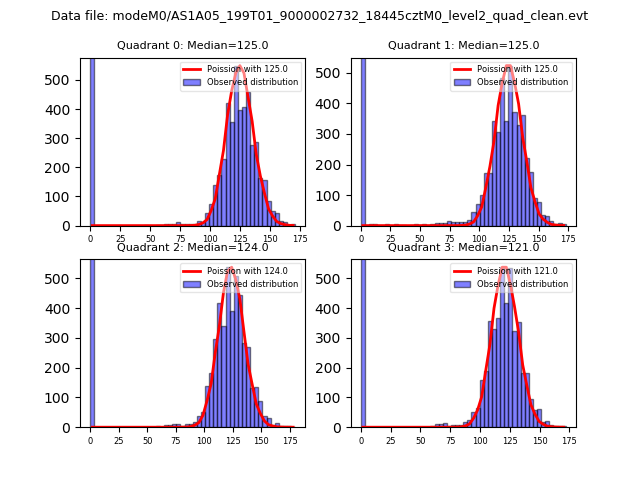 |
 |
| Quadrant-wise count rates Data is divided into 100 sec bins |
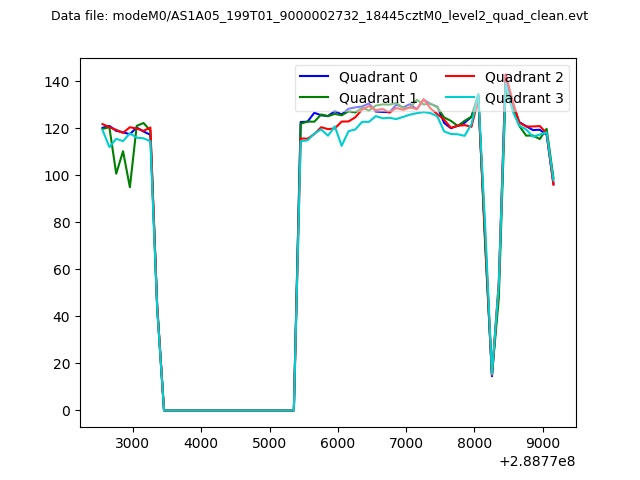 |
|
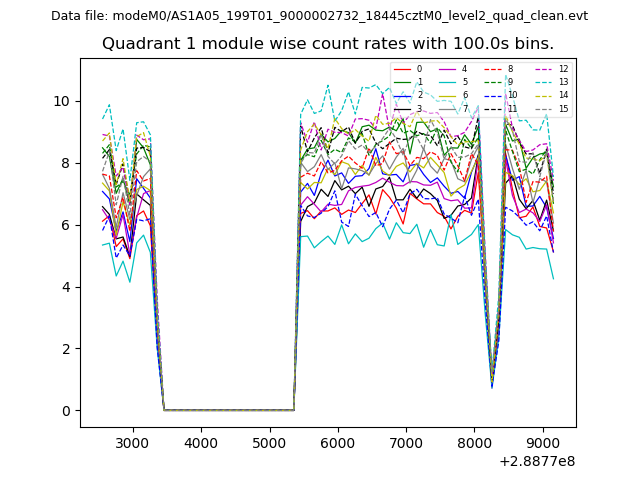
| Module-wise count rates for Quadrant A Data is divided into 100 sec bins |
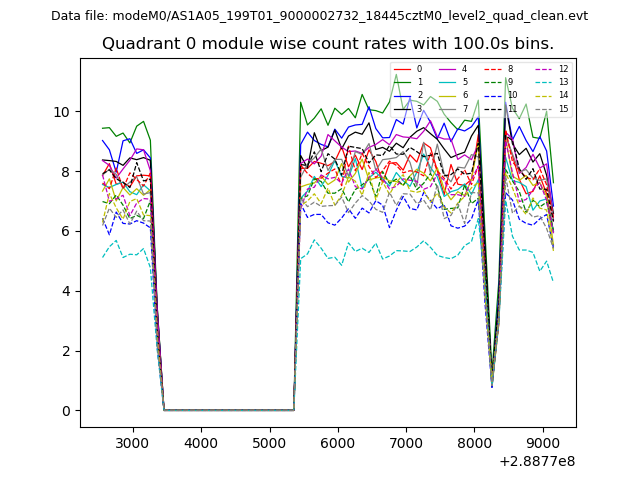 |
 |
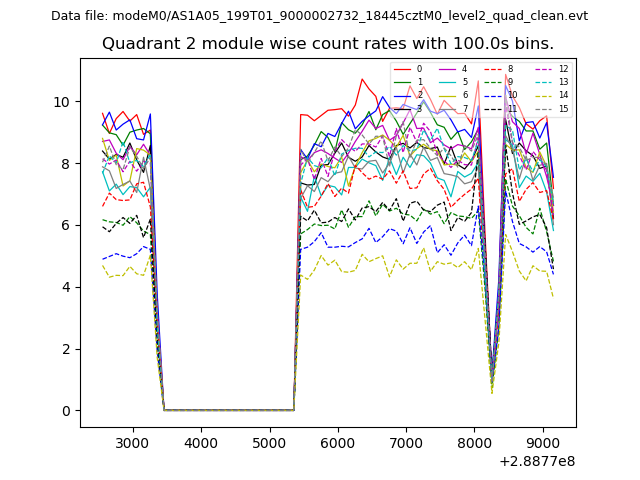
| Module-wise count rates for Quadrant B Data is divided into 100 sec bins |
 |
 |
| Module-wise count rates for Quadrant C Data is divided into 100 sec bins |
 |
 |
| Module-wise count rates for Quadrant D Data is divided into 100 sec bins |
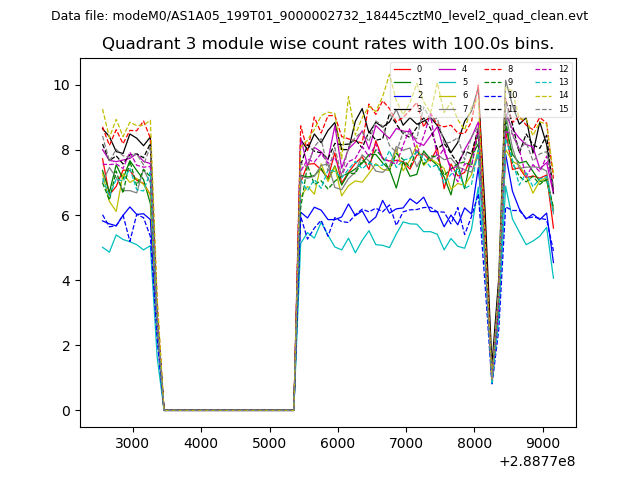 |
 |
| Parameter | Plot |
|---|---|
| CZT HV Monitor | 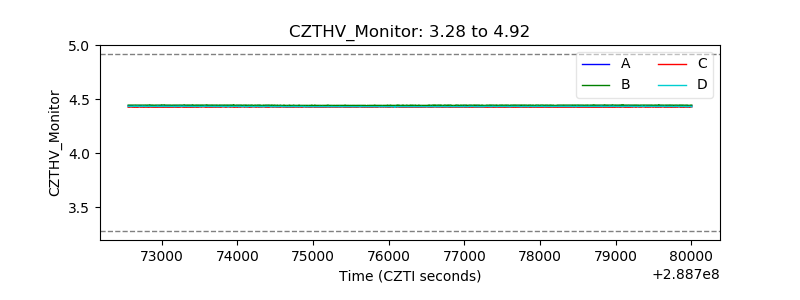 |
| D_VDD | 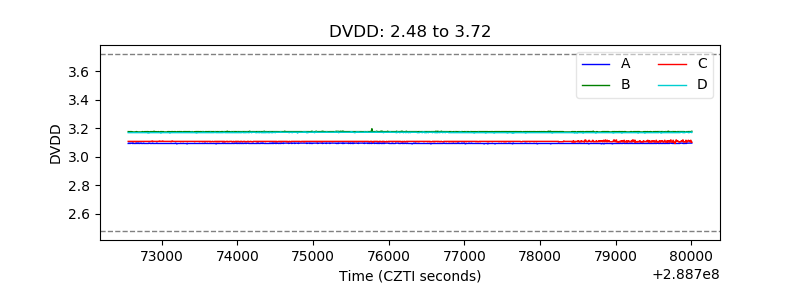 |
| Temperature 1 | 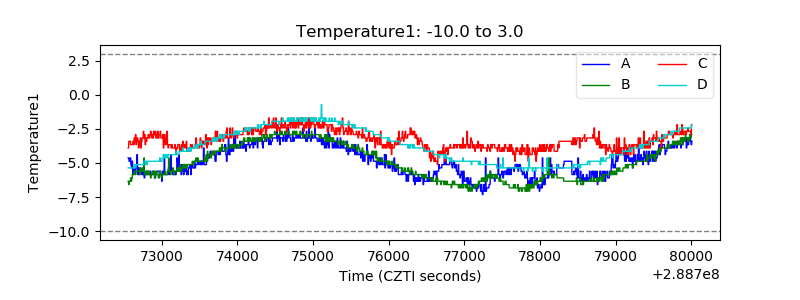 |
| Veto HV Monitor | 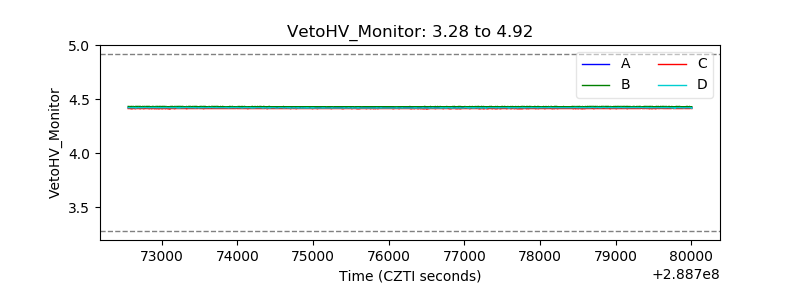 |
| Veto LLD | 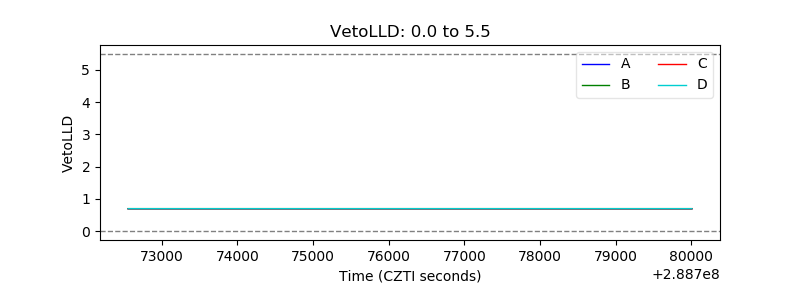 |
| Alpha Counter | 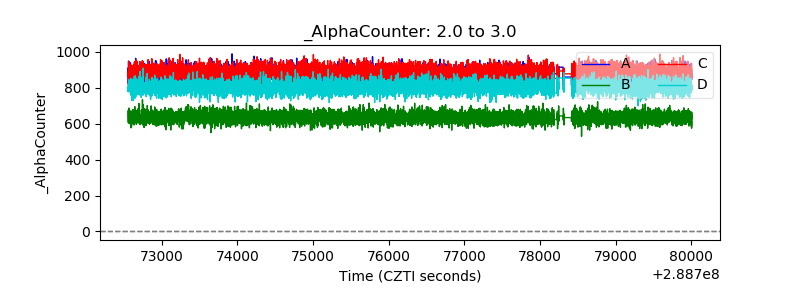 |
| _CPM_Rate | 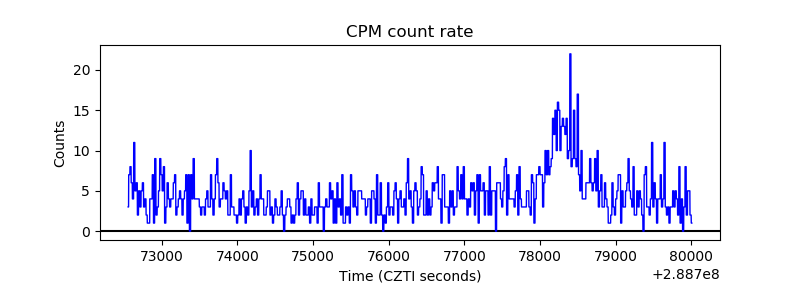 |
| CZT Counter | 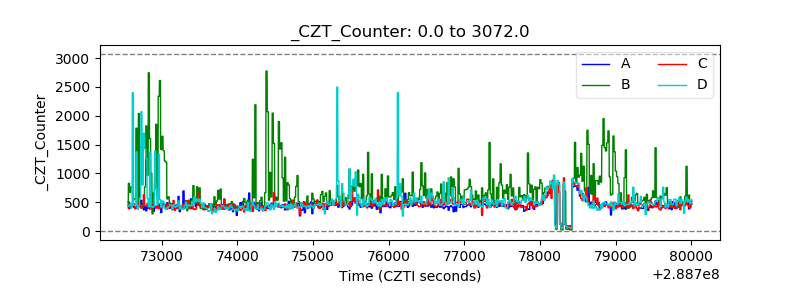 |
| +2.5 Volts monitor |  |
| +5 Volts monitor |  |
| _ROLL_ROT |  |
| _Roll_DEC |  |
| _Roll_RA | 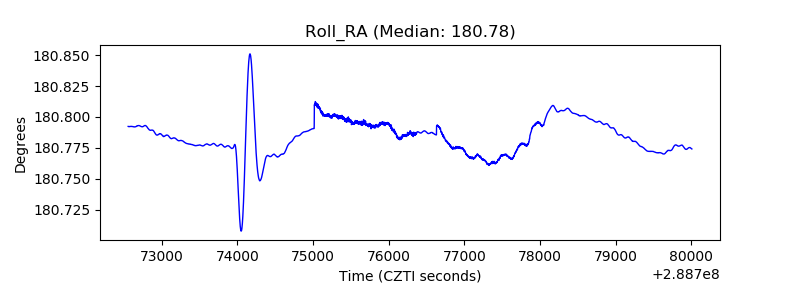 |
| Veto Counter | 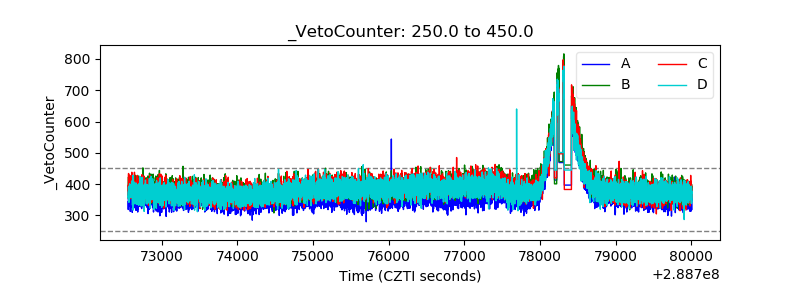 |