| Param | Original file | Final file |
|---|---|---|
| Filename | modeM0/AS1A05_199T01_9000002732_18446cztM0_level2.evt | modeM0/AS1A05_199T01_9000002732_18446cztM0_level2_quad_clean.evt |
| Size (bytes) | 512,671,680 | 78,860,160 |
| Size | 488.9 MB | 75.2 MB |
| Events in quadrant A | 3,313,199 | 476,204 |
| Events in quadrant B | 4,458,935 | 480,026 |
| Events in quadrant C | 3,453,970 | 466,660 |
| Events in quadrant D | 3,808,559 | 460,624 |
| Mode M0 | |||
|---|---|---|---|
| Quadrant | BADHDUFLAG | Total packets | Discarded packets |
| A | 0 | 14726 | 1 |
| B | 0 | 17840 | 1 |
| C | 0 | 14964 | 1 |
| D | 0 | 15869 | 1 |
| Mode SS | |||
|---|---|---|---|
| Quadrant | BADHDUFLAG | Total packets | Discarded packets |
| A | 0 | 148 | 0 |
| B | 0 | 148 | 0 |
| C | 0 | 148 | 0 |
| D | 0 | 148 | 0 |
| Mode M9 | |||
|---|---|---|---|
| Quadrant | BADHDUFLAG | Total packets | Discarded packets |
| A | 0 | 3 | 0 |
| B | 0 | 3 | 0 |
| C | 0 | 3 | 0 |
| D | 0 | 3 | 0 |
| Quadrant | Total seconds | Saturated seconds | Saturation percentage |
|---|---|---|---|
| A | 7239 | 108 | 1.491919% |
| B | 7239 | 203 | 2.804255% |
| C | 7239 | 147 | 2.030667% |
| D | 7239 | 88 | 1.215638% |
Noise dominated data is calculated using 1-second bins in cleaned event files. If a bin has >2000 counts, and if more than 50% of those come from <1% of pixels, then it is considered to be noise-dominated and hence unusable.
| Quadrant | # 1 sec bins | Bins with >0 counts | Bins with >2000 counts | High rate bins dominated by noise | Noise dominated (total time) | Noise dominated (detector-on time) | Marked lightcurve |
|---|---|---|---|---|---|---|---|
| A | 7584 | 7239 | 0 | 0 | 0.00% | 0.00% | 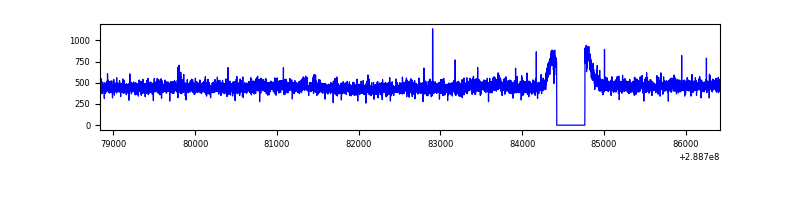 |
| B | 7583 | 7238 | 54 | 54 | 0.71% | 0.75% | 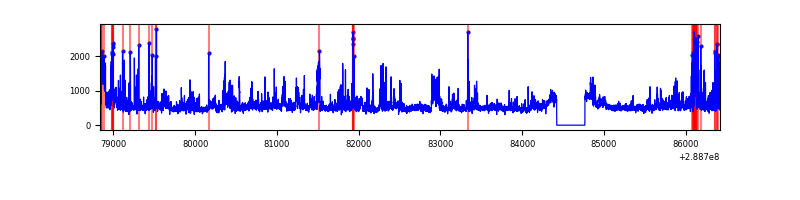 |
| C | 7584 | 7239 | 7 | 7 | 0.09% | 0.10% | 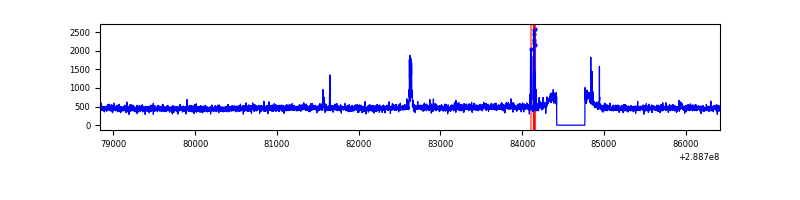 |
| D | 7584 | 7239 | 0 | 0 | 0.00% | 0.00% | 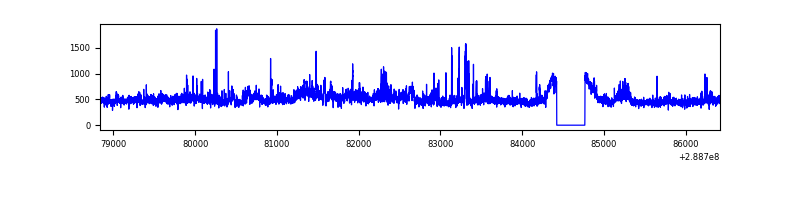 |
Top three noisy pixels from each quadrant. If the there are fewer than three noisy pixels in the level2.evt file, extra rows are filled as -1
| Pixel properties | Quadrant properties | ||||||
|---|---|---|---|---|---|---|---|
| Quadrant | DetID | PixID | Counts | Sigma | Mean | Median | Sigma |
| A | 0 | 226 | 7537 | 38.26 | 859 | 838 | 175.1 |
| A | 3 | 137 | 6913 | 34.7 | 859 | 838 | 175.1 |
| A | 12 | 194 | 6215 | 30.71 | 859 | 838 | 175.1 |
| B | 10 | 245 | 1107035 | 6675.98 | 852 | 829 | 165.7 |
| B | 12 | 111 | 20339 | 117.74 | 852 | 829 | 165.7 |
| B | 11 | 111 | 17745 | 102.09 | 852 | 829 | 165.7 |
| C | 14 | 238 | 125685 | 643.77 | 820 | 821 | 194.0 |
| C | 3 | 233 | 67238 | 342.43 | 820 | 821 | 194.0 |
| C | 9 | 54 | 37816 | 190.74 | 820 | 821 | 194.0 |
| D | 12 | 110 | 501028 | 2452.68 | 833 | 806 | 203.9 |
| D | 13 | 168 | 119681 | 582.86 | 833 | 806 | 203.9 |
| D | 2 | 234 | 32569 | 155.74 | 833 | 806 | 203.9 |
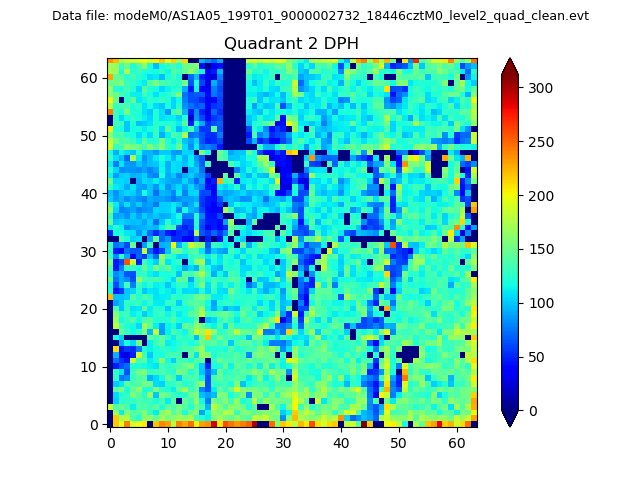
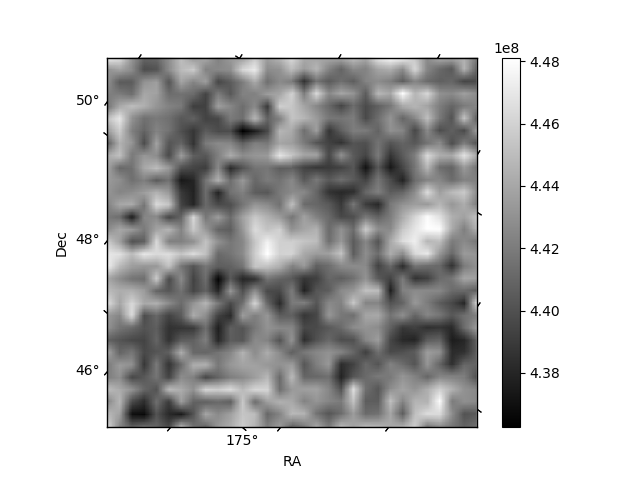
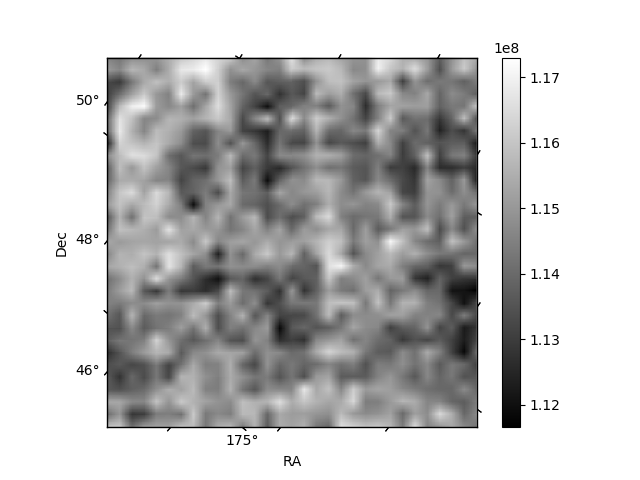
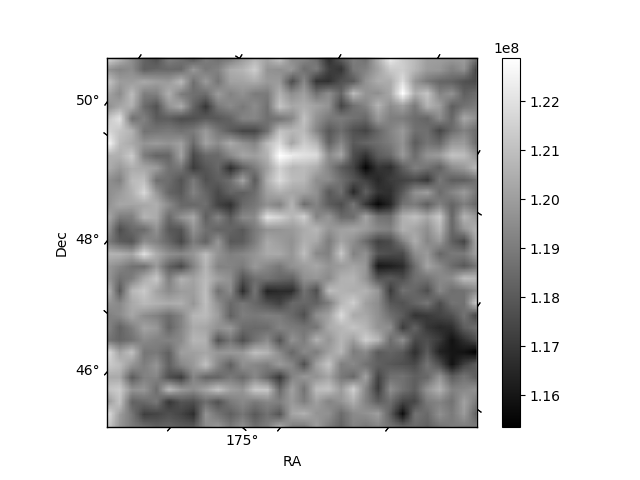
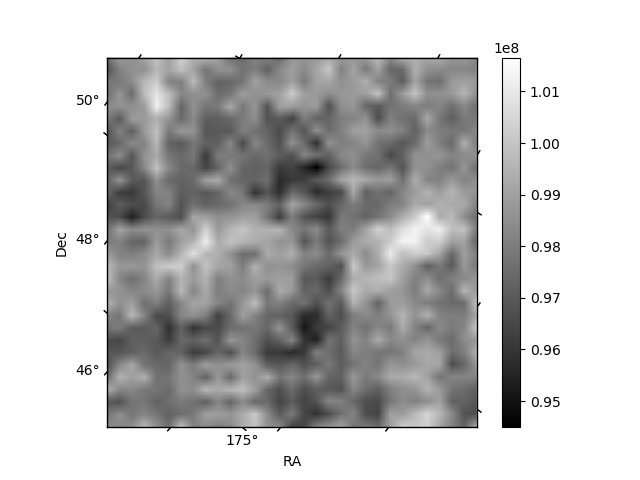
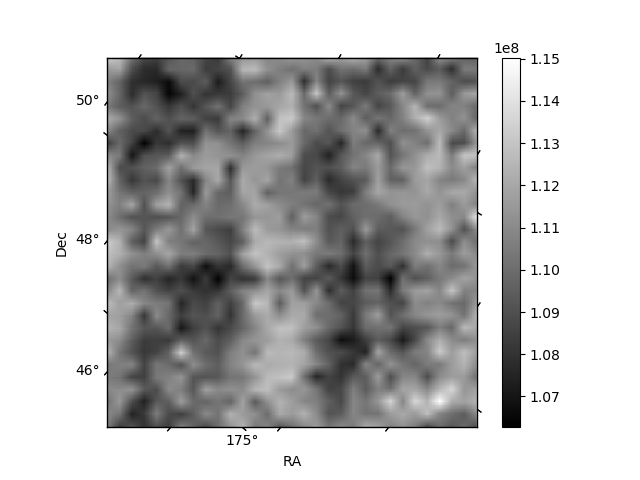
Histogram calculated using DETX and DETY for each event in the final _common_clean file
| Quadrant A | 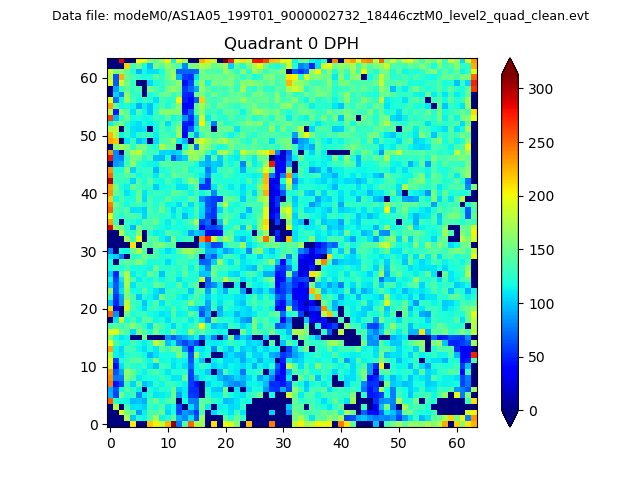 |
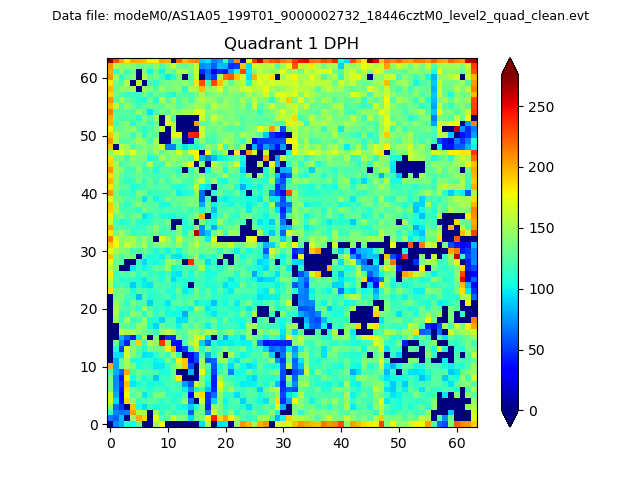 |
Quadrant B |
|---|---|---|---|
| Quadrant D | 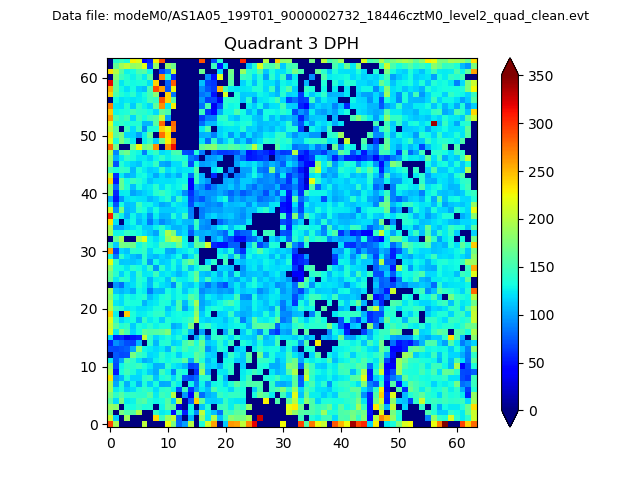 |
 |
Quadrant C |
| Plot type | Count rate plots | Images |
|---|---|---|
| Comparison with Poisson distribution Blue bars denote a histogram of data divided into 1 sec bins. Red curve is a Poisson curve with rate = median count rate of data. |
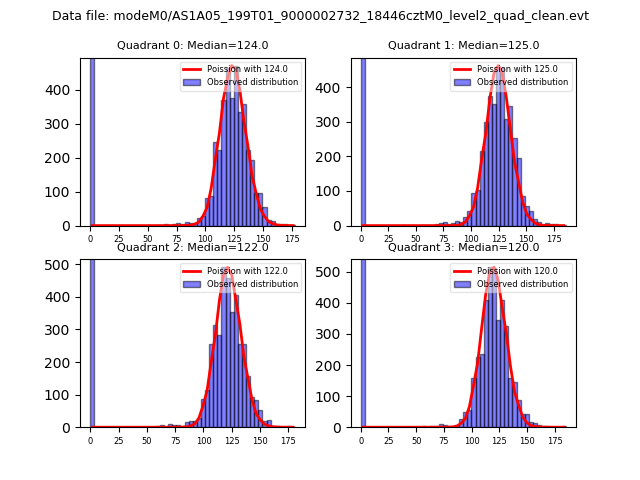 |
 |
| Quadrant-wise count rates Data is divided into 100 sec bins |
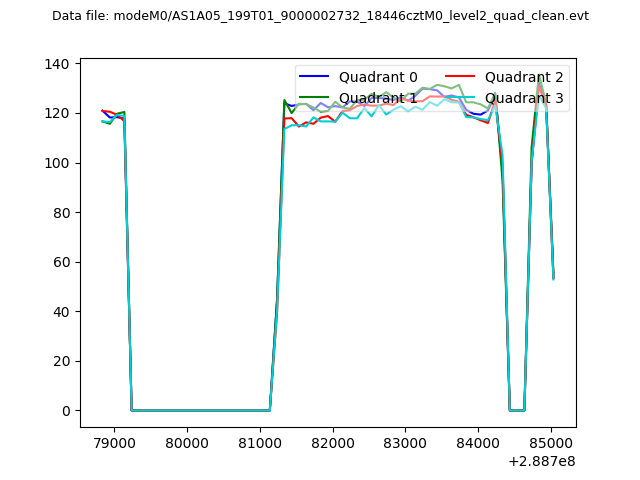 |
|
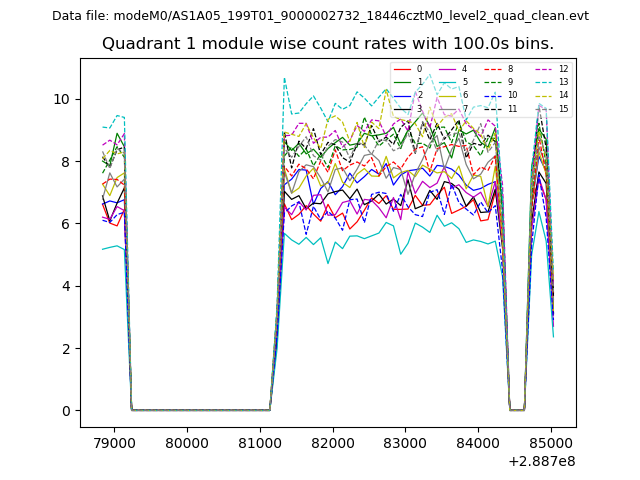
| Module-wise count rates for Quadrant A Data is divided into 100 sec bins |
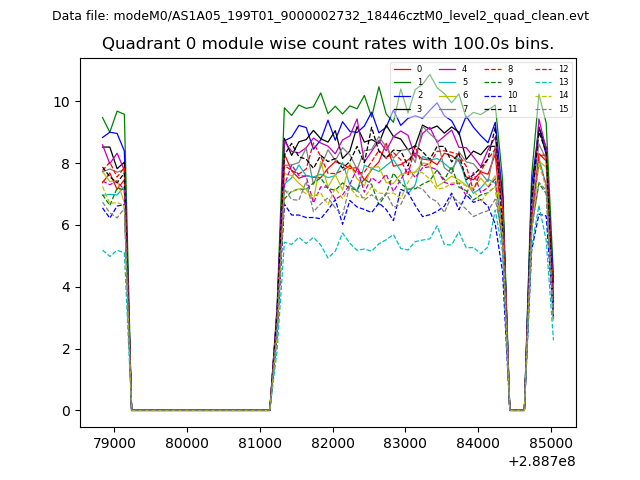 |
 |
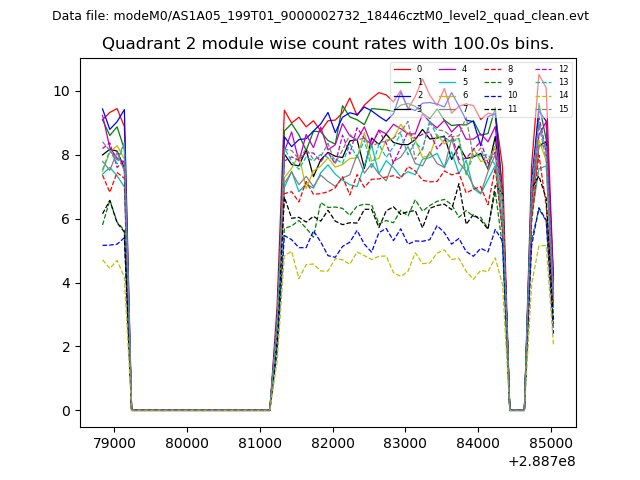
| Module-wise count rates for Quadrant B Data is divided into 100 sec bins |
 |
 |
| Module-wise count rates for Quadrant C Data is divided into 100 sec bins |
 |
 |
| Module-wise count rates for Quadrant D Data is divided into 100 sec bins |
 |
 |
| Parameter | Plot |
|---|---|
| CZT HV Monitor | 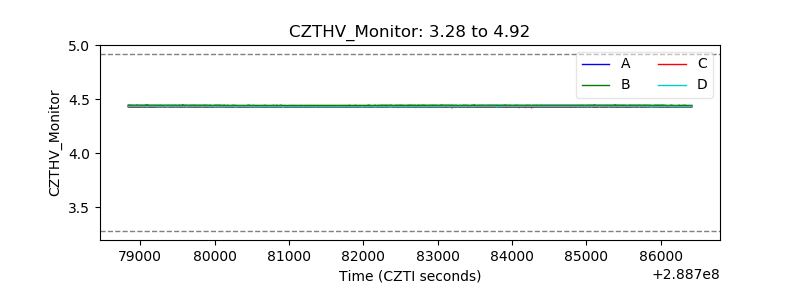 |
| D_VDD |  |
| Temperature 1 | 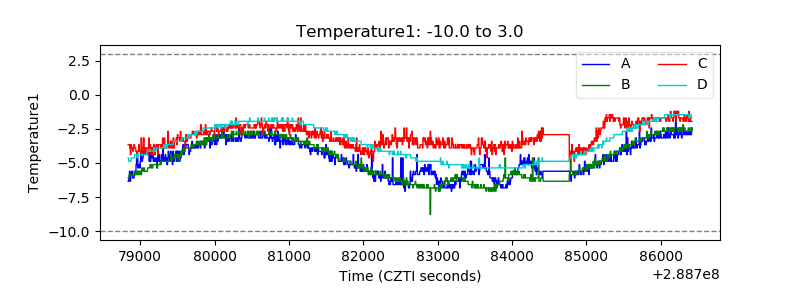 |
| Veto HV Monitor | 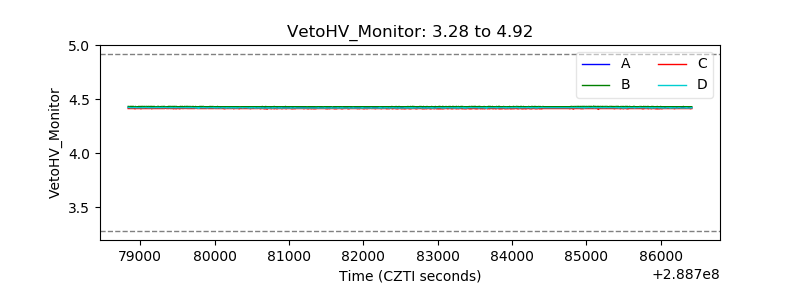 |
| Veto LLD |  |
| Alpha Counter | 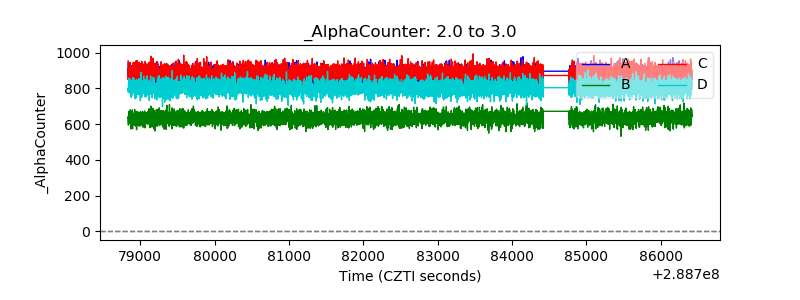 |
| _CPM_Rate | 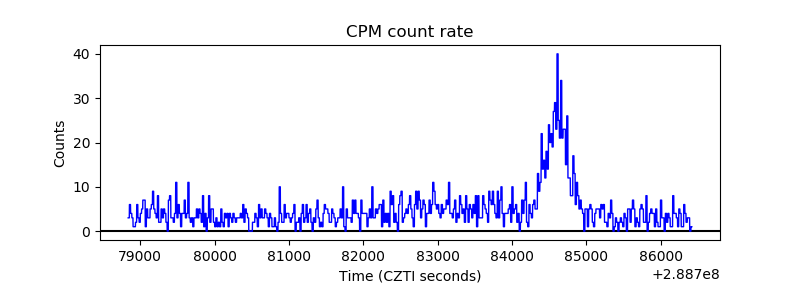 |
| CZT Counter | 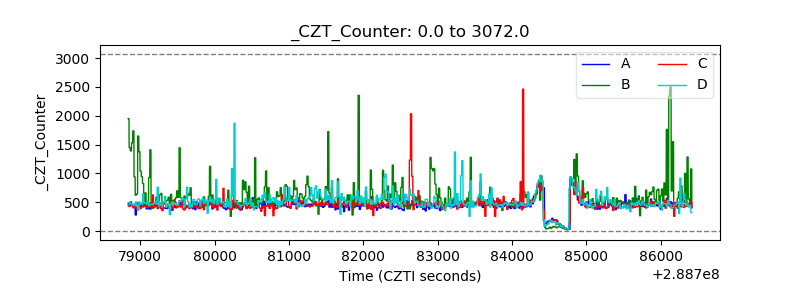 |
| +2.5 Volts monitor |  |
| +5 Volts monitor |  |
| _ROLL_ROT |  |
| _Roll_DEC | 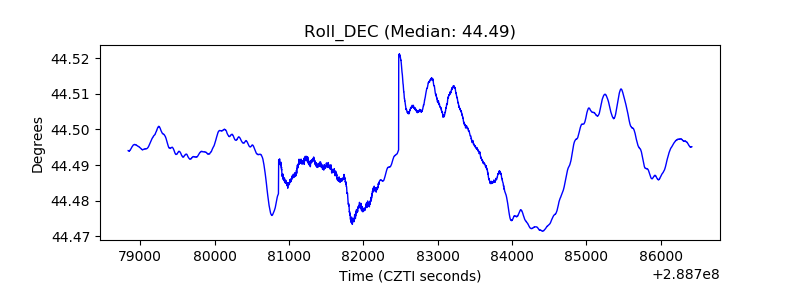 |
| _Roll_RA | 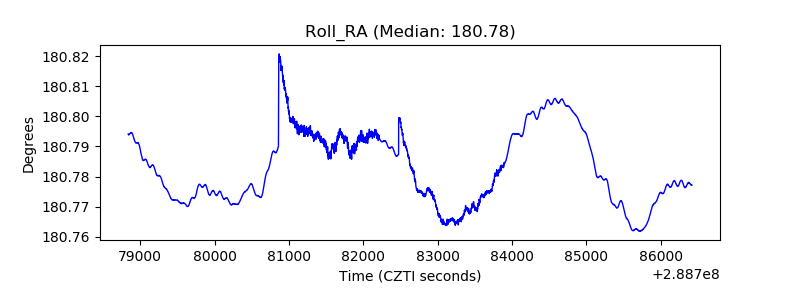 |
| Veto Counter | 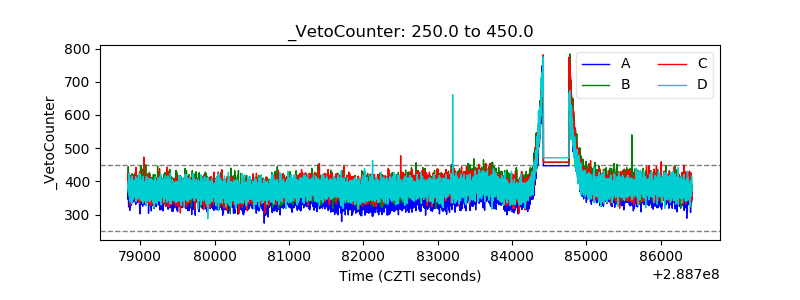 |