| Param | Original file | Final file |
|---|---|---|
| Filename | modeM0/AS1A05_199T01_9000002732_18449cztM0_level2.evt | modeM0/AS1A05_199T01_9000002732_18449cztM0_level2_quad_clean.evt |
| Size (bytes) | 1,356,704,640 | 228,939,840 |
| Size | 1.3 GB | 218.3 MB |
| Events in quadrant A | 8,632,471 | 1,442,072 |
| Events in quadrant B | 13,507,953 | 1,417,265 |
| Events in quadrant C | 8,617,990 | 1,414,885 |
| Events in quadrant D | 9,090,351 | 1,395,610 |
| Mode M0 | |||
|---|---|---|---|
| Quadrant | BADHDUFLAG | Total packets | Discarded packets |
| A | 0 | 37889 | 4 |
| B | 0 | 52009 | 4 |
| C | 0 | 37525 | 4 |
| D | 0 | 39381 | 5 |
| Mode SS | |||
|---|---|---|---|
| Quadrant | BADHDUFLAG | Total packets | Discarded packets |
| A | 0 | 376 | 0 |
| B | 0 | 376 | 0 |
| C | 0 | 376 | 0 |
| D | 0 | 376 | 0 |
| Mode M9 | |||
|---|---|---|---|
| Quadrant | BADHDUFLAG | Total packets | Discarded packets |
| A | 0 | 24 | 0 |
| B | 0 | 24 | 0 |
| C | 0 | 24 | 0 |
| D | 0 | 24 | 0 |
| Quadrant | Total seconds | Saturated seconds | Saturation percentage |
|---|---|---|---|
| A | 18332 | 329 | 1.794676% |
| B | 18333 | 1420 | 7.745595% |
| C | 18333 | 354 | 1.930944% |
| D | 18332 | 254 | 1.385555% |
Noise dominated data is calculated using 1-second bins in cleaned event files. If a bin has >2000 counts, and if more than 50% of those come from <1% of pixels, then it is considered to be noise-dominated and hence unusable.
| Quadrant | # 1 sec bins | Bins with >0 counts | Bins with >2000 counts | High rate bins dominated by noise | Noise dominated (total time) | Noise dominated (detector-on time) | Marked lightcurve |
|---|---|---|---|---|---|---|---|
| A | 20807 | 18332 | 24 | 24 | 0.12% | 0.13% | 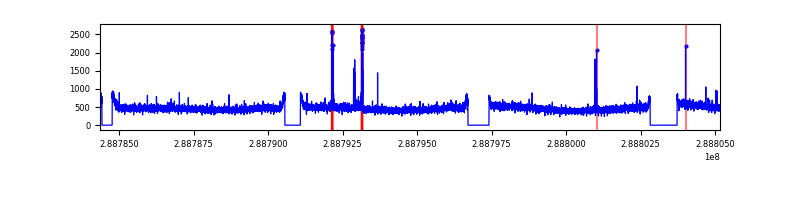 |
| B | 20808 | 18333 | 891 | 891 | 4.28% | 4.86% | 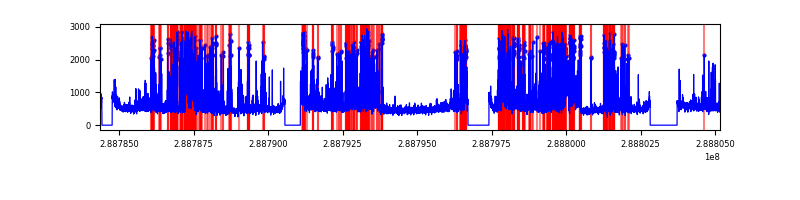 |
| C | 20808 | 18333 | 0 | 0 | 0.00% | 0.00% | 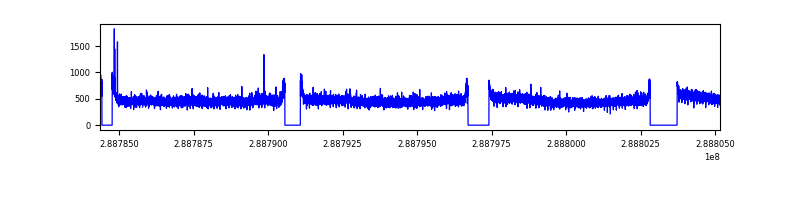 |
| D | 20807 | 18332 | 15 | 15 | 0.07% | 0.08% | 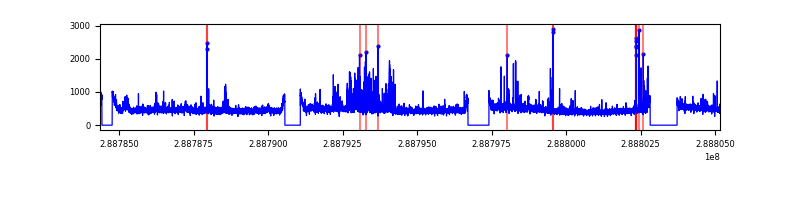 |
Top three noisy pixels from each quadrant. If the there are fewer than three noisy pixels in the level2.evt file, extra rows are filled as -1
| Pixel properties | Quadrant properties | ||||||
|---|---|---|---|---|---|---|---|
| Quadrant | DetID | PixID | Counts | Sigma | Mean | Median | Sigma |
| A | 4 | 2 | 116714 | 259.21 | 2201 | 2155 | 442.0 |
| A | 14 | 238 | 24621 | 50.83 | 2201 | 2155 | 442.0 |
| A | 15 | 174 | 21260 | 43.23 | 2201 | 2155 | 442.0 |
| B | 10 | 245 | 4996775 | 12061.59 | 2150 | 2091 | 414.1 |
| B | 12 | 111 | 50219 | 116.22 | 2150 | 2091 | 414.1 |
| B | 11 | 111 | 43719 | 100.53 | 2150 | 2091 | 414.1 |
| C | 14 | 238 | 326660 | 656.38 | 2115 | 2121 | 494.4 |
| C | 3 | 233 | 34431 | 65.35 | 2115 | 2121 | 494.4 |
| C | 13 | 61 | 15043 | 26.13 | 2115 | 2121 | 494.4 |
| D | 13 | 168 | 478537 | 915.09 | 2146 | 2079 | 520.7 |
| D | 12 | 110 | 330559 | 630.88 | 2146 | 2079 | 520.7 |
| D | 2 | 234 | 83277 | 155.95 | 2146 | 2079 | 520.7 |
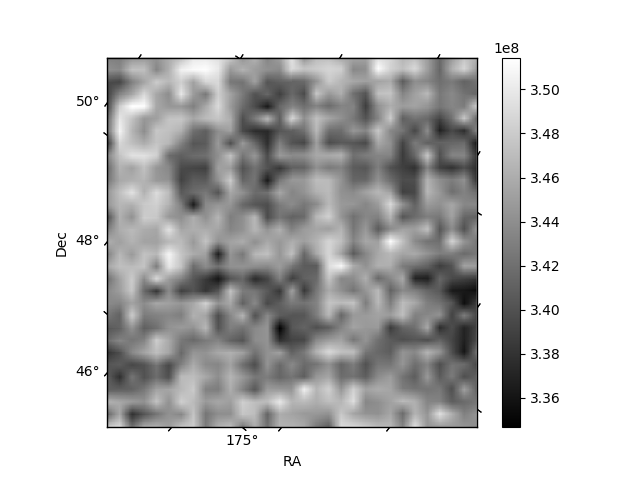
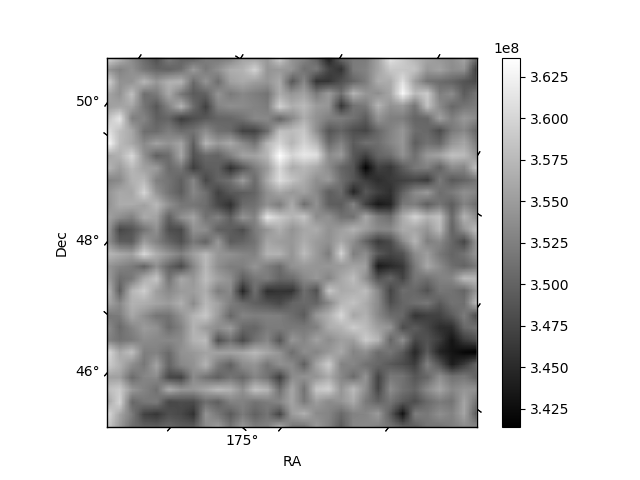
Histogram calculated using DETX and DETY for each event in the final _common_clean file
| Quadrant A | 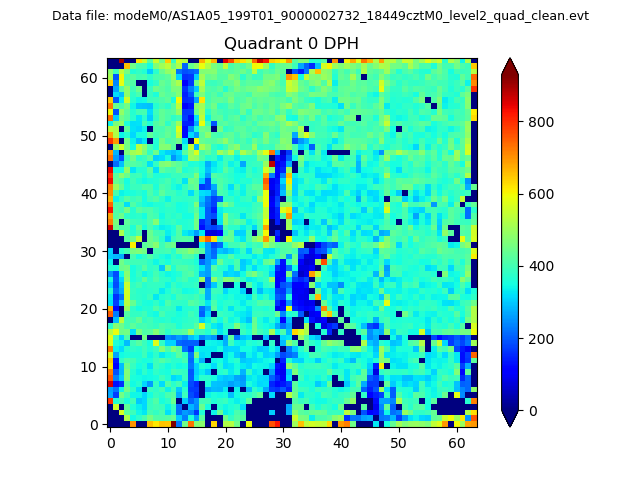 |
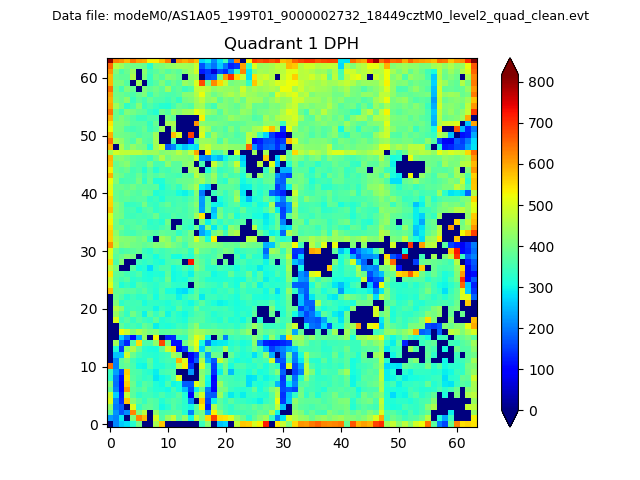 |
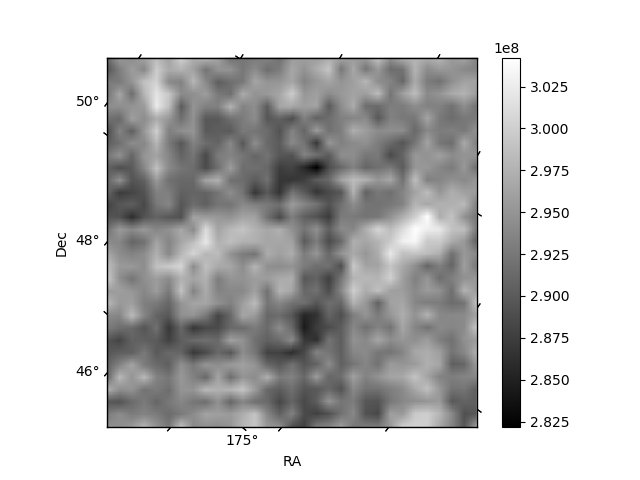
Quadrant B |
|---|---|---|---|
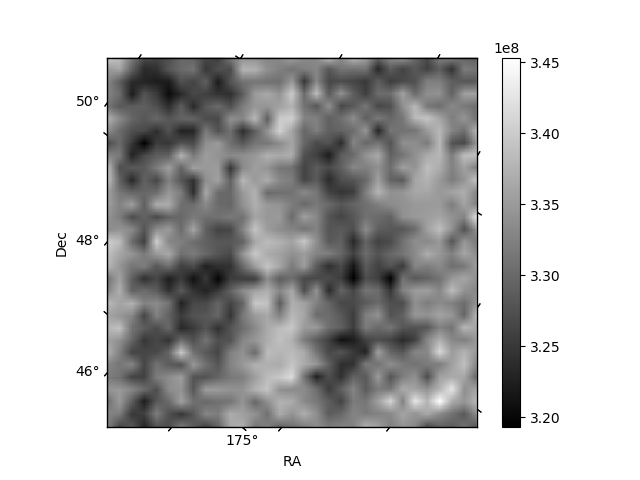
| Quadrant D |  |
 |
Quadrant C |
| Plot type | Count rate plots | Images |
|---|---|---|
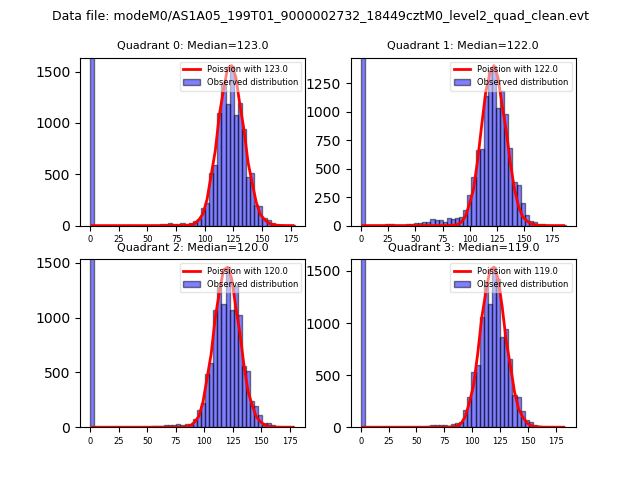
| Comparison with Poisson distribution Blue bars denote a histogram of data divided into 1 sec bins. Red curve is a Poisson curve with rate = median count rate of data. |
 |
 |
| Quadrant-wise count rates Data is divided into 100 sec bins |
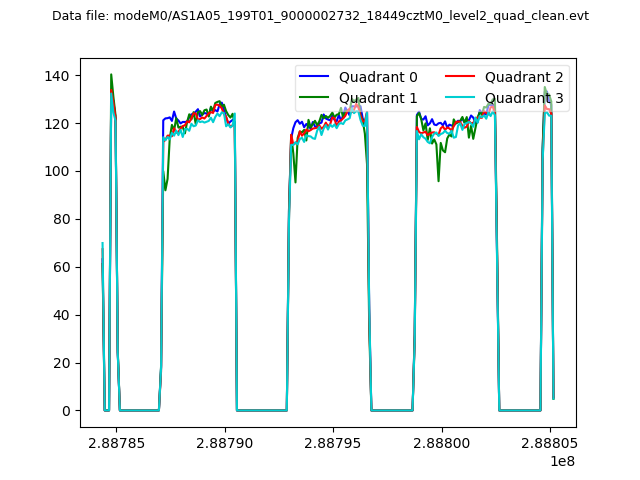 |
|
| Module-wise count rates for Quadrant A Data is divided into 100 sec bins |
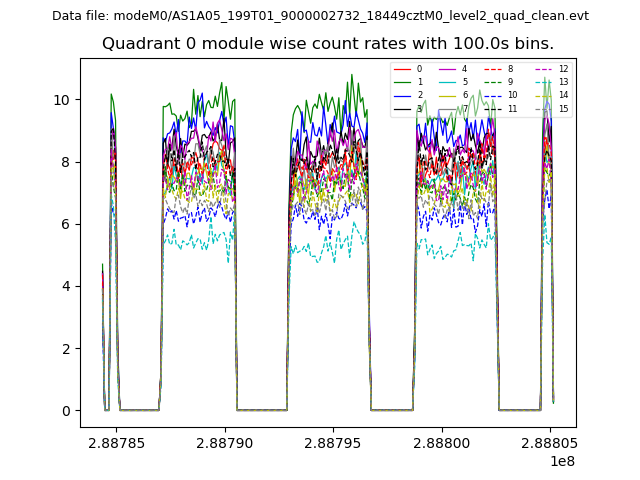 |
 |
| Module-wise count rates for Quadrant B Data is divided into 100 sec bins |
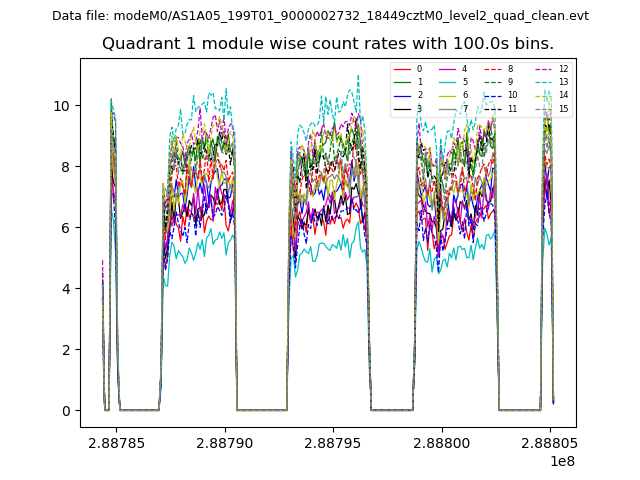 |
 |
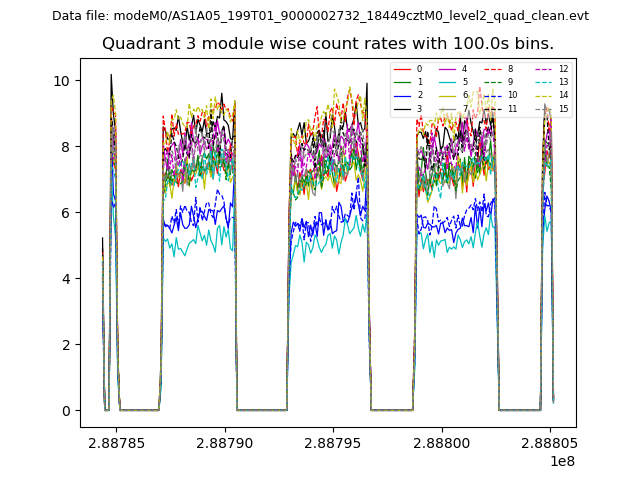
| Module-wise count rates for Quadrant C Data is divided into 100 sec bins |
 |
 |
| Module-wise count rates for Quadrant D Data is divided into 100 sec bins |
 |
 |
| Parameter | Plot |
|---|---|
| CZT HV Monitor | 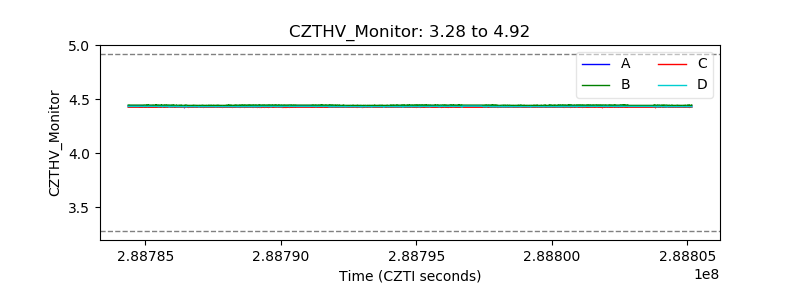 |
| D_VDD | 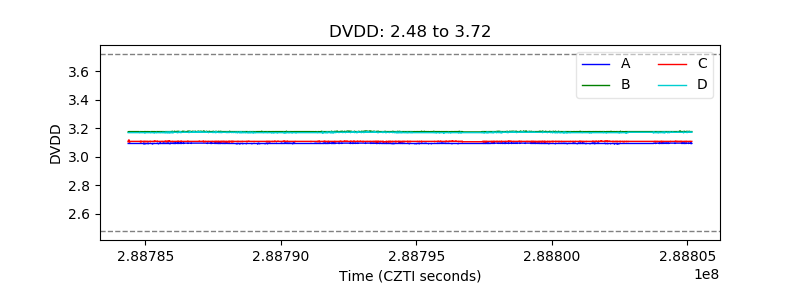 |
| Temperature 1 | 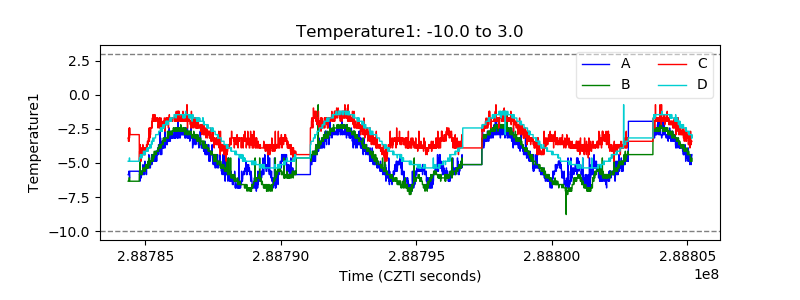 |
| Veto HV Monitor | 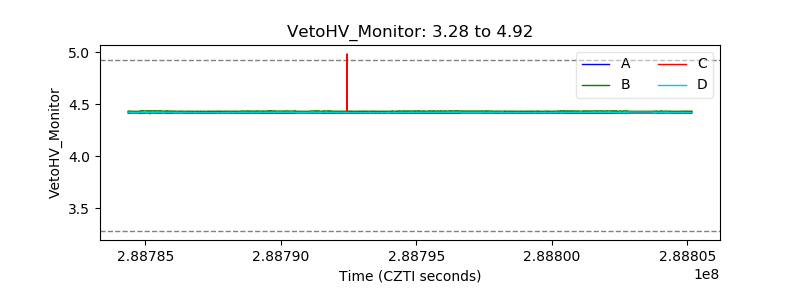 |
| Veto LLD |  |
| Alpha Counter | 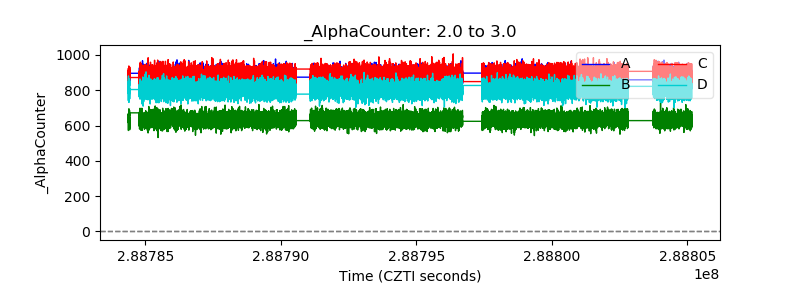 |
| _CPM_Rate | 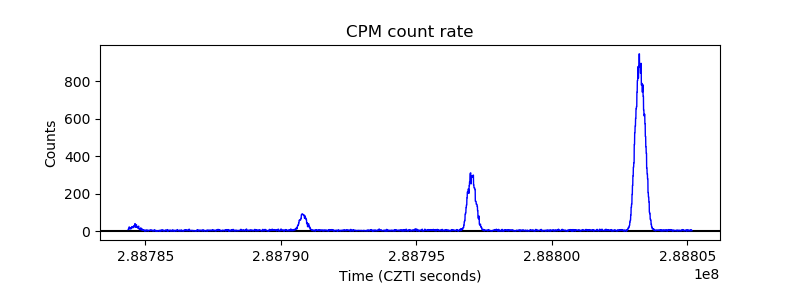 |
| CZT Counter |  |
| +2.5 Volts monitor |  |
| +5 Volts monitor |  |
| _ROLL_ROT | 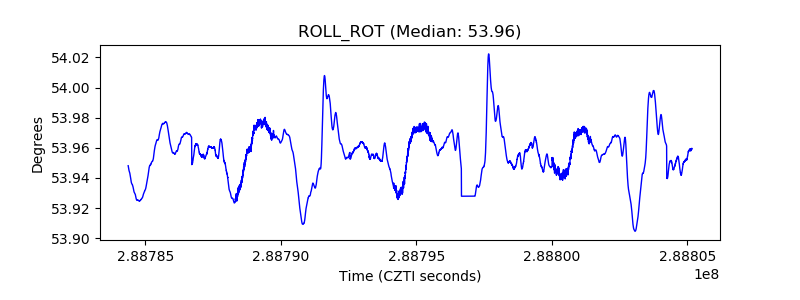 |
| _Roll_DEC | 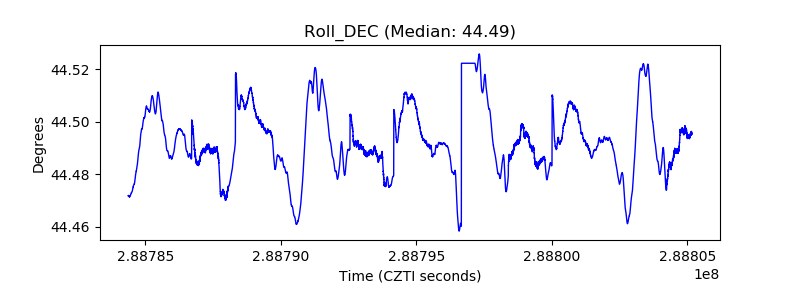 |
| _Roll_RA |  |
| Veto Counter | 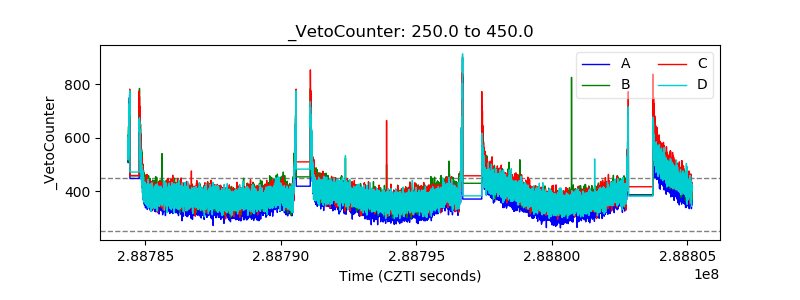 |