| Param | Original file | Final file |
|---|---|---|
| Filename | modeM0/AS1A05_199T01_9000002732_18452cztM0_level2.evt | modeM0/AS1A05_199T01_9000002732_18452cztM0_level2_quad_clean.evt |
| Size (bytes) | 534,346,560 | 105,684,480 |
| Size | 509.6 MB | 100.8 MB |
| Events in quadrant A | 3,431,830 | 684,380 |
| Events in quadrant B | 5,324,453 | 684,061 |
| Events in quadrant C | 3,486,416 | 684,713 |
| Events in quadrant D | 3,470,459 | 665,613 |
| Mode M0 | |||
|---|---|---|---|
| Quadrant | BADHDUFLAG | Total packets | Discarded packets |
| A | 0 | 14835 | 2 |
| B | 0 | 20325 | 2 |
| C | 0 | 14992 | 3 |
| D | 0 | 15089 | 2 |
| Mode SS | |||
|---|---|---|---|
| Quadrant | BADHDUFLAG | Total packets | Discarded packets |
| A | 0 | 144 | 0 |
| B | 0 | 144 | 0 |
| C | 0 | 144 | 0 |
| D | 0 | 144 | 0 |
| Mode M9 | |||
|---|---|---|---|
| Quadrant | BADHDUFLAG | Total packets | Discarded packets |
| A | 0 | 22 | 0 |
| B | 0 | 22 | 0 |
| C | 0 | 22 | 0 |
| D | 0 | 22 | 0 |
| Quadrant | Total seconds | Saturated seconds | Saturation percentage |
|---|---|---|---|
| A | 6913 | 71 | 1.027050% |
| B | 6913 | 659 | 9.532764% |
| C | 6912 | 116 | 1.678241% |
| D | 6912 | 44 | 0.636574% |
Noise dominated data is calculated using 1-second bins in cleaned event files. If a bin has >2000 counts, and if more than 50% of those come from <1% of pixels, then it is considered to be noise-dominated and hence unusable.
| Quadrant | # 1 sec bins | Bins with >0 counts | Bins with >2000 counts | High rate bins dominated by noise | Noise dominated (total time) | Noise dominated (detector-on time) | Marked lightcurve |
|---|---|---|---|---|---|---|---|
| A | 9143 | 6913 | 5 | 5 | 0.05% | 0.07% | 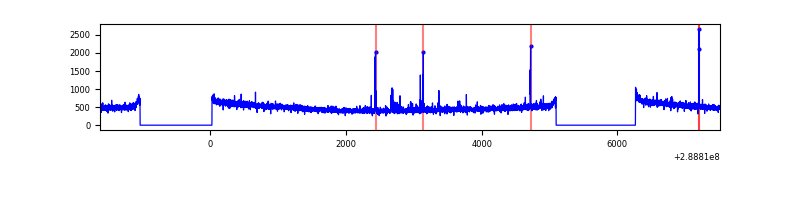 |
| B | 9142 | 6912 | 403 | 403 | 4.41% | 5.83% | 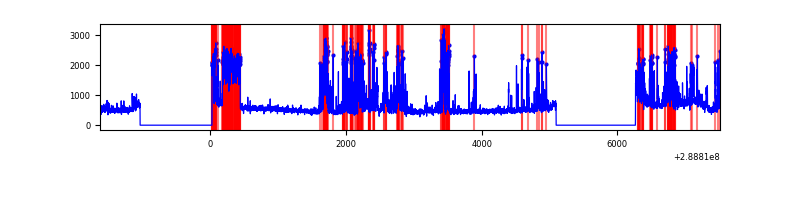 |
| C | 9142 | 6912 | 0 | 0 | 0.00% | 0.00% | 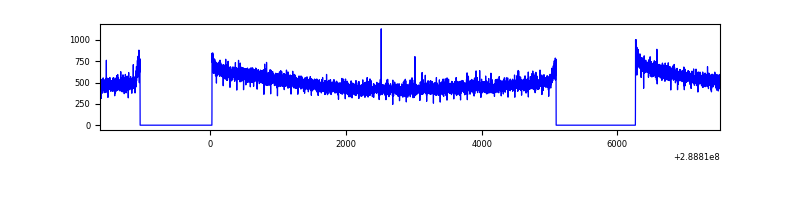 |
| D | 9142 | 6912 | 1 | 1 | 0.01% | 0.01% | 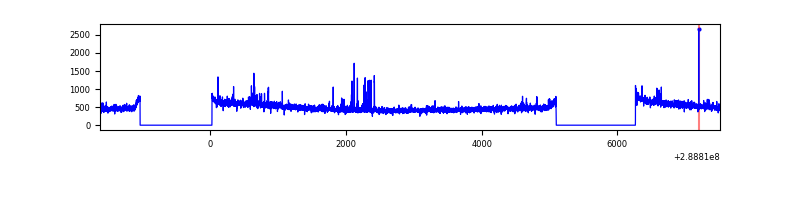 |
Top three noisy pixels from each quadrant. If the there are fewer than three noisy pixels in the level2.evt file, extra rows are filled as -1
| Pixel properties | Quadrant properties | ||||||
|---|---|---|---|---|---|---|---|
| Quadrant | DetID | PixID | Counts | Sigma | Mean | Median | Sigma |
| A | 4 | 2 | 55403 | 310.57 | 878 | 860 | 175.6 |
| A | 0 | 226 | 7528 | 37.97 | 878 | 860 | 175.6 |
| A | 3 | 137 | 6742 | 33.49 | 878 | 860 | 175.6 |
| B | 10 | 245 | 1938983 | 11969.58 | 857 | 837 | 161.9 |
| B | 0 | 244 | 26813 | 160.42 | 857 | 837 | 161.9 |
| B | 12 | 111 | 19420 | 114.76 | 857 | 837 | 161.9 |
| C | 14 | 238 | 133906 | 667.31 | 858 | 862 | 199.4 |
| C | 3 | 233 | 7635 | 33.97 | 858 | 862 | 199.4 |
| C | 13 | 61 | 5902 | 25.28 | 858 | 862 | 199.4 |
| D | 12 | 110 | 92246 | 431.9 | 865 | 839 | 211.6 |
| D | 13 | 168 | 78511 | 367.0 | 865 | 839 | 211.6 |
| D | 2 | 234 | 31331 | 144.08 | 865 | 839 | 211.6 |
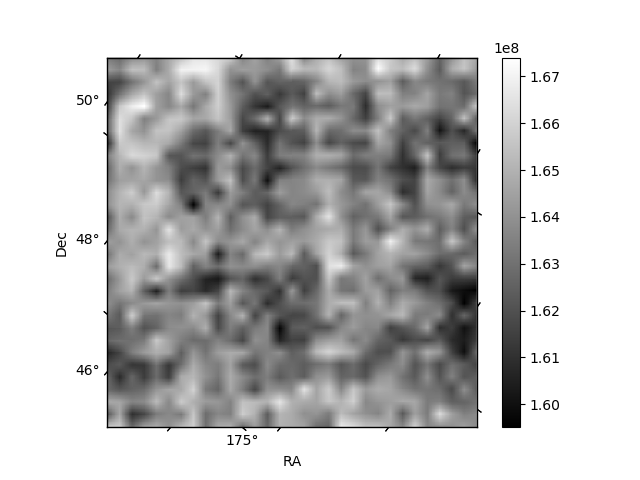
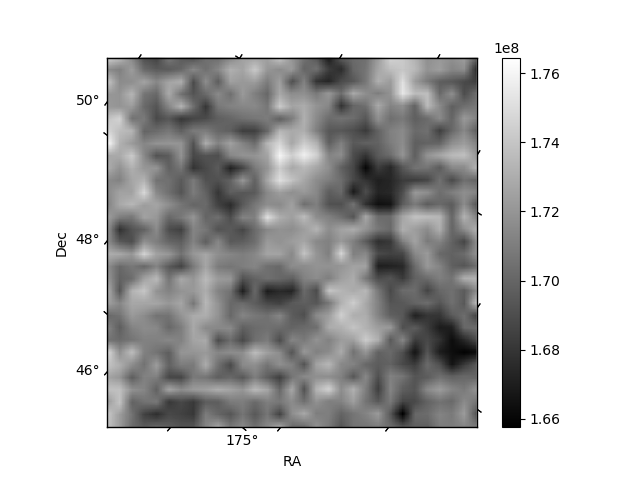
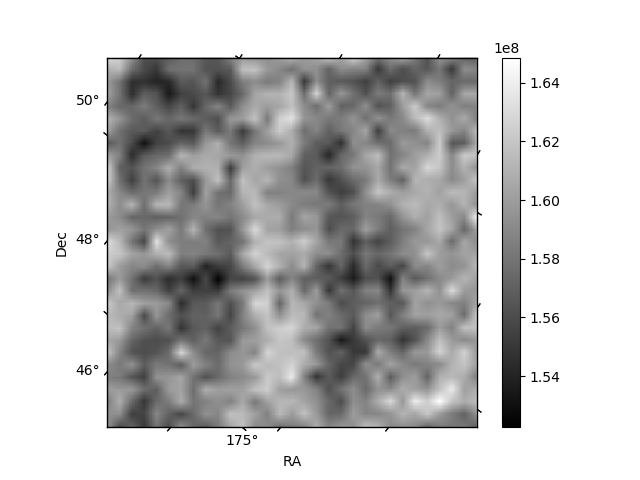
Histogram calculated using DETX and DETY for each event in the final _common_clean file
| Quadrant A | 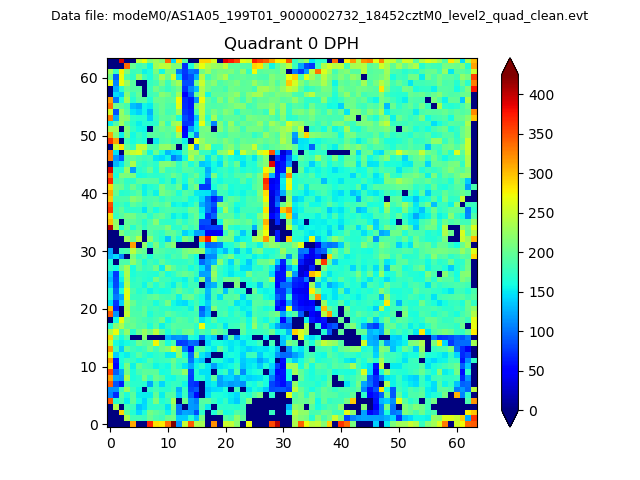 |
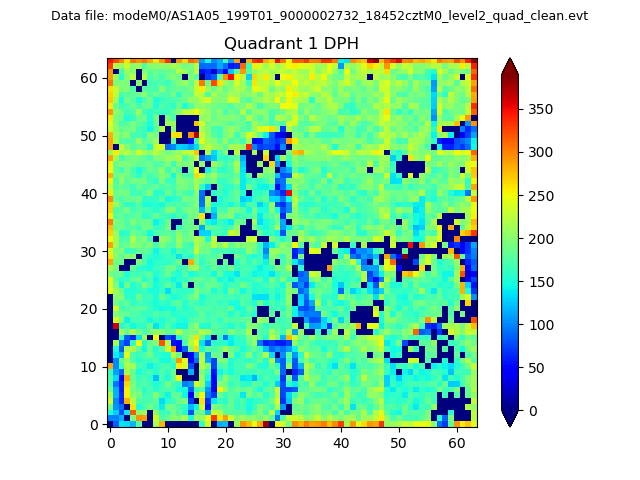 |
Quadrant B |
|---|---|---|---|
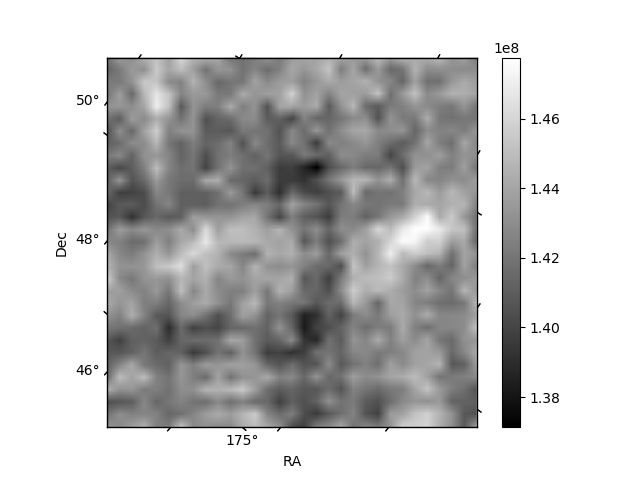
| Quadrant D | 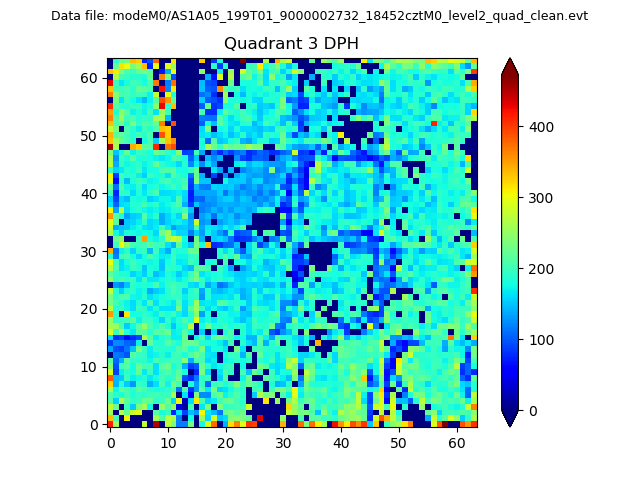 |
 |
Quadrant C |
| Plot type | Count rate plots | Images |
|---|---|---|
| Comparison with Poisson distribution Blue bars denote a histogram of data divided into 1 sec bins. Red curve is a Poisson curve with rate = median count rate of data. |
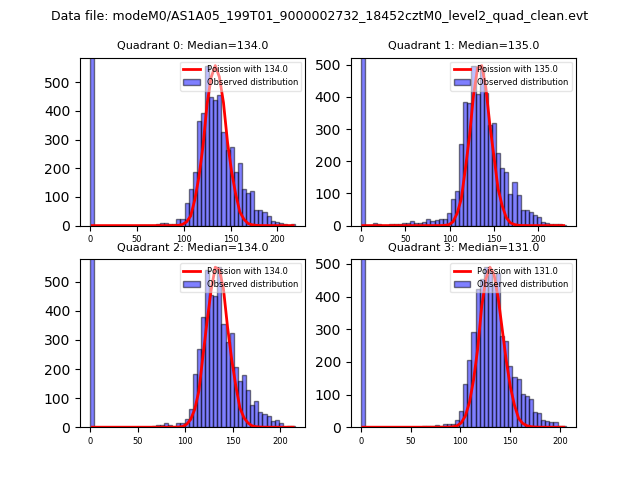 |
 |
| Quadrant-wise count rates Data is divided into 100 sec bins |
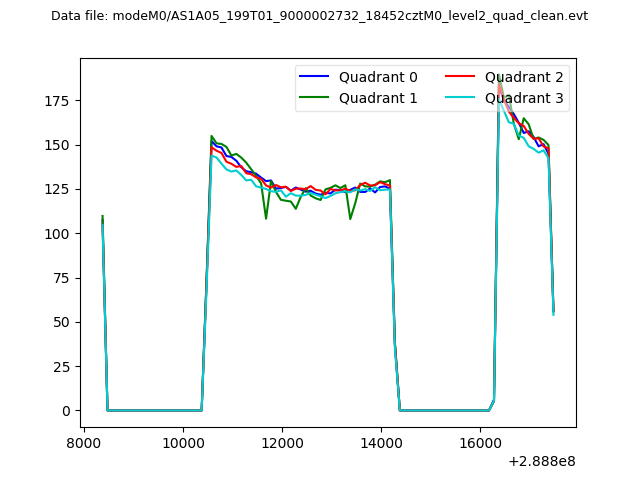 |
|
| Module-wise count rates for Quadrant A Data is divided into 100 sec bins |
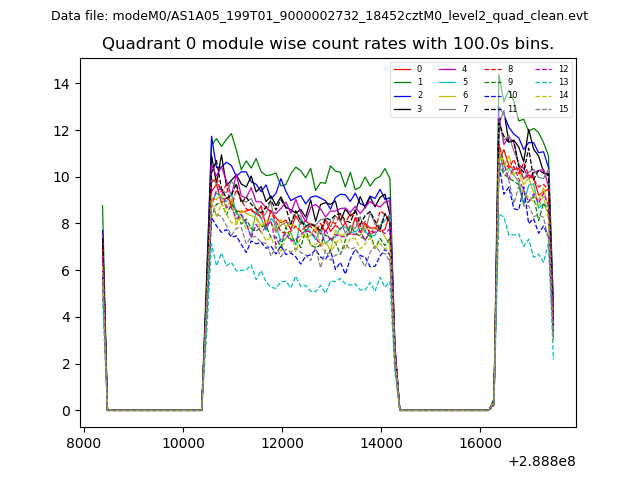 |
 |
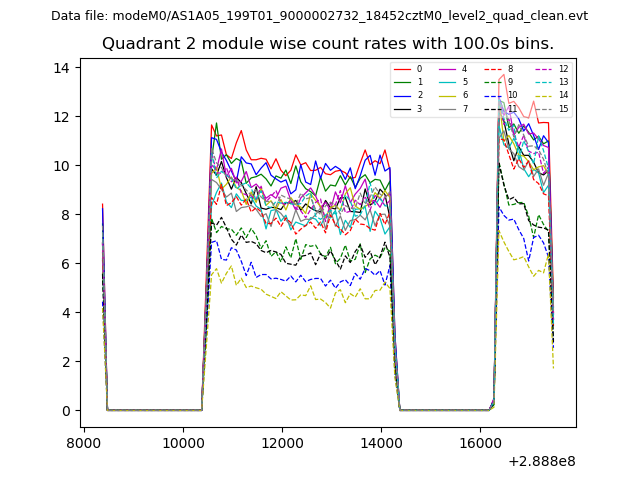
| Module-wise count rates for Quadrant B Data is divided into 100 sec bins |
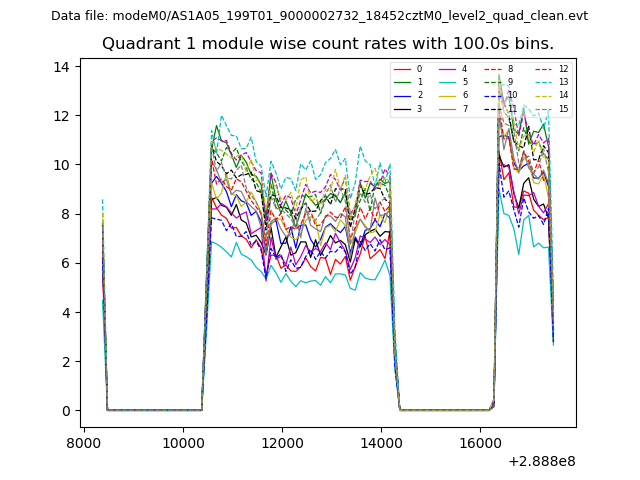 |
 |
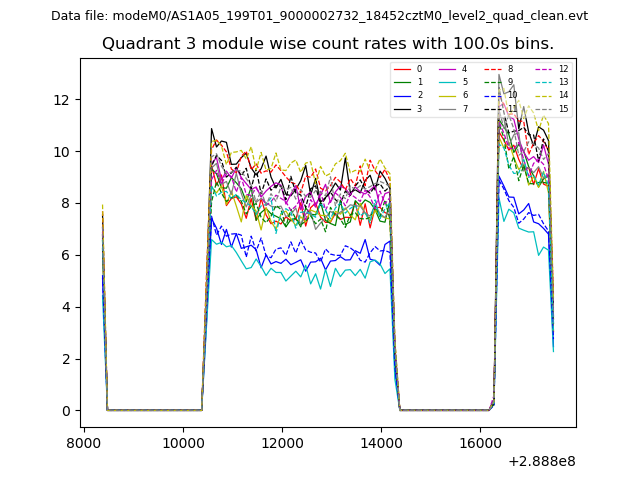
| Module-wise count rates for Quadrant C Data is divided into 100 sec bins |
 |
 |
| Module-wise count rates for Quadrant D Data is divided into 100 sec bins |
 |
 |
| Parameter | Plot |
|---|---|
| CZT HV Monitor | 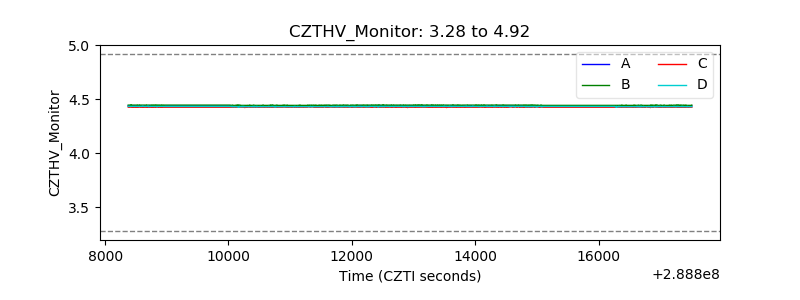 |
| D_VDD | 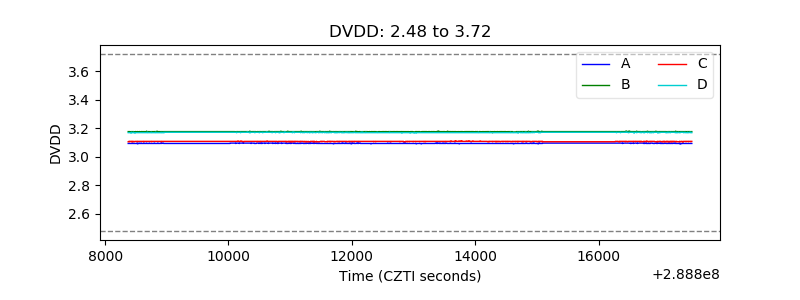 |
| Temperature 1 | 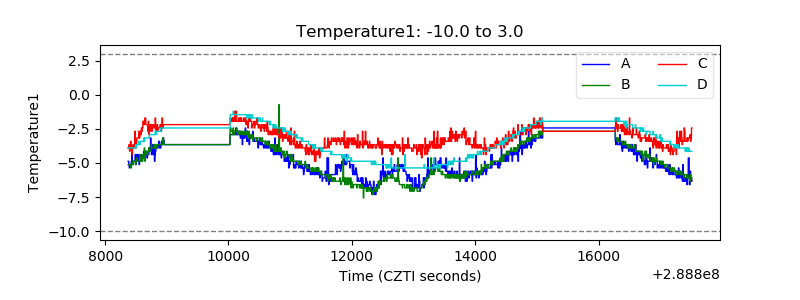 |
| Veto HV Monitor | 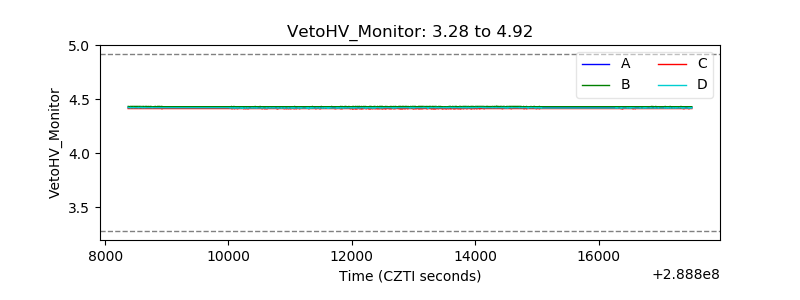 |
| Veto LLD | 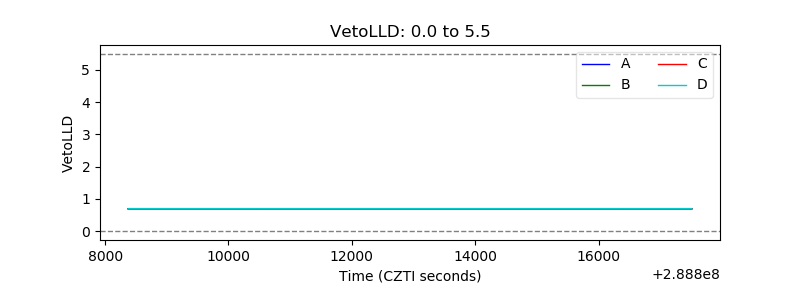 |
| Alpha Counter | 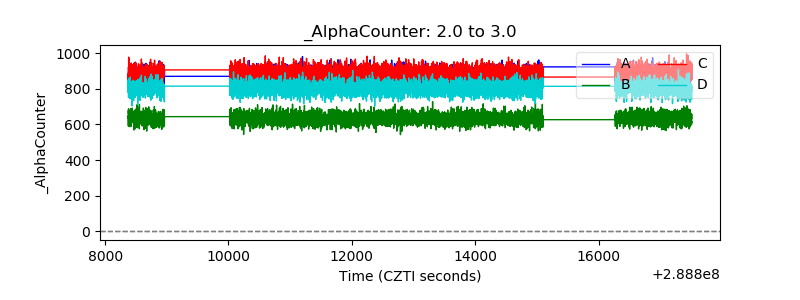 |
| _CPM_Rate | 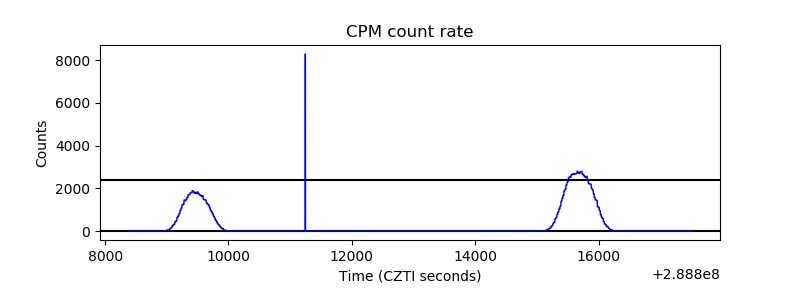 |
| CZT Counter |  |
| +2.5 Volts monitor | 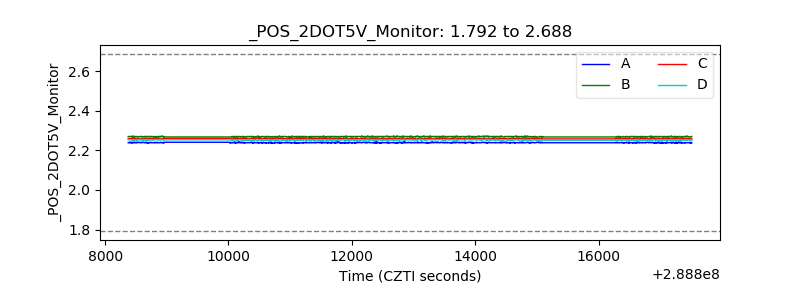 |
| +5 Volts monitor |  |
| _ROLL_ROT | 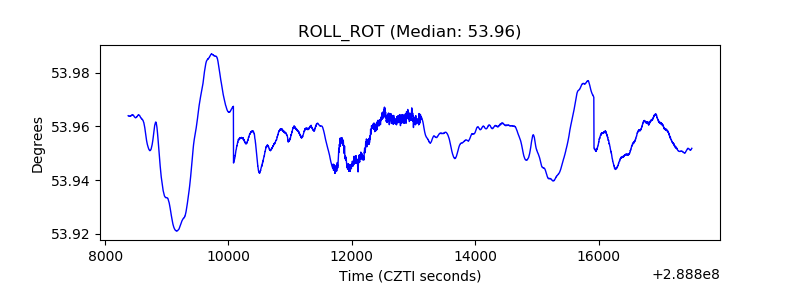 |
| _Roll_DEC | 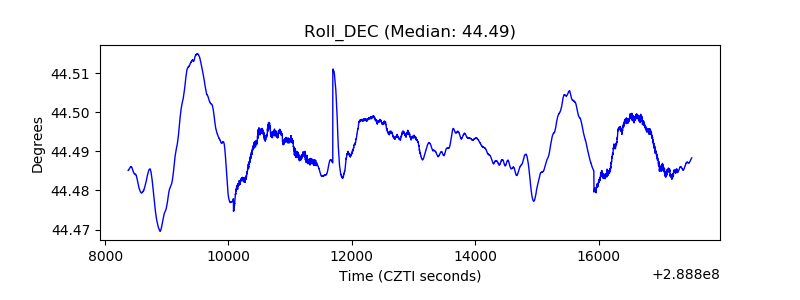 |
| _Roll_RA | 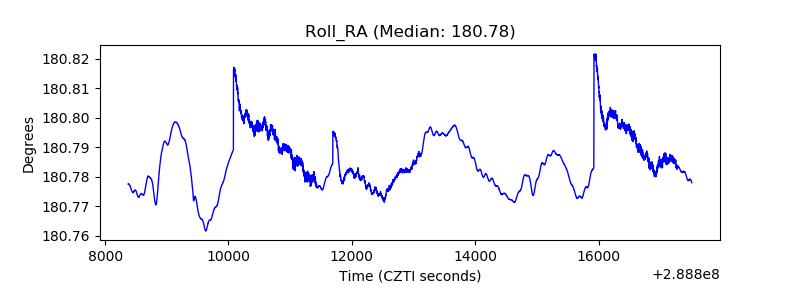 |
| Veto Counter | 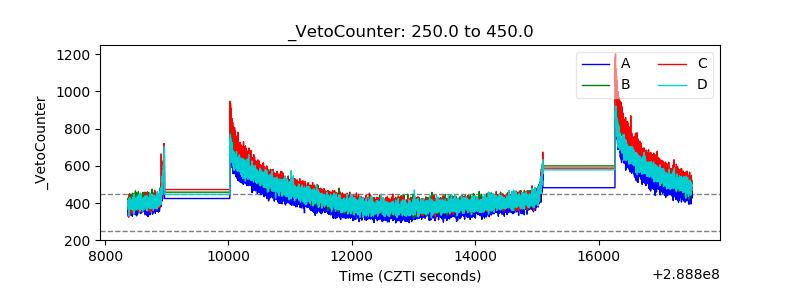 |