| Param | Original file | Final file |
|---|---|---|
| Filename | modeM0/AS1A05_199T01_9000002732_18453cztM0_level2.evt | modeM0/AS1A05_199T01_9000002732_18453cztM0_level2_quad_clean.evt |
| Size (bytes) | 480,479,040 | 111,110,400 |
| Size | 458.2 MB | 106.0 MB |
| Events in quadrant A | 3,128,599 | 732,335 |
| Events in quadrant B | 4,639,232 | 739,237 |
| Events in quadrant C | 3,219,762 | 742,541 |
| Events in quadrant D | 3,141,286 | 716,562 |
| Mode M0 | |||
|---|---|---|---|
| Quadrant | BADHDUFLAG | Total packets | Discarded packets |
| A | 0 | 13464 | 2 |
| B | 0 | 18041 | 2 |
| C | 0 | 13684 | 2 |
| D | 0 | 13500 | 2 |
| Mode SS | |||
|---|---|---|---|
| Quadrant | BADHDUFLAG | Total packets | Discarded packets |
| A | 0 | 126 | 0 |
| B | 0 | 126 | 0 |
| C | 0 | 126 | 0 |
| D | 0 | 126 | 0 |
| Mode M9 | |||
|---|---|---|---|
| Quadrant | BADHDUFLAG | Total packets | Discarded packets |
| A | 0 | 13 | 0 |
| B | 0 | 14 | 0 |
| C | 0 | 14 | 0 |
| D | 0 | 14 | 0 |
| Quadrant | Total seconds | Saturated seconds | Saturation percentage |
|---|---|---|---|
| A | 6227 | 45 | 0.722659% |
| B | 6227 | 355 | 5.700980% |
| C | 6227 | 83 | 1.332905% |
| D | 6226 | 27 | 0.433665% |
Noise dominated data is calculated using 1-second bins in cleaned event files. If a bin has >2000 counts, and if more than 50% of those come from <1% of pixels, then it is considered to be noise-dominated and hence unusable.
| Quadrant | # 1 sec bins | Bins with >0 counts | Bins with >2000 counts | High rate bins dominated by noise | Noise dominated (total time) | Noise dominated (detector-on time) | Marked lightcurve |
|---|---|---|---|---|---|---|---|
| A | 7517 | 6227 | 14 | 14 | 0.19% | 0.22% | 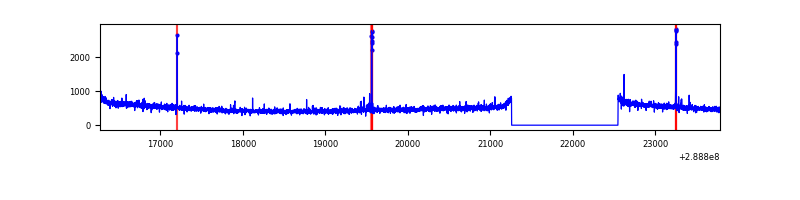 |
| B | 7517 | 6227 | 219 | 219 | 2.91% | 3.52% | 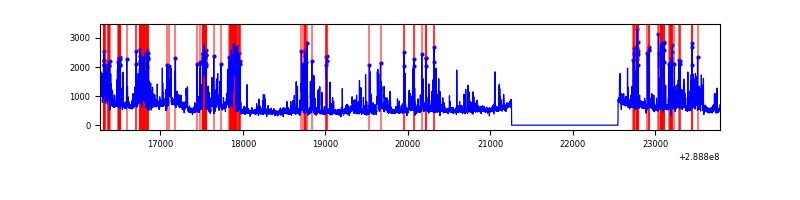 |
| C | 7517 | 6227 | 0 | 0 | 0.00% | 0.00% | 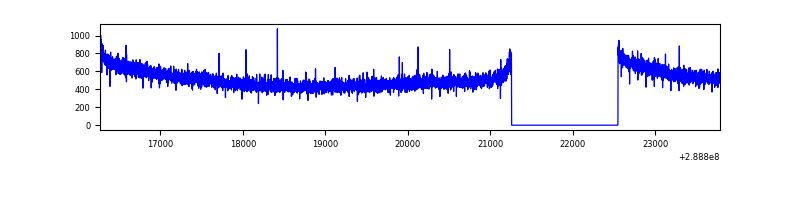 |
| D | 7516 | 6226 | 2 | 2 | 0.03% | 0.03% | 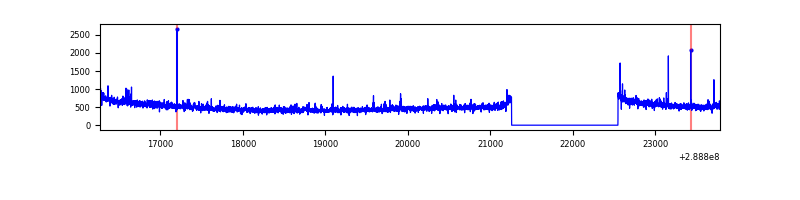 |
Top three noisy pixels from each quadrant. If the there are fewer than three noisy pixels in the level2.evt file, extra rows are filled as -1
| Pixel properties | Quadrant properties | ||||||
|---|---|---|---|---|---|---|---|
| Quadrant | DetID | PixID | Counts | Sigma | Mean | Median | Sigma |
| A | 4 | 2 | 59721 | 369.3 | 798 | 784 | 159.6 |
| A | 0 | 226 | 6881 | 38.2 | 798 | 784 | 159.6 |
| A | 3 | 137 | 6027 | 32.85 | 798 | 784 | 159.6 |
| B | 10 | 245 | 1469982 | 9903.06 | 795 | 776 | 148.4 |
| B | 0 | 244 | 28956 | 189.94 | 795 | 776 | 148.4 |
| B | 12 | 111 | 17027 | 109.54 | 795 | 776 | 148.4 |
| C | 14 | 238 | 124371 | 675.59 | 792 | 798 | 182.9 |
| C | 3 | 233 | 6164 | 29.34 | 792 | 798 | 182.9 |
| C | 13 | 61 | 5460 | 25.49 | 792 | 798 | 182.9 |
| D | 12 | 110 | 69458 | 356.55 | 793 | 771 | 192.6 |
| D | 13 | 168 | 37740 | 191.9 | 793 | 771 | 192.6 |
| D | 2 | 234 | 26920 | 135.74 | 793 | 771 | 192.6 |
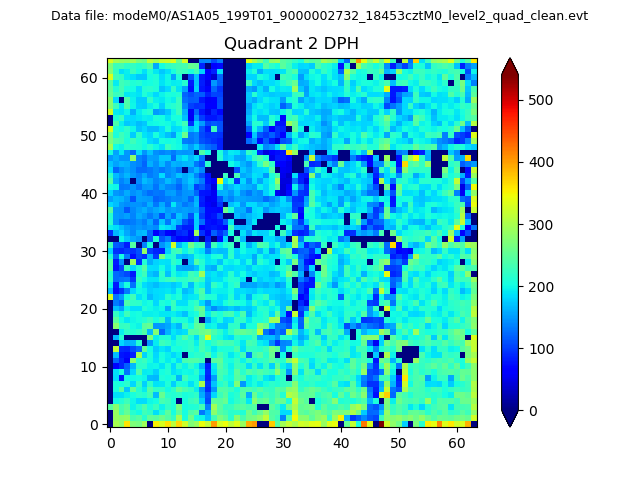
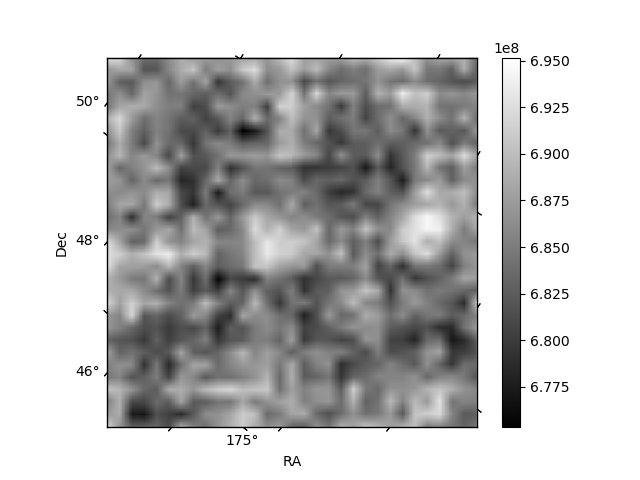
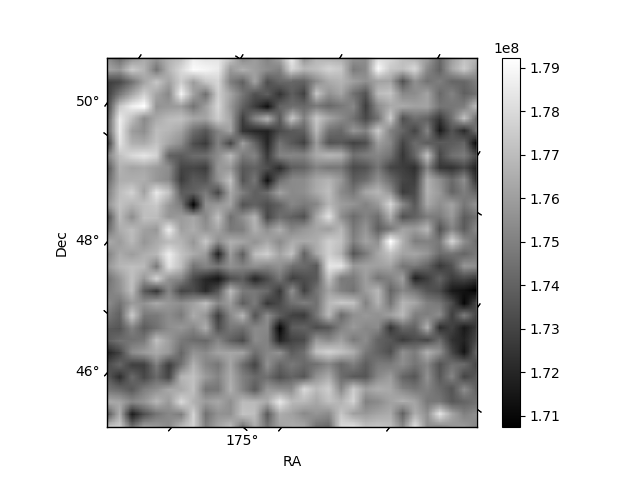
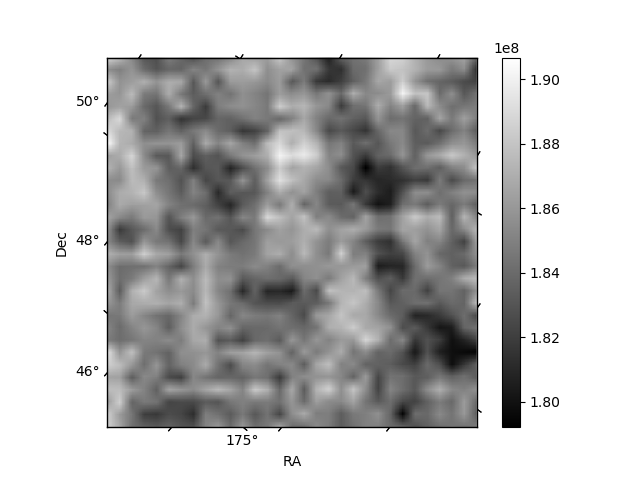
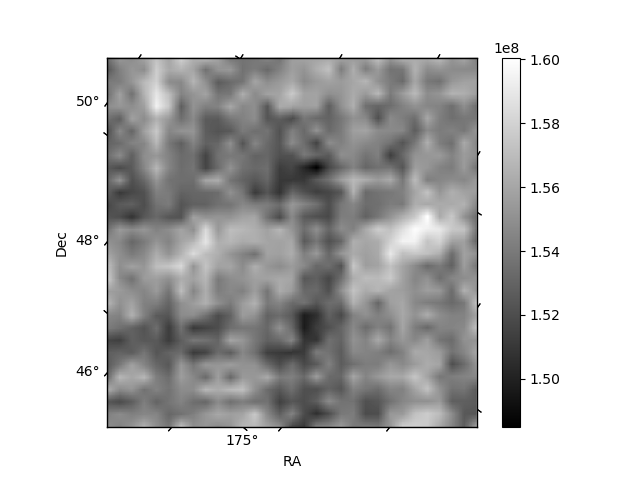
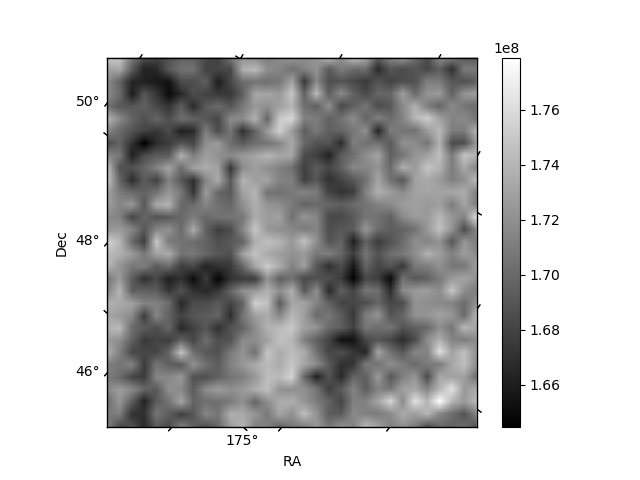
Histogram calculated using DETX and DETY for each event in the final _common_clean file
| Quadrant A | 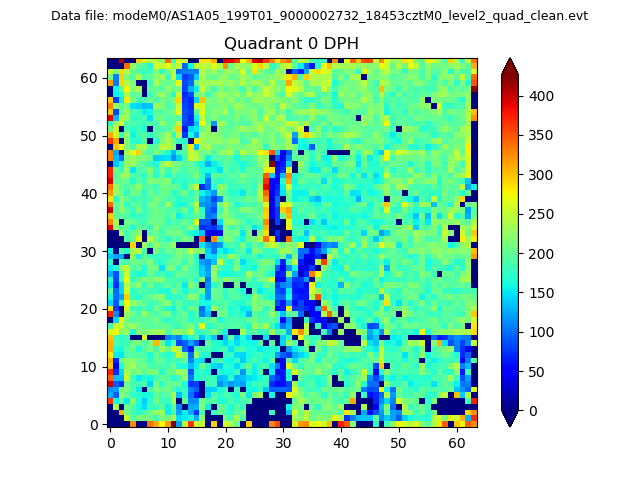 |
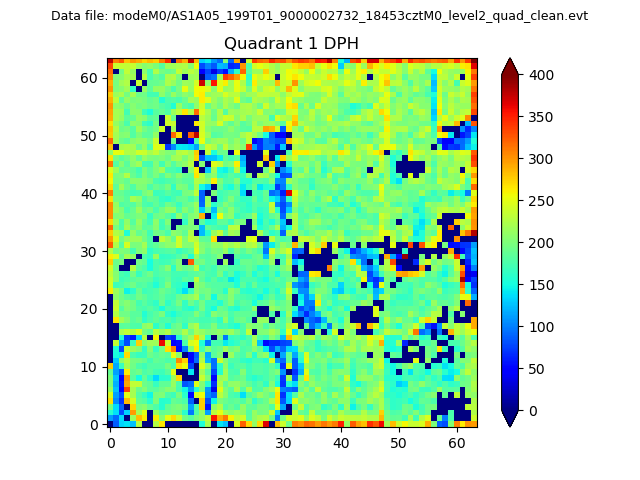 |
Quadrant B |
|---|---|---|---|
| Quadrant D | 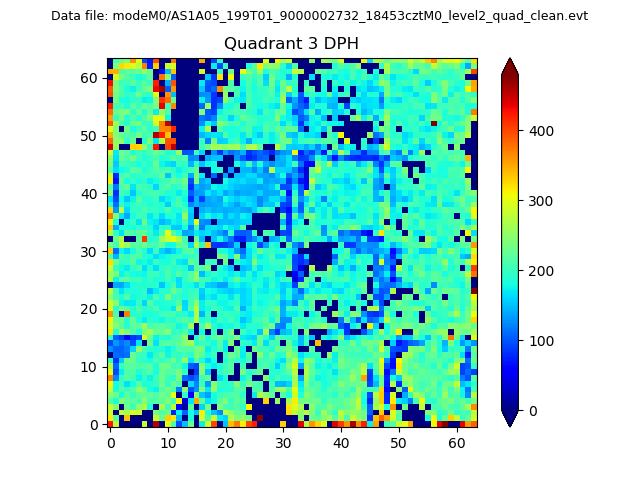 |
 |
Quadrant C |
| Plot type | Count rate plots | Images |
|---|---|---|
| Comparison with Poisson distribution Blue bars denote a histogram of data divided into 1 sec bins. Red curve is a Poisson curve with rate = median count rate of data. |
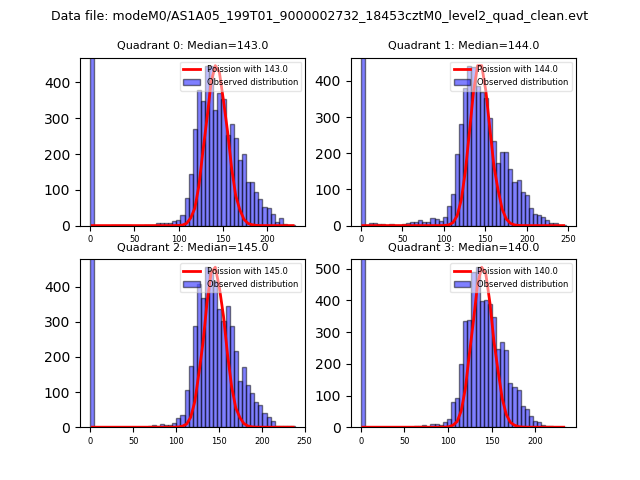 |
 |
| Quadrant-wise count rates Data is divided into 100 sec bins |
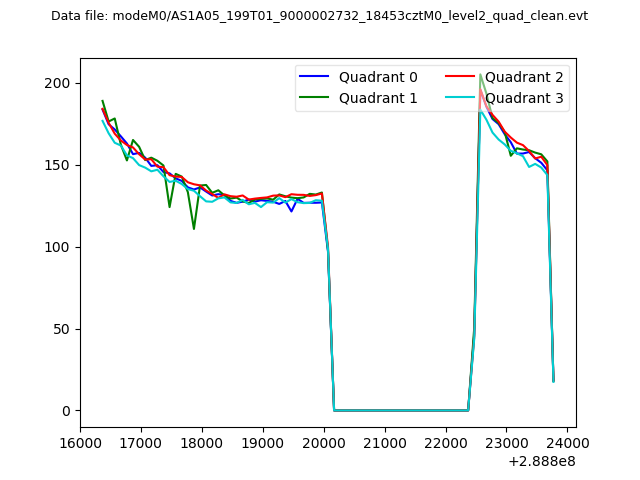 |
|
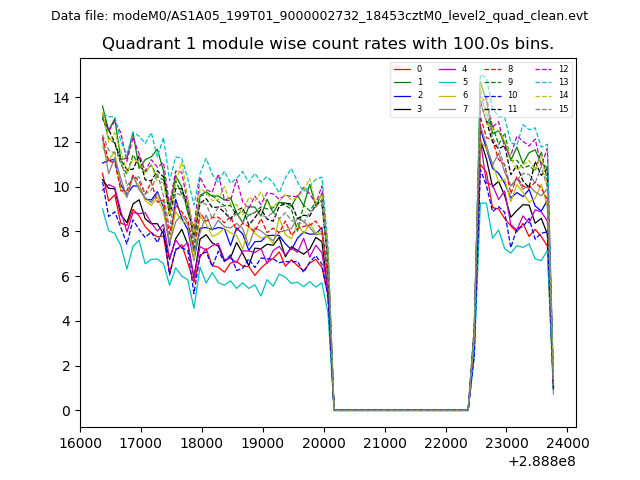
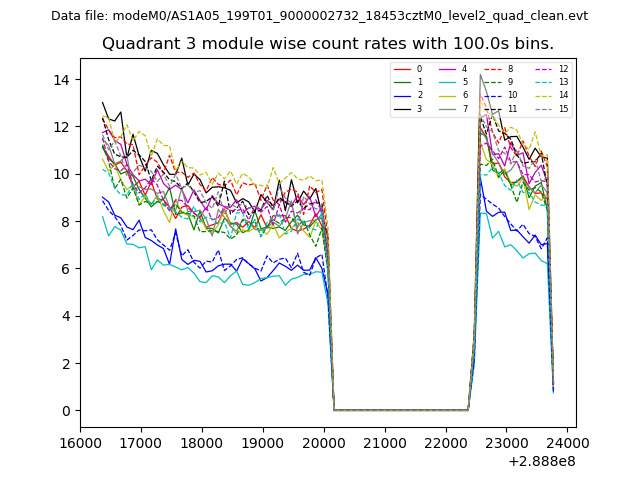
| Module-wise count rates for Quadrant A Data is divided into 100 sec bins |
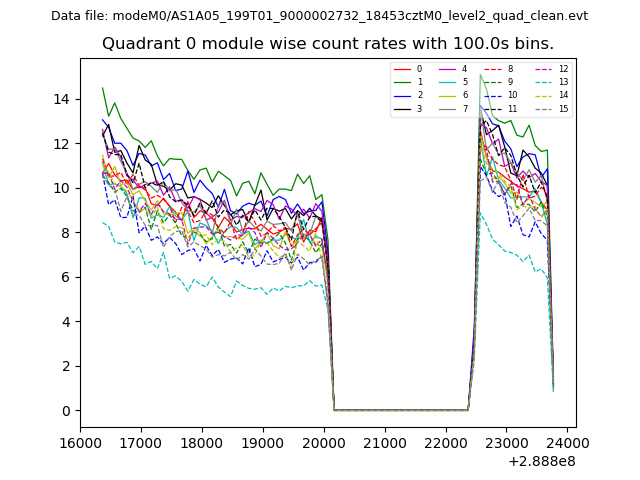 |
 |
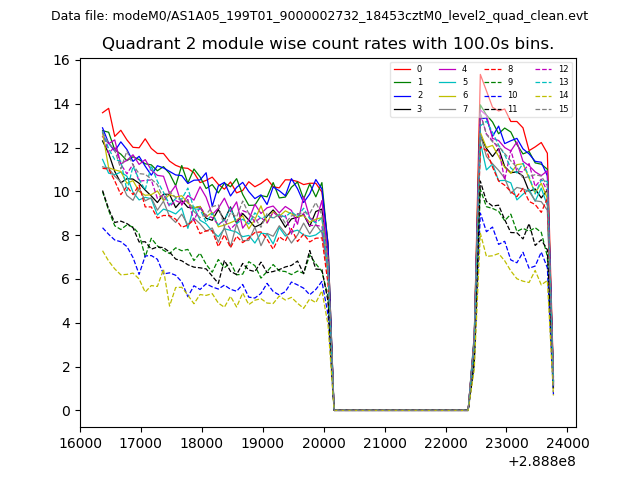
| Module-wise count rates for Quadrant B Data is divided into 100 sec bins |
 |
 |
| Module-wise count rates for Quadrant C Data is divided into 100 sec bins |
 |
 |
| Module-wise count rates for Quadrant D Data is divided into 100 sec bins |
 |
 |
| Parameter | Plot |
|---|---|
| CZT HV Monitor | 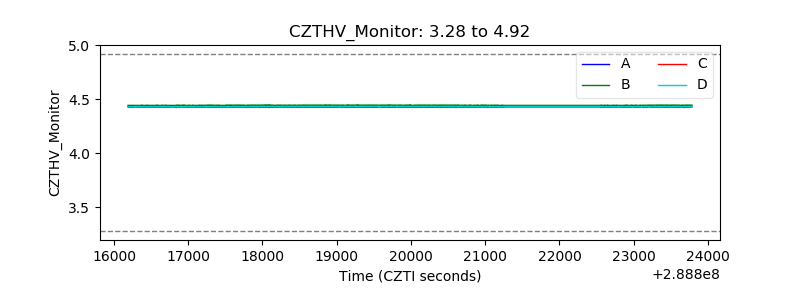 |
| D_VDD | 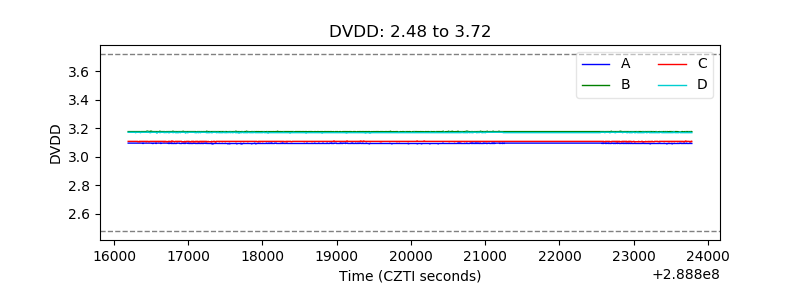 |
| Temperature 1 | 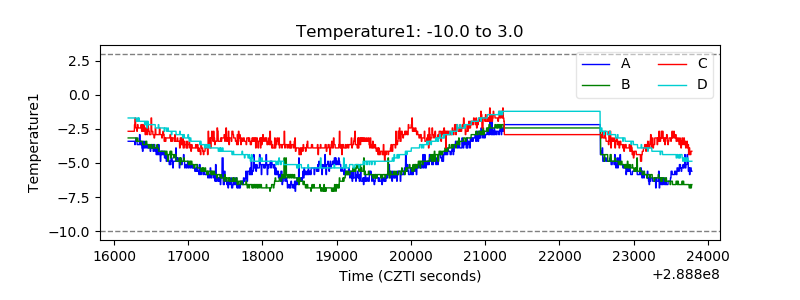 |
| Veto HV Monitor |  |
| Veto LLD | 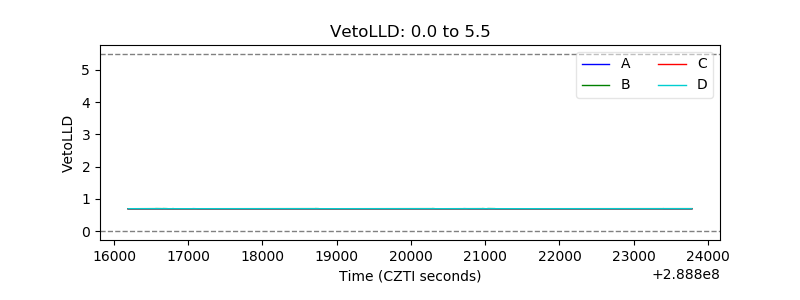 |
| Alpha Counter | 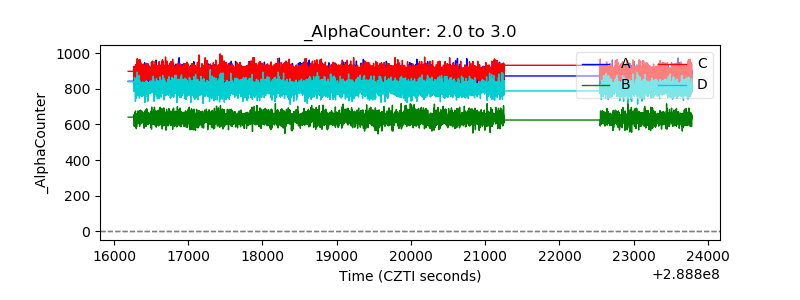 |
| _CPM_Rate | 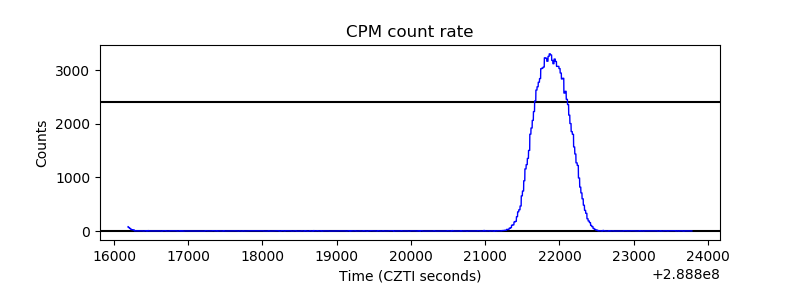 |
| CZT Counter | 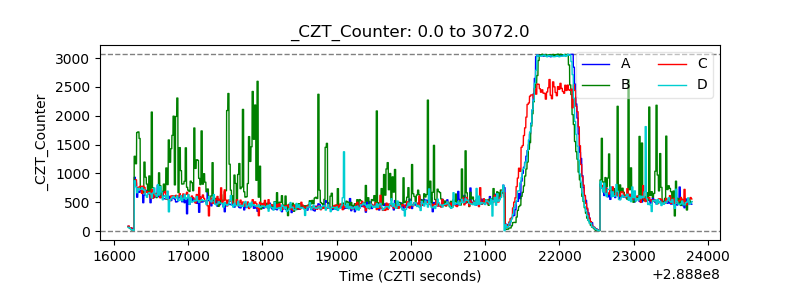 |
| +2.5 Volts monitor |  |
| +5 Volts monitor |  |
| _ROLL_ROT | 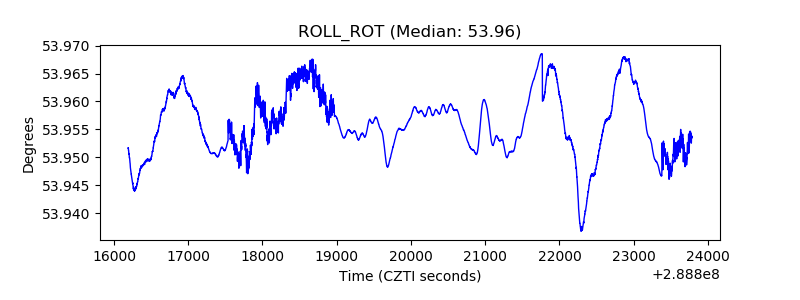 |
| _Roll_DEC | 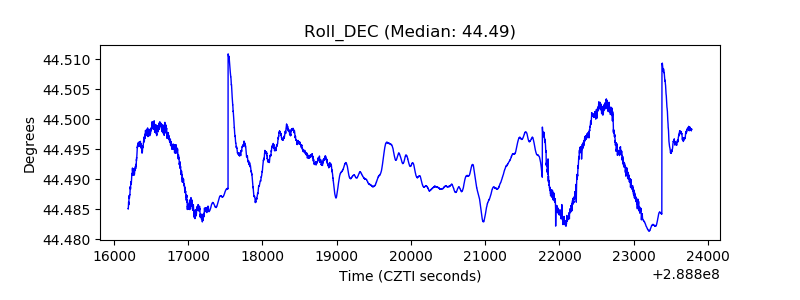 |
| _Roll_RA | 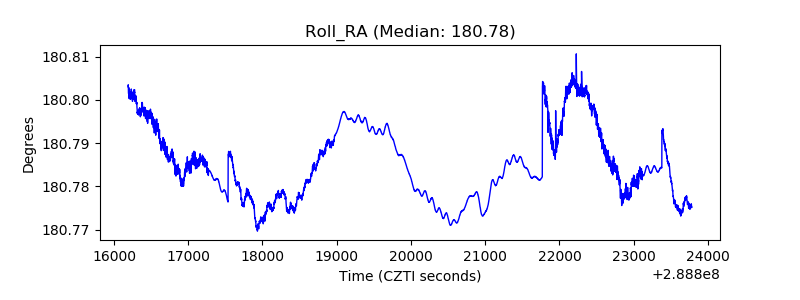 |
| Veto Counter | 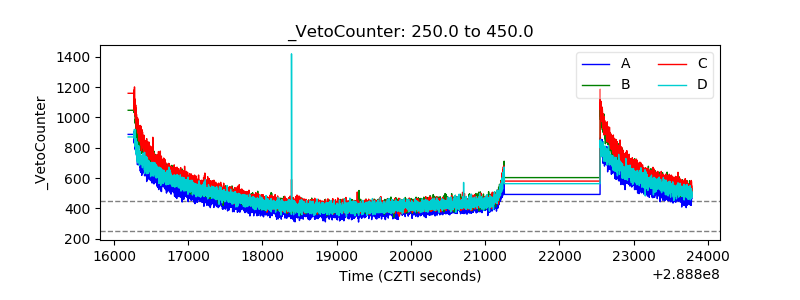 |