| Param | Original file | Final file |
|---|---|---|
| Filename | modeM0/AS1A05_199T01_9000002732_18456cztM0_level2.evt | modeM0/AS1A05_199T01_9000002732_18456cztM0_level2_quad_clean.evt |
| Size (bytes) | 183,116,160 | 55,252,800 |
| Size | 174.6 MB | 52.7 MB |
| Events in quadrant A | 1,301,172 | 369,336 |
| Events in quadrant B | 1,296,656 | 384,368 |
| Events in quadrant C | 1,527,117 | 368,853 |
| Events in quadrant D | 1,234,692 | 357,036 |
| Mode M0 | |||
|---|---|---|---|
| Quadrant | BADHDUFLAG | Total packets | Discarded packets |
| A | 0 | 5686 | 1 |
| B | 0 | 5650 | 1 |
| C | 0 | 6269 | 1 |
| D | 0 | 5571 | 1 |
| Mode SS | |||
|---|---|---|---|
| Quadrant | BADHDUFLAG | Total packets | Discarded packets |
| A | 0 | 54 | 0 |
| B | 0 | 54 | 0 |
| C | 0 | 54 | 0 |
| D | 0 | 54 | 0 |
| Mode M9 | |||
|---|---|---|---|
| Quadrant | BADHDUFLAG | Total packets | Discarded packets |
| A | 0 | 10 | 0 |
| B | 0 | 11 | 0 |
| C | 0 | 11 | 0 |
| D | 0 | 11 | 0 |
| Quadrant | Total seconds | Saturated seconds | Saturation percentage |
|---|---|---|---|
| A | 2702 | 4 | 0.148038% |
| B | 2702 | 5 | 0.185048% |
| C | 2702 | 30 | 1.110289% |
| D | 2702 | 5 | 0.185048% |
Noise dominated data is calculated using 1-second bins in cleaned event files. If a bin has >2000 counts, and if more than 50% of those come from <1% of pixels, then it is considered to be noise-dominated and hence unusable.
| Quadrant | # 1 sec bins | Bins with >0 counts | Bins with >2000 counts | High rate bins dominated by noise | Noise dominated (total time) | Noise dominated (detector-on time) | Marked lightcurve |
|---|---|---|---|---|---|---|---|
| A | 2702 | 2702 | 1 | 1 | 0.04% | 0.04% | 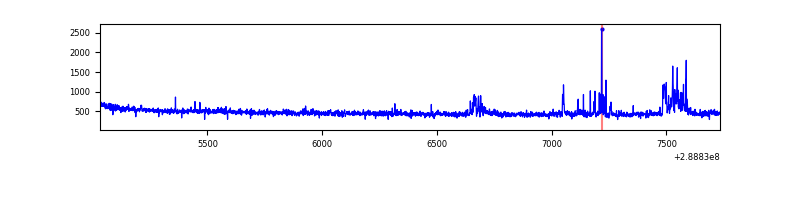 |
| B | 2702 | 2702 | 1 | 1 | 0.04% | 0.04% | 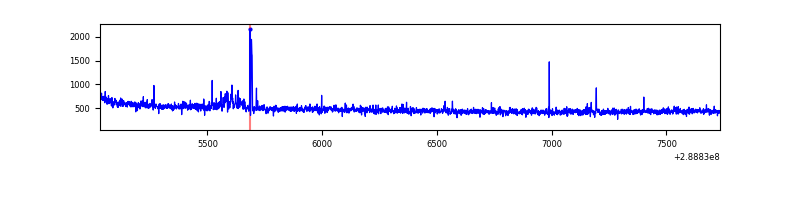 |
| C | 2702 | 2702 | 12 | 12 | 0.44% | 0.44% | 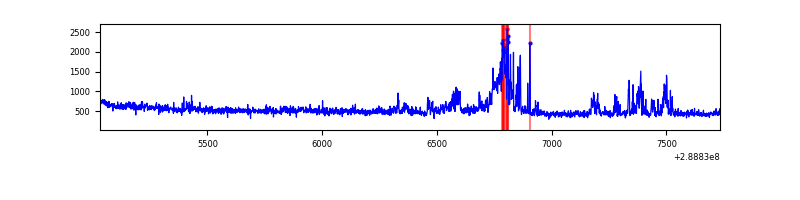 |
| D | 2702 | 2702 | 4 | 4 | 0.15% | 0.15% | 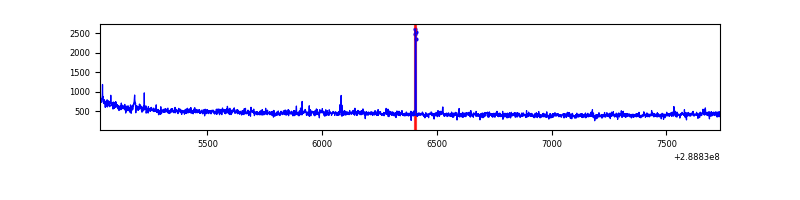 |
Top three noisy pixels from each quadrant. If the there are fewer than three noisy pixels in the level2.evt file, extra rows are filled as -1
| Pixel properties | Quadrant properties | ||||||
|---|---|---|---|---|---|---|---|
| Quadrant | DetID | PixID | Counts | Sigma | Mean | Median | Sigma |
| A | 14 | 238 | 73271 | 1126.9 | 316 | 310 | 64.7 |
| A | 4 | 2 | 10531 | 157.87 | 316 | 310 | 64.7 |
| A | 0 | 226 | 2659 | 36.28 | 316 | 310 | 64.7 |
| B | 10 | 245 | 39435 | 630.65 | 323 | 315 | 62.0 |
| B | 12 | 111 | 6956 | 107.06 | 323 | 315 | 62.0 |
| B | 11 | 111 | 5877 | 89.66 | 323 | 315 | 62.0 |
| C | 9 | 54 | 204374 | 2768.88 | 312 | 314 | 73.7 |
| C | 3 | 233 | 56789 | 766.31 | 312 | 314 | 73.7 |
| C | 14 | 238 | 50072 | 675.16 | 312 | 314 | 73.7 |
| D | 12 | 110 | 46588 | 619.63 | 307 | 299 | 74.7 |
| D | 2 | 234 | 9789 | 127.03 | 307 | 299 | 74.7 |
| D | 2 | 120 | 9085 | 117.61 | 307 | 299 | 74.7 |
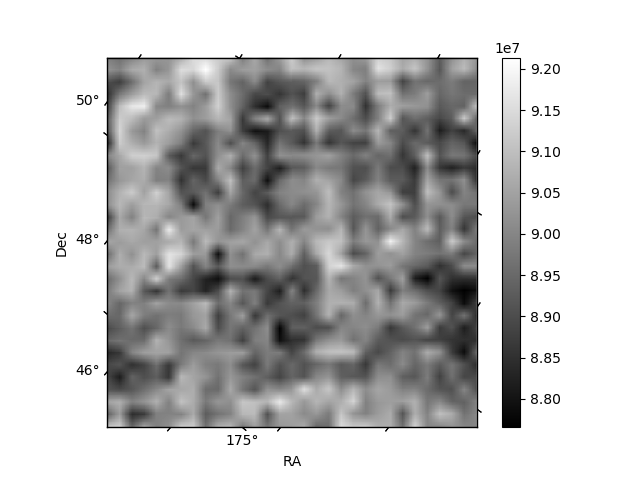
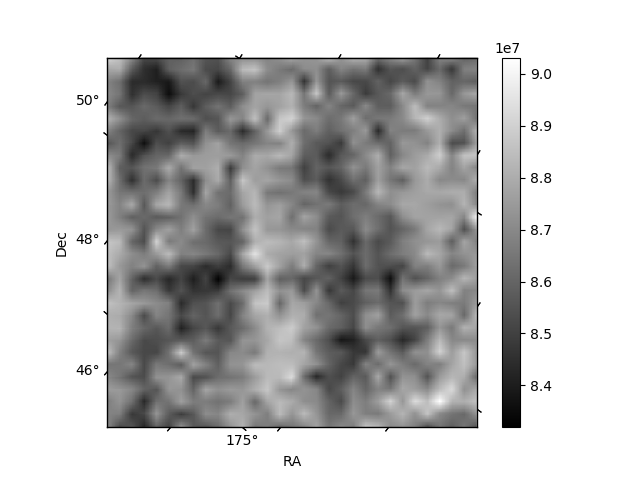
Histogram calculated using DETX and DETY for each event in the final _common_clean file
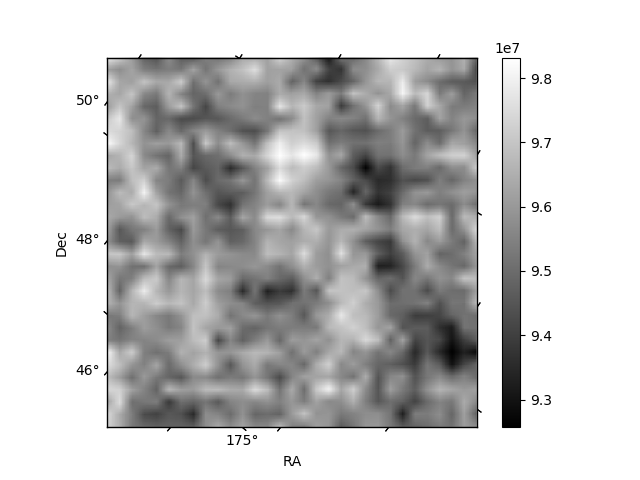
| Quadrant A | 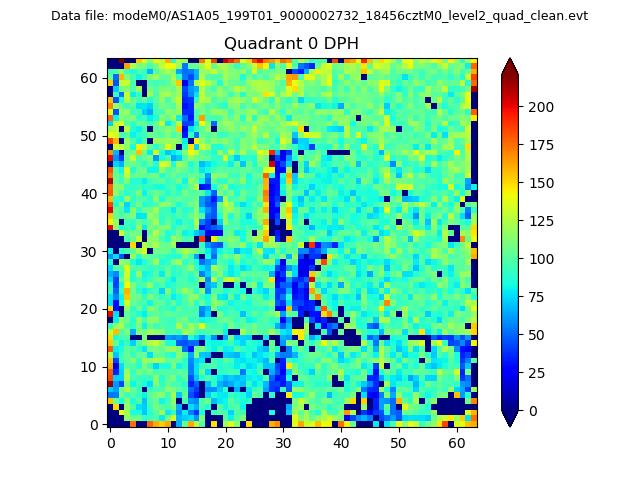 |
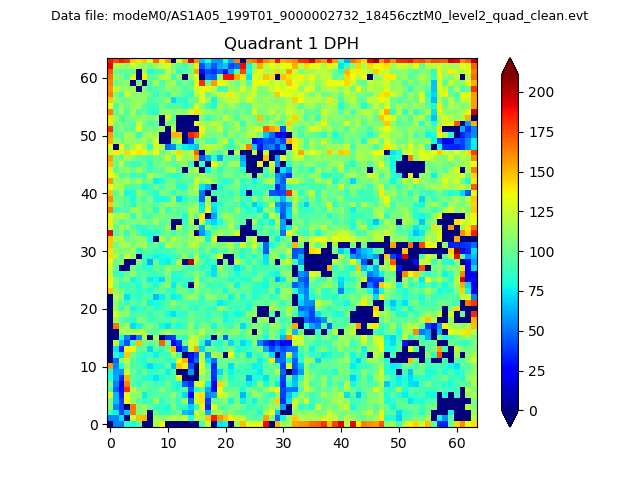 |
Quadrant B |
|---|---|---|---|
| Quadrant D | 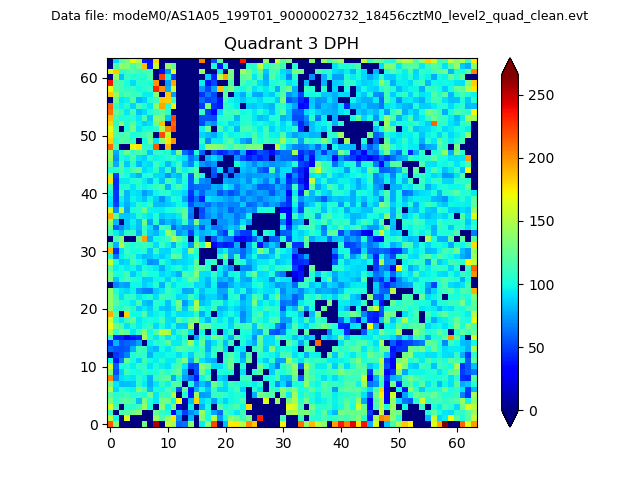 |
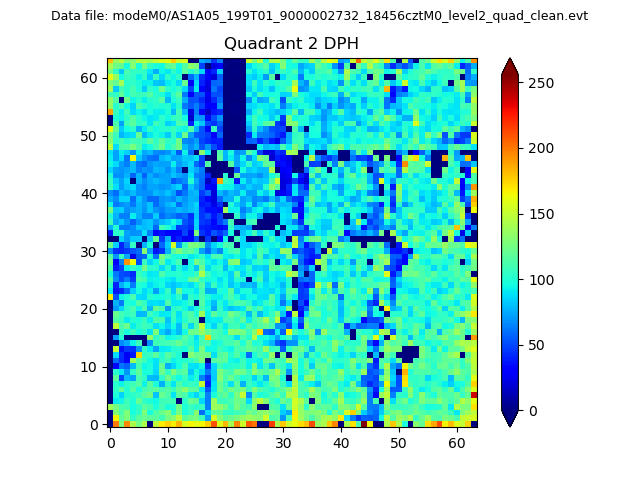 |
Quadrant C |
| Plot type | Count rate plots | Images |
|---|---|---|
| Comparison with Poisson distribution Blue bars denote a histogram of data divided into 1 sec bins. Red curve is a Poisson curve with rate = median count rate of data. |
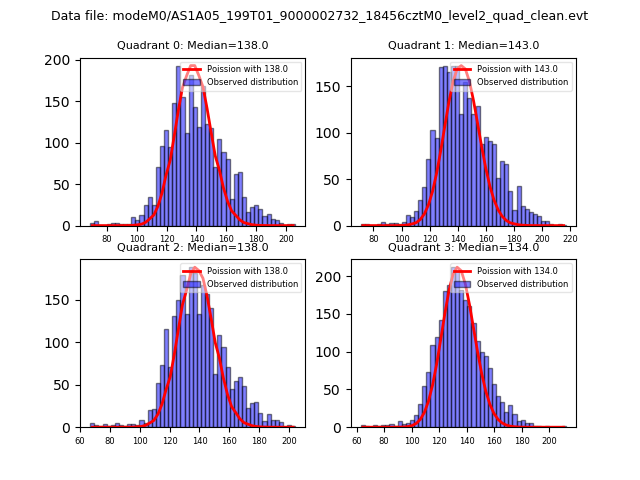 |
 |
| Quadrant-wise count rates Data is divided into 100 sec bins |
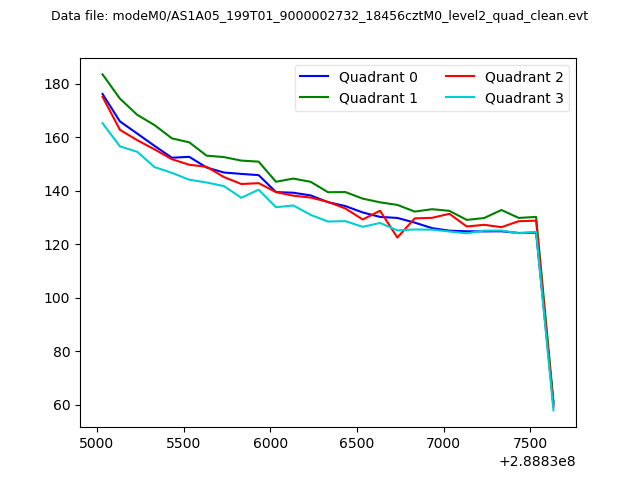 |
|
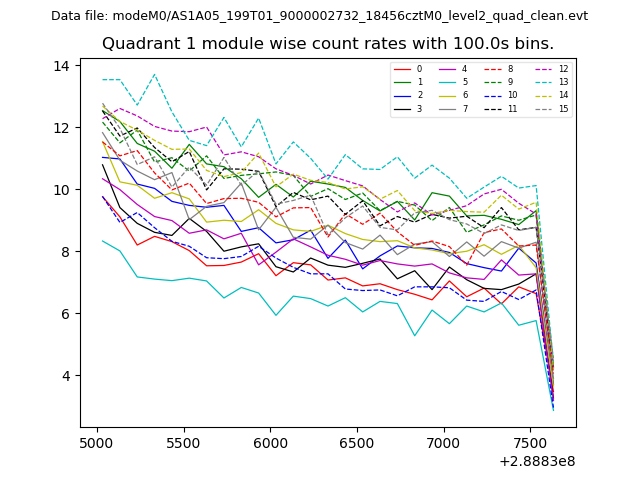
| Module-wise count rates for Quadrant A Data is divided into 100 sec bins |
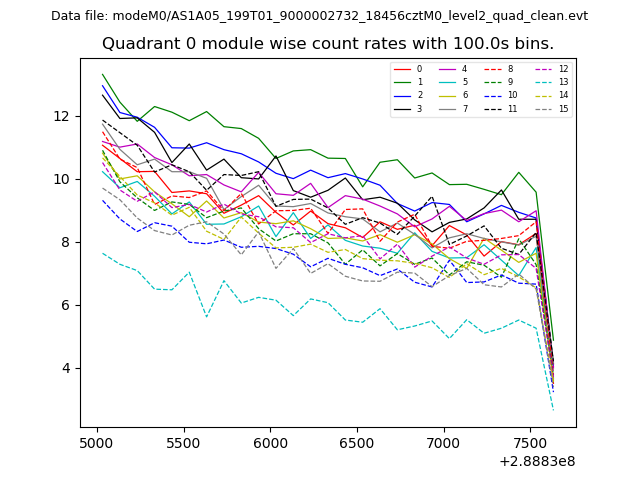 |
 |
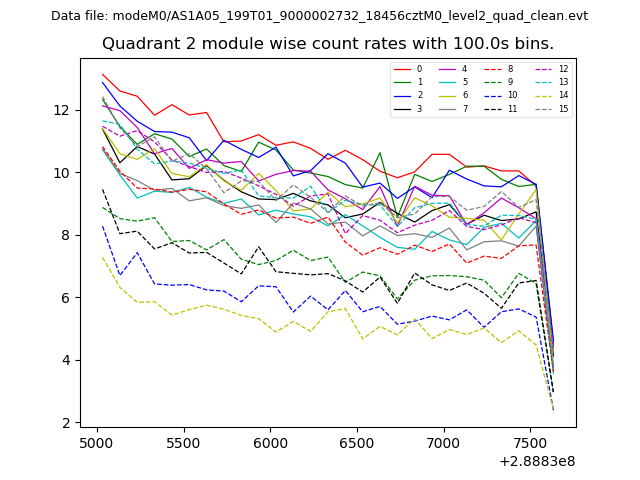
| Module-wise count rates for Quadrant B Data is divided into 100 sec bins |
 |
 |
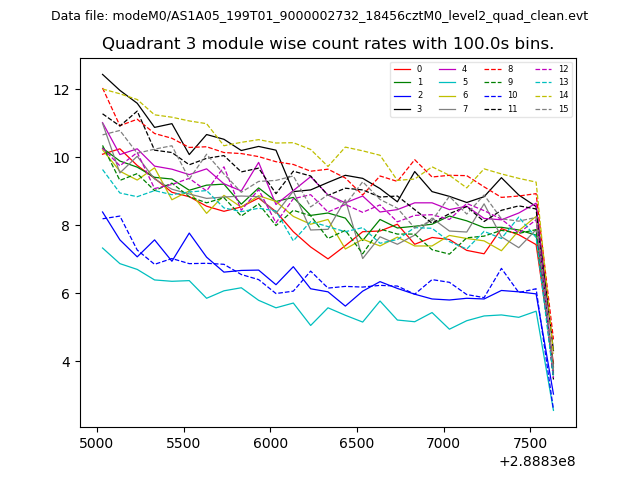
| Module-wise count rates for Quadrant C Data is divided into 100 sec bins |
 |
 |
| Module-wise count rates for Quadrant D Data is divided into 100 sec bins |
 |
 |
| Parameter | Plot |
|---|---|
| CZT HV Monitor | 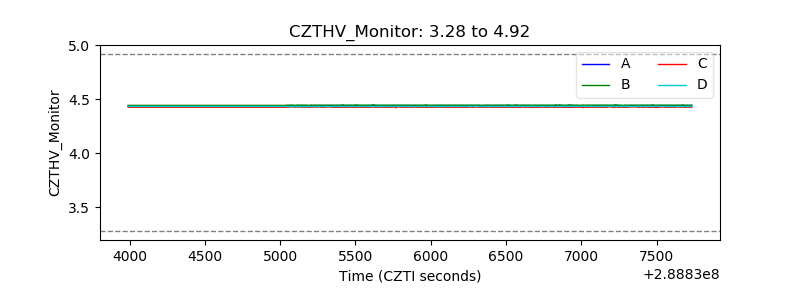 |
| D_VDD | 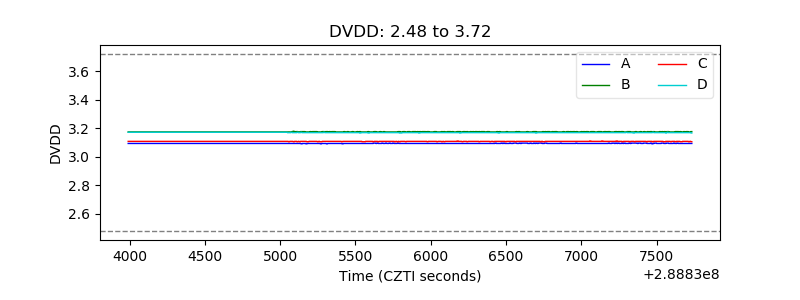 |
| Temperature 1 | 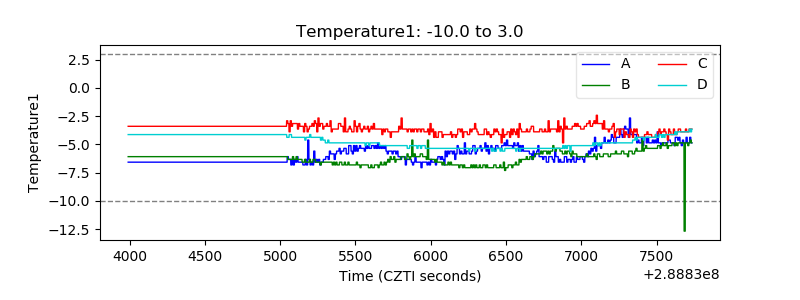 |
| Veto HV Monitor | 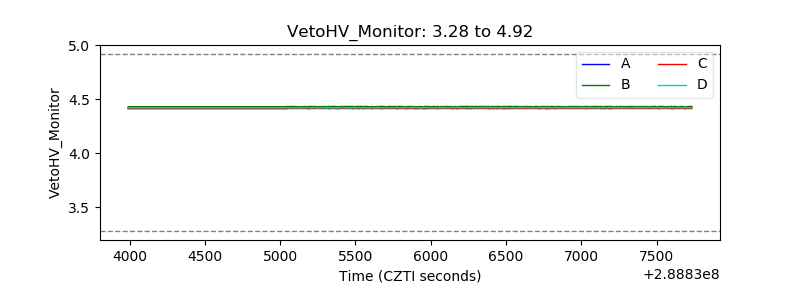 |
| Veto LLD | 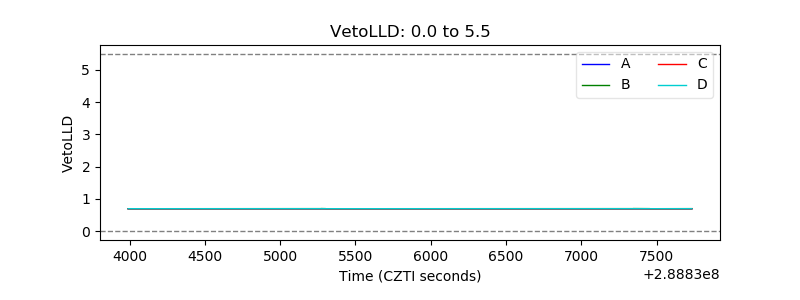 |
| Alpha Counter |  |
| _CPM_Rate | 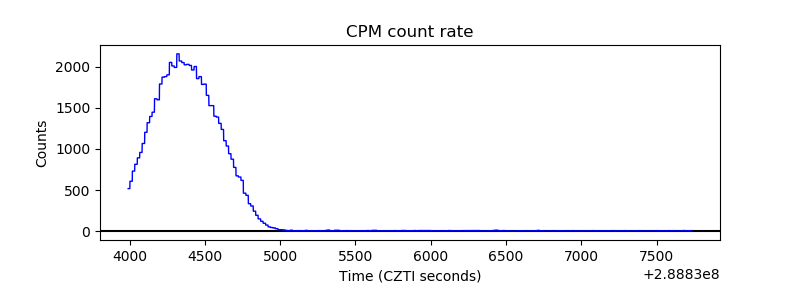 |
| CZT Counter | 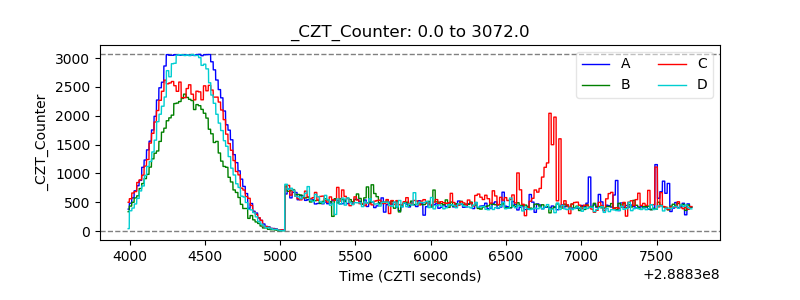 |
| +2.5 Volts monitor |  |
| +5 Volts monitor |  |
| _ROLL_ROT | 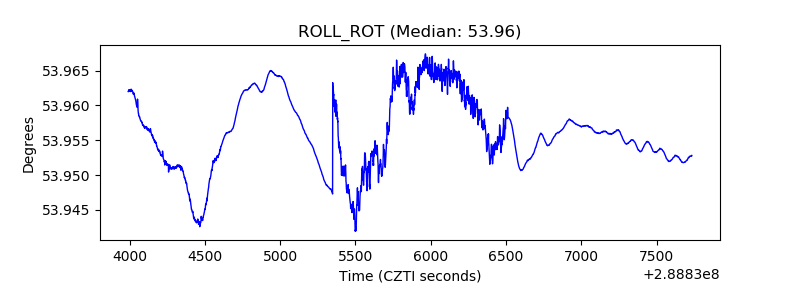 |
| _Roll_DEC | 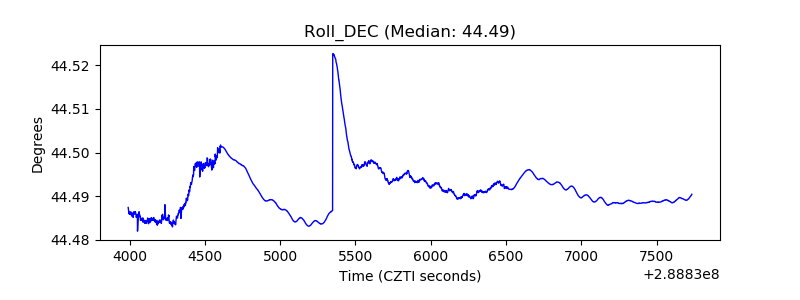 |
| _Roll_RA |  |
| Veto Counter | 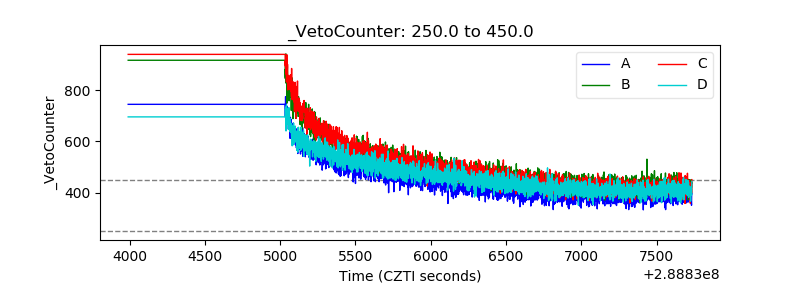 |