| Param | Original file | Final file |
|---|---|---|
| Filename | modeM0/AS1A05_072T02_9000002736cztM0_level2.fits | modeM0/AS1A05_072T02_9000002736cztM0_level2_quad_clean.evt |
| Size (bytes) | 584,533,440 | 504,702,720 |
| Size | 557.5 MB | 481.3 MB |
| Events in quadrant A | 3,571,594 | 2,881,134 |
| Events in quadrant B | 3,443,198 | 2,940,830 |
| Events in quadrant C | 3,542,570 | 2,826,627 |
| Events in quadrant D | 3,074,874 | 2,566,070 |
| Mode M0 | |||
|---|---|---|---|
| Quadrant | BADHDUFLAG | Total packets | Discarded packets |
| A | 0 | 133805 | 0 |
| B | 0 | 135148 | 0 |
| C | 0 | 132622 | 0 |
| D | 0 | 137695 | 0 |
| Mode M9 | |||
|---|---|---|---|
| Quadrant | BADHDUFLAG | Total packets | Discarded packets |
| A | 0 | 99 | 0 |
| B | 0 | 99 | 0 |
| C | 0 | 99 | 0 |
| D | 0 | 99 | 0 |
| Mode SS | |||
|---|---|---|---|
| Quadrant | BADHDUFLAG | Total packets | Discarded packets |
| A | 0 | 1208 | 0 |
| B | 0 | 1208 | 0 |
| C | 0 | 1208 | 0 |
| D | 0 | 1208 | 0 |
| Quadrant | Total seconds | Saturated seconds | Saturation percentage |
|---|---|---|---|
| A | 59329 | 1402 | 2.363094% |
| B | 59329 | 1811 | 3.052470% |
| C | 59329 | 1182 | 1.992280% |
| D | 59329 | 1384 | 2.332755% |
Noise dominated data is calculated using 1-second bins in cleaned event files. If a bin has >2000 counts, and if more than 50% of those come from <1% of pixels, then it is considered to be noise-dominated and hence unusable.
| Quadrant | # 1 sec bins | Bins with >0 counts | Bins with >2000 counts | High rate bins dominated by noise | Noise dominated (total time) | Noise dominated (detector-on time) | Marked lightcurve |
|---|---|---|---|---|---|---|---|
| A | 69234 | 59301 | 0 | 0 | 0.00% | 0.00% |  |
| B | 69235 | 59313 | 0 | 0 | 0.00% | 0.00% |  |
| C | 69235 | 59322 | 0 | 0 | 0.00% | 0.00% |  |
| D | 69235 | 59295 | 0 | 0 | 0.00% | 0.00% |  |
Top three noisy pixels from each quadrant. If the there are fewer than three noisy pixels in the level2.evt file, extra rows are filled as -1
| Pixel properties | Quadrant properties | ||||||
|---|---|---|---|---|---|---|---|
| Quadrant | DetID | PixID | Counts | Sigma | Mean | Median | Sigma |
| A | 0 | 29 | 2945 | 8.9 | 930 | 869 | 233.2 |
| A | 7 | 110 | 2905 | 8.73 | 930 | 869 | 233.2 |
| A | 9 | 19 | 2623 | 7.52 | 930 | 869 | 233.2 |
| B | 2 | 9 | 2874 | 11.2 | 910 | 867 | 179.3 |
| B | 2 | 8 | 2365 | 8.36 | 910 | 867 | 179.3 |
| B | 5 | 225 | 2300 | 7.99 | 910 | 867 | 179.3 |
| C | 1 | 80 | 2804 | 8.03 | 934 | 872 | 240.7 |
| C | 1 | 81 | 2725 | 7.7 | 934 | 872 | 240.7 |
| C | 3 | 126 | 2480 | 6.68 | 934 | 872 | 240.7 |
| D | 10 | 190 | 2299 | 6.5 | 876 | 798 | 230.7 |
| D | 3 | 14 | 2195 | 6.05 | 876 | 798 | 230.7 |
| D | 6 | 231 | 2191 | 6.04 | 876 | 798 | 230.7 |
Histogram calculated using DETX and DETY for each event in the final _common_clean file
| Quadrant A | 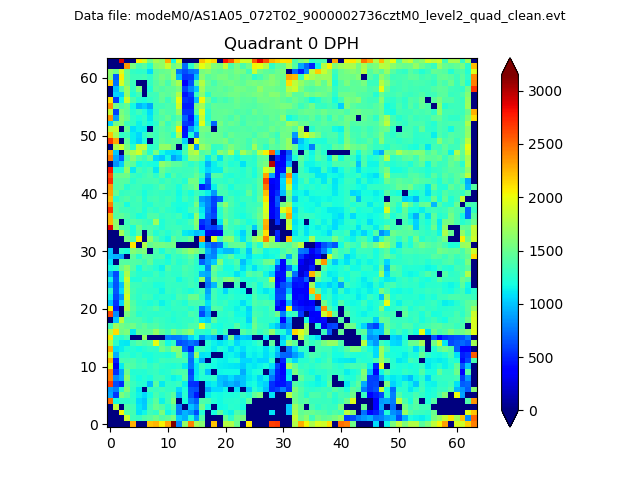 |
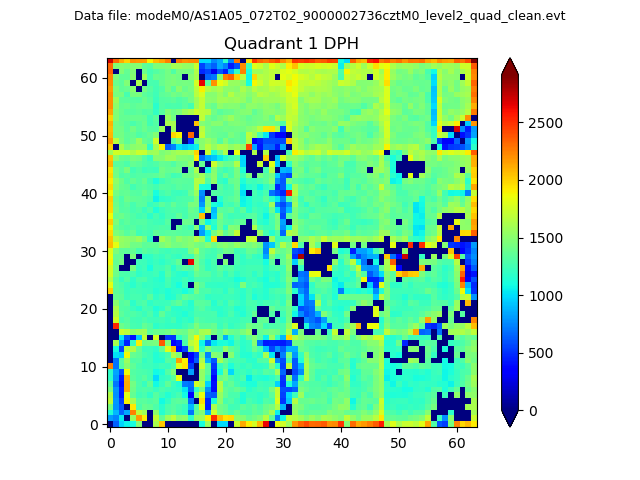 |
Quadrant B |
|---|---|---|---|
| Quadrant D |  |
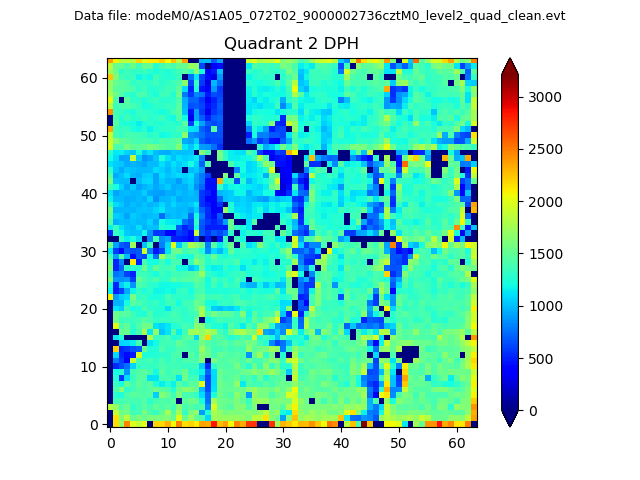 |
Quadrant C |
| Plot type | Count rate plots | Images |
|---|---|---|
| Comparison with Poisson distribution Blue bars denote a histogram of data divided into 1 sec bins. Red curve is a Poisson curve with rate = median count rate of data. |
 |
 |
| Quadrant-wise count rates Data is divided into 100 sec bins |
 |
|
| Module-wise count rates for Quadrant A Data is divided into 100 sec bins |
 |
 |
| Module-wise count rates for Quadrant B Data is divided into 100 sec bins |
 |
 |
| Module-wise count rates for Quadrant C Data is divided into 100 sec bins |
 |
 |
| Module-wise count rates for Quadrant D Data is divided into 100 sec bins |
 |
 |
| Parameter | Plot |
|---|---|
| CZT HV Monitor |  |
| D_VDD |  |
| Temperature 1 |  |
| Veto HV Monitor |  |
| Veto LLD |  |
| Alpha Counter |  |
| _CPM_Rate |  |
| CZT Counter |  |
| +2.5 Volts monitor |  |
| +5 Volts monitor |  |
| _ROLL_ROT |  |
| _Roll_DEC |  |
| _Roll_RA |  |
| Veto Counter |  |