| Param | Original file | Final file |
|---|---|---|
| Filename | modeM0/AS1A05_072T02_9000002736_18466cztM0_level2.evt | modeM0/AS1A05_072T02_9000002736_18466cztM0_level2_quad_clean.evt |
| Size (bytes) | 496,327,680 | 85,034,880 |
| Size | 473.3 MB | 81.1 MB |
| Events in quadrant A | 3,514,173 | 531,652 |
| Events in quadrant B | 3,446,028 | 543,021 |
| Events in quadrant C | 3,349,499 | 529,584 |
| Events in quadrant D | 4,274,351 | 511,213 |
| Mode M0 | |||
|---|---|---|---|
| Quadrant | BADHDUFLAG | Total packets | Discarded packets |
| A | 0 | 14897 | 2 |
| B | 0 | 14599 | 2 |
| C | 0 | 14250 | 2 |
| D | 0 | 17427 | 2 |
| Mode M9 | |||
|---|---|---|---|
| Quadrant | BADHDUFLAG | Total packets | Discarded packets |
| A | 0 | 21 | 0 |
| B | 0 | 21 | 0 |
| C | 0 | 21 | 0 |
| D | 0 | 21 | 0 |
| Mode SS | |||
|---|---|---|---|
| Quadrant | BADHDUFLAG | Total packets | Discarded packets |
| A | 0 | 136 | 0 |
| B | 0 | 136 | 0 |
| C | 0 | 136 | 0 |
| D | 0 | 136 | 0 |
| Quadrant | Total seconds | Saturated seconds | Saturation percentage |
|---|---|---|---|
| A | 6589 | 95 | 1.441797% |
| B | 6590 | 90 | 1.365706% |
| C | 6590 | 117 | 1.775417% |
| D | 6590 | 204 | 3.095599% |
Noise dominated data is calculated using 1-second bins in cleaned event files. If a bin has >2000 counts, and if more than 50% of those come from <1% of pixels, then it is considered to be noise-dominated and hence unusable.
| Quadrant | # 1 sec bins | Bins with >0 counts | Bins with >2000 counts | High rate bins dominated by noise | Noise dominated (total time) | Noise dominated (detector-on time) | Marked lightcurve |
|---|---|---|---|---|---|---|---|
| A | 8689 | 6589 | 17 | 17 | 0.20% | 0.26% | 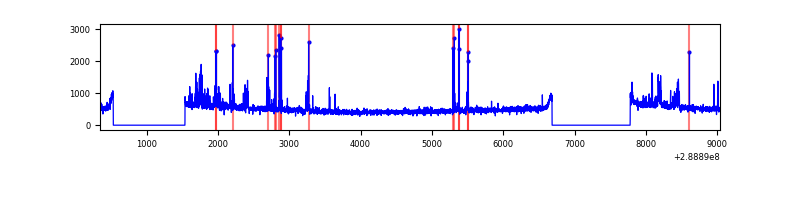 |
| B | 8690 | 6590 | 4 | 4 | 0.05% | 0.06% | 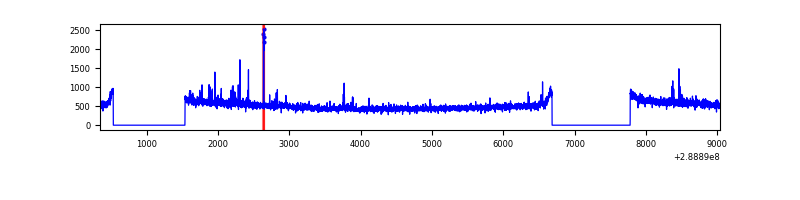 |
| C | 8690 | 6590 | 0 | 0 | 0.00% | 0.00% | 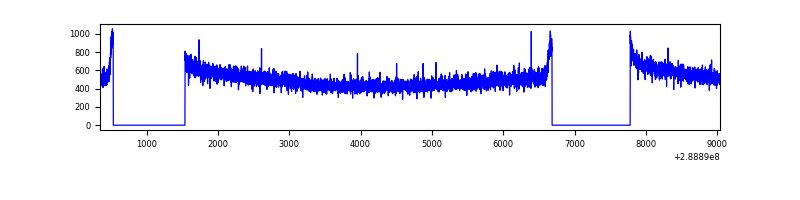 |
| D | 8690 | 6590 | 126 | 126 | 1.45% | 1.91% | 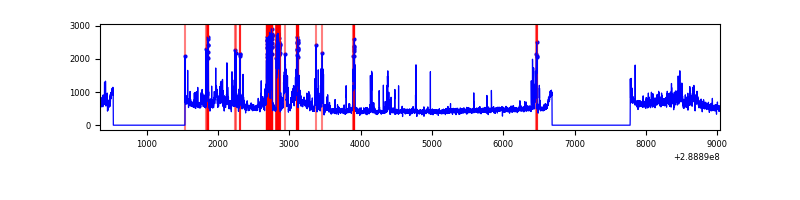 |
Top three noisy pixels from each quadrant. If the there are fewer than three noisy pixels in the level2.evt file, extra rows are filled as -1
| Pixel properties | Quadrant properties | ||||||
|---|---|---|---|---|---|---|---|
| Quadrant | DetID | PixID | Counts | Sigma | Mean | Median | Sigma |
| A | 0 | 13 | 105656 | 609.43 | 843 | 825 | 172.0 |
| A | 4 | 2 | 97726 | 563.32 | 843 | 825 | 172.0 |
| A | 15 | 174 | 43124 | 245.9 | 843 | 825 | 172.0 |
| B | 10 | 245 | 48214 | 291.21 | 849 | 826 | 162.7 |
| B | 7 | 220 | 40824 | 245.8 | 849 | 826 | 162.7 |
| B | 12 | 111 | 19097 | 112.28 | 849 | 826 | 162.7 |
| C | 14 | 238 | 125380 | 644.19 | 823 | 830 | 193.3 |
| C | 3 | 233 | 13958 | 67.9 | 823 | 830 | 193.3 |
| C | 13 | 61 | 5700 | 25.19 | 823 | 830 | 193.3 |
| D | 7 | 238 | 645359 | 3178.14 | 828 | 804 | 202.8 |
| D | 7 | 38 | 204818 | 1005.94 | 828 | 804 | 202.8 |
| D | 13 | 168 | 120556 | 590.47 | 828 | 804 | 202.8 |
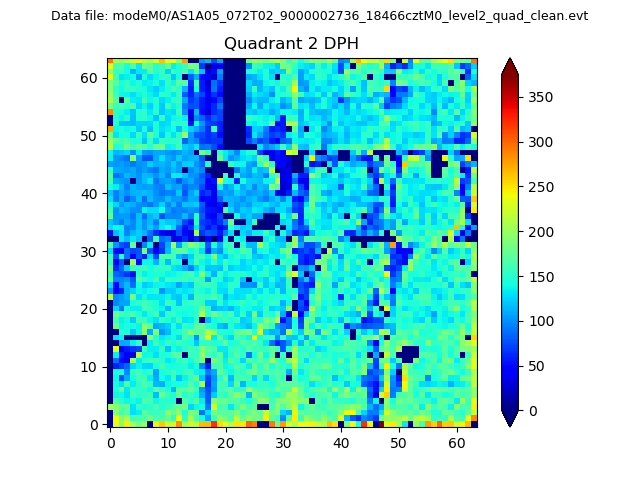
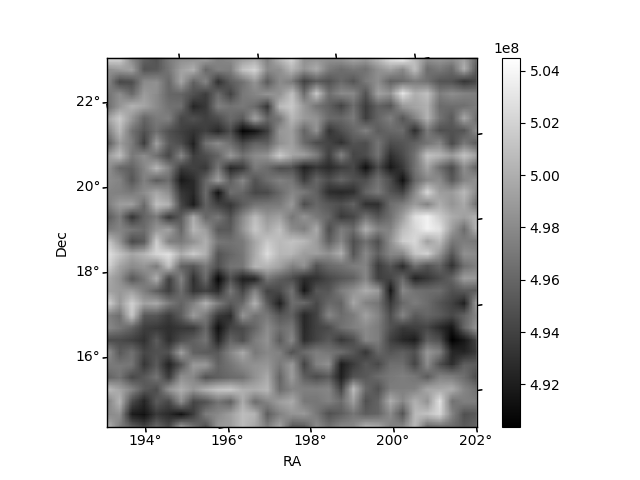
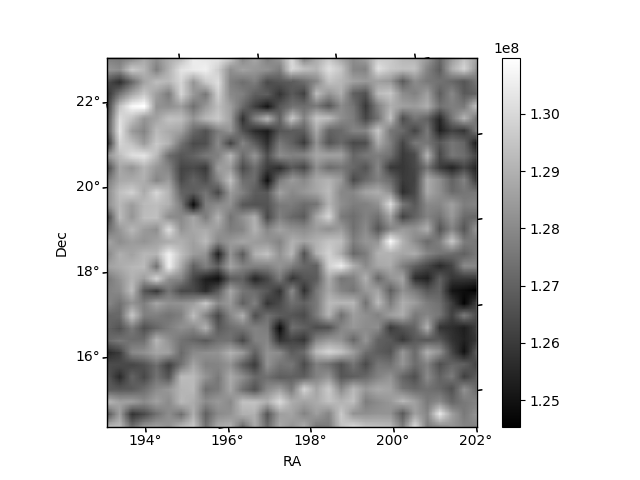
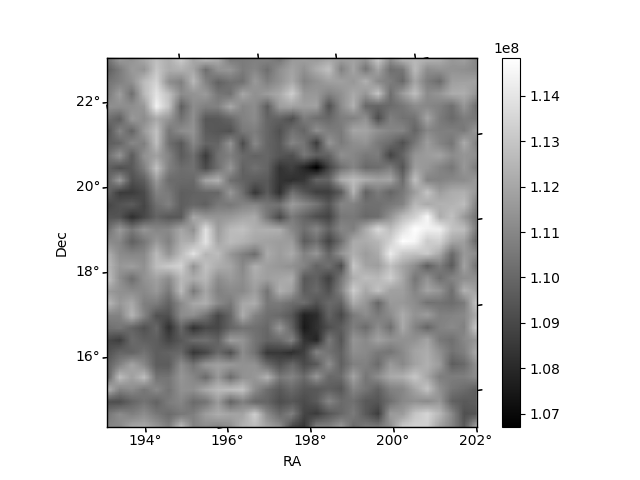
Histogram calculated using DETX and DETY for each event in the final _common_clean file
| Quadrant A | 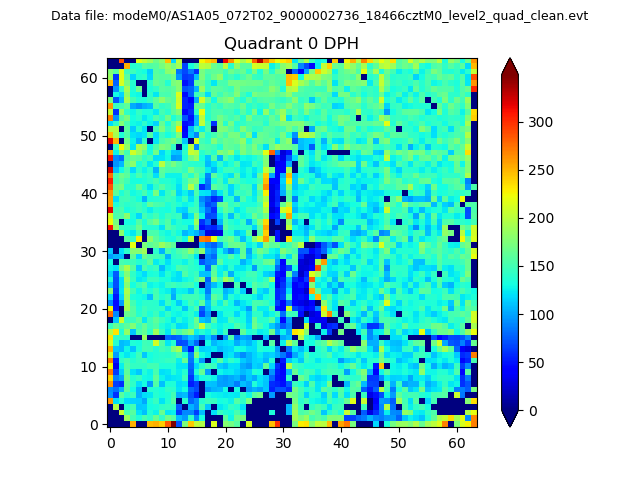 |
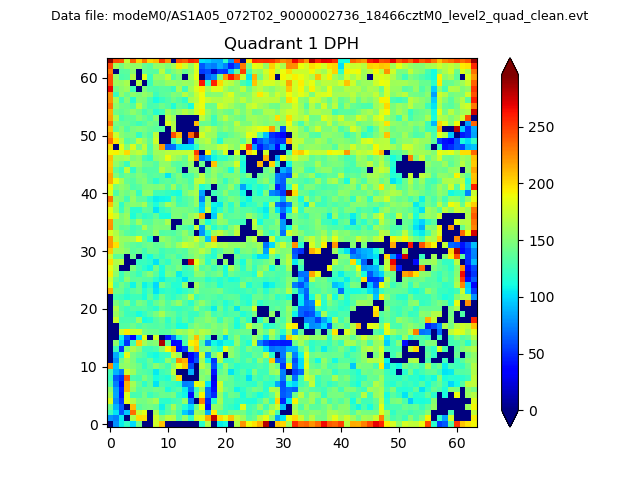 |
Quadrant B |
|---|---|---|---|
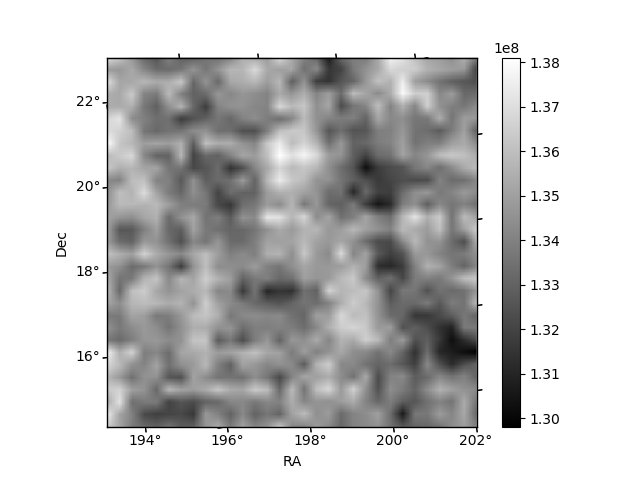
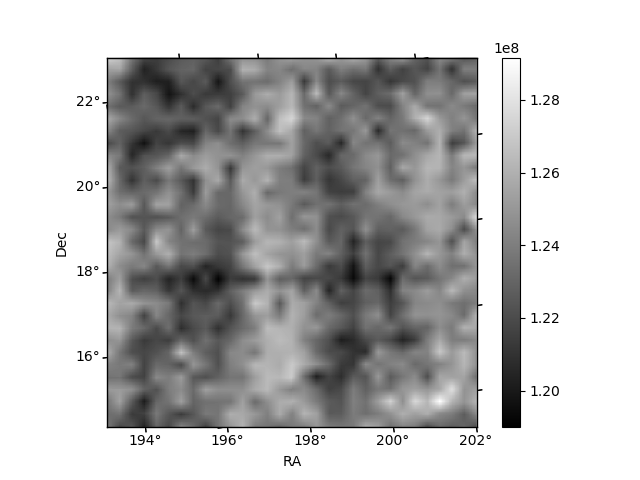
| Quadrant D | 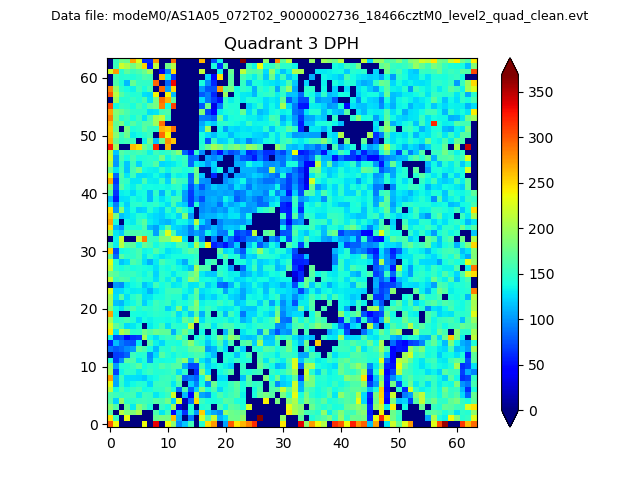 |
 |
Quadrant C |
| Plot type | Count rate plots | Images |
|---|---|---|
| Comparison with Poisson distribution Blue bars denote a histogram of data divided into 1 sec bins. Red curve is a Poisson curve with rate = median count rate of data. |
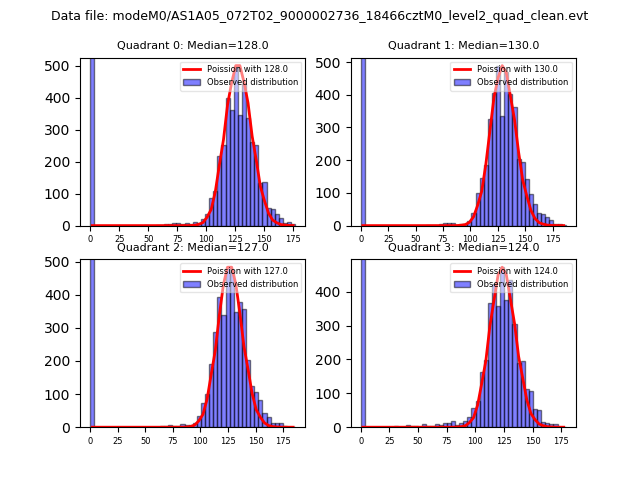 |
 |
| Quadrant-wise count rates Data is divided into 100 sec bins |
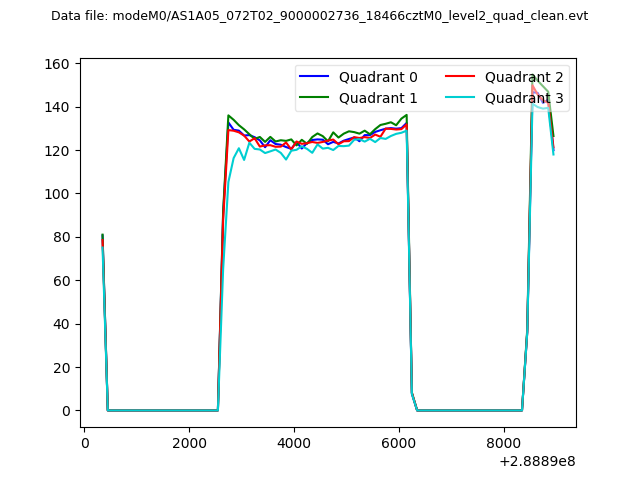 |
|
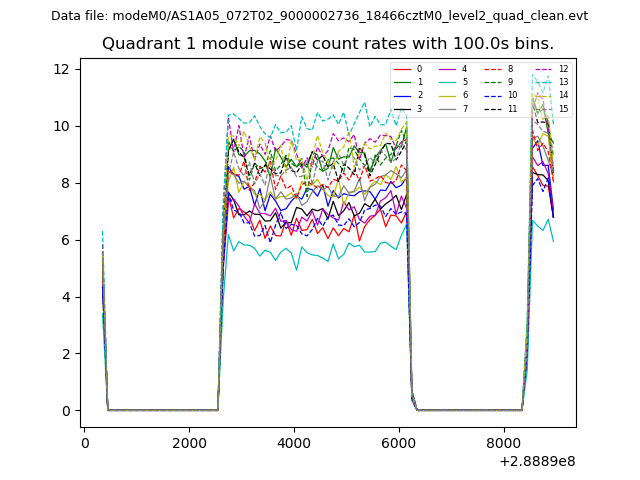
| Module-wise count rates for Quadrant A Data is divided into 100 sec bins |
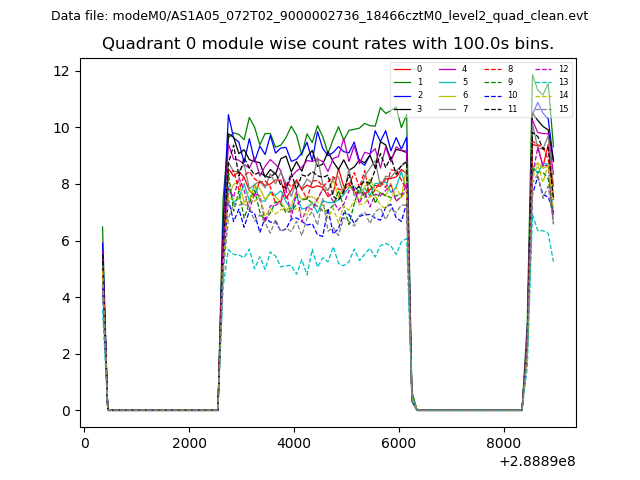 |
 |
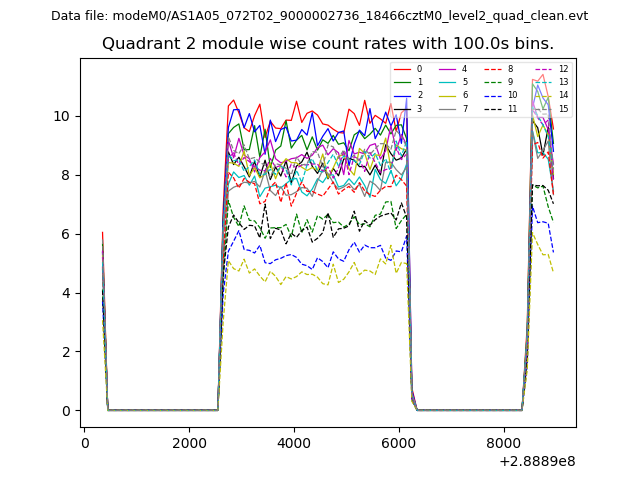
| Module-wise count rates for Quadrant B Data is divided into 100 sec bins |
 |
 |
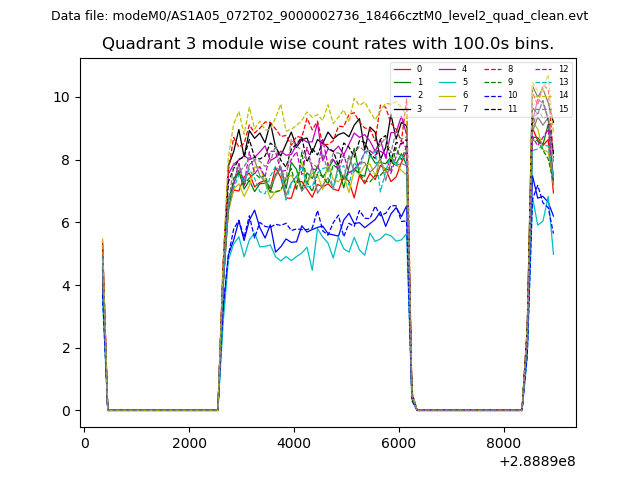
| Module-wise count rates for Quadrant C Data is divided into 100 sec bins |
 |
 |
| Module-wise count rates for Quadrant D Data is divided into 100 sec bins |
 |
 |
| Parameter | Plot |
|---|---|
| CZT HV Monitor | 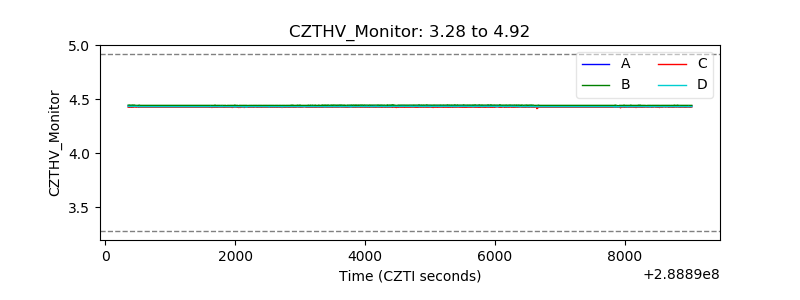 |
| D_VDD | 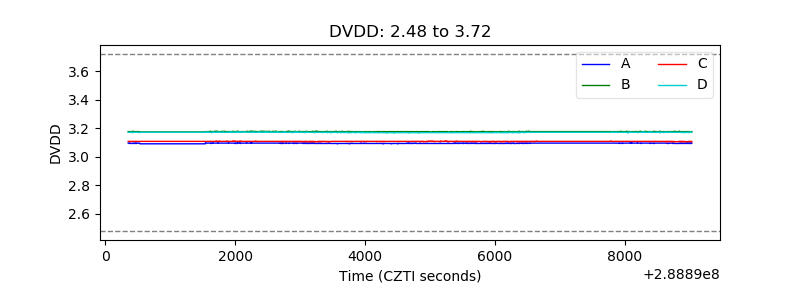 |
| Temperature 1 | 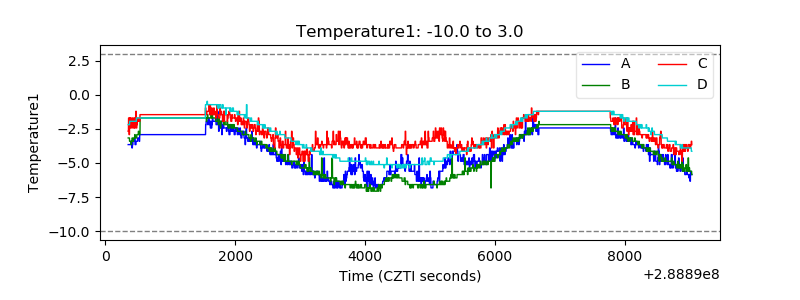 |
| Veto HV Monitor | 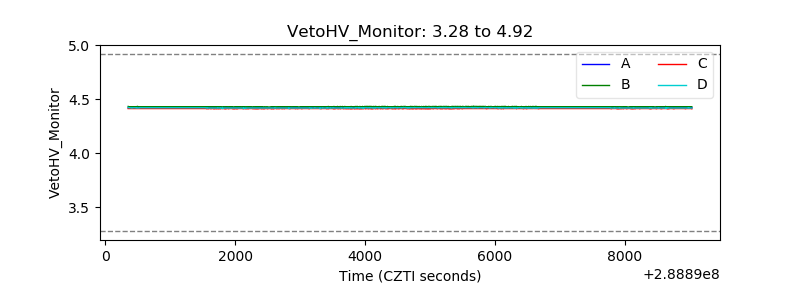 |
| Veto LLD | 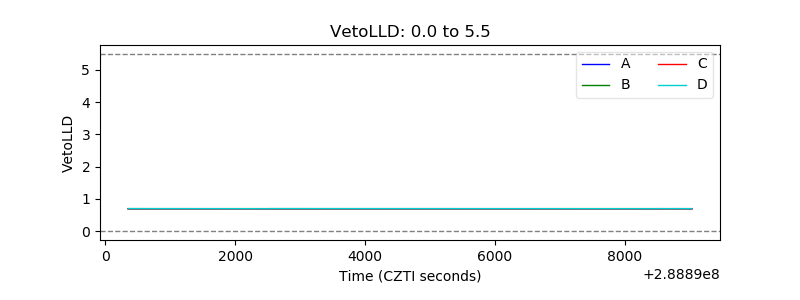 |
| Alpha Counter | 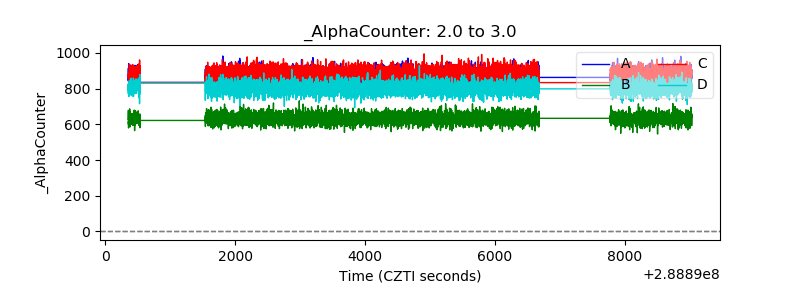 |
| _CPM_Rate | 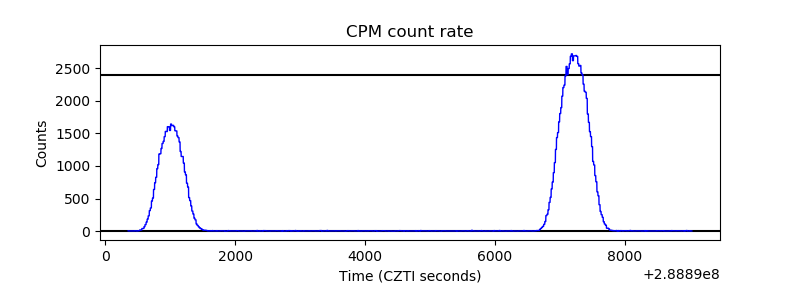 |
| CZT Counter | 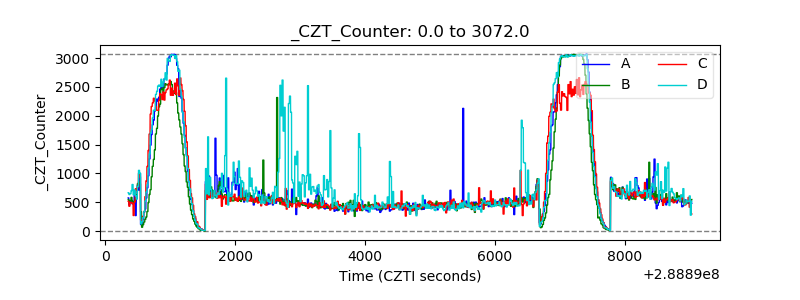 |
| +2.5 Volts monitor |  |
| +5 Volts monitor |  |
| _ROLL_ROT | 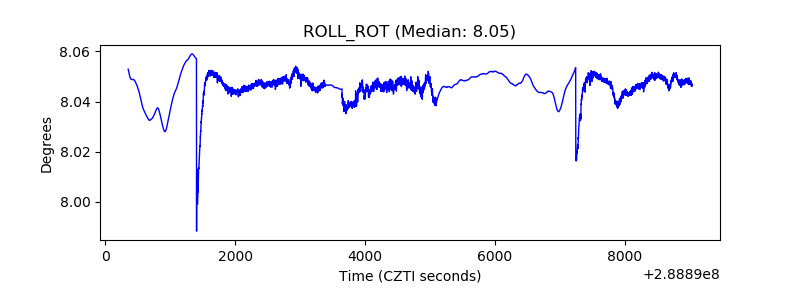 |
| _Roll_DEC | 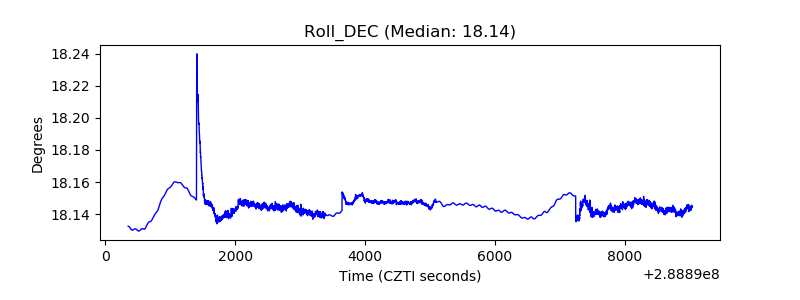 |
| _Roll_RA | 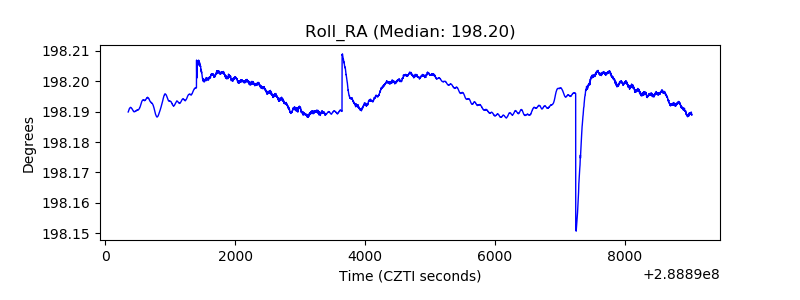 |
| Veto Counter | 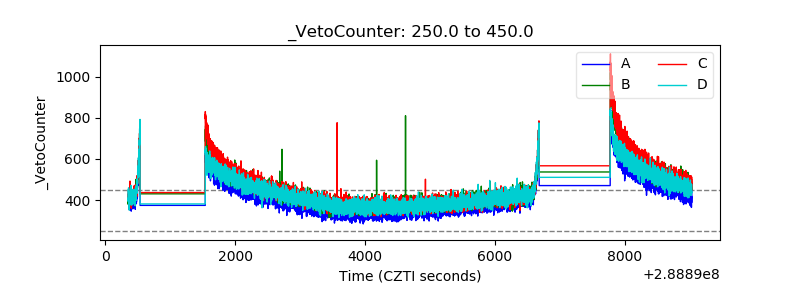 |