| Param | Original file | Final file |
|---|---|---|
| Filename | modeM0/AS1A05_072T02_9000002736_18467cztM0_level2.evt | modeM0/AS1A05_072T02_9000002736_18467cztM0_level2_quad_clean.evt |
| Size (bytes) | 528,474,240 | 98,812,800 |
| Size | 504.0 MB | 94.2 MB |
| Events in quadrant A | 3,886,597 | 629,682 |
| Events in quadrant B | 3,607,276 | 655,154 |
| Events in quadrant C | 3,545,953 | 634,759 |
| Events in quadrant D | 4,501,534 | 596,843 |
| Mode M0 | |||
|---|---|---|---|
| Quadrant | BADHDUFLAG | Total packets | Discarded packets |
| A | 0 | 15999 | 2 |
| B | 0 | 15165 | 2 |
| C | 0 | 14960 | 2 |
| D | 0 | 17993 | 2 |
| Mode M9 | |||
|---|---|---|---|
| Quadrant | BADHDUFLAG | Total packets | Discarded packets |
| A | 0 | 23 | 0 |
| B | 0 | 23 | 0 |
| C | 0 | 23 | 0 |
| D | 0 | 23 | 0 |
| Mode SS | |||
|---|---|---|---|
| Quadrant | BADHDUFLAG | Total packets | Discarded packets |
| A | 0 | 142 | 0 |
| B | 0 | 142 | 0 |
| C | 0 | 142 | 0 |
| D | 0 | 142 | 0 |
| Quadrant | Total seconds | Saturated seconds | Saturation percentage |
|---|---|---|---|
| A | 6826 | 121 | 1.772634% |
| B | 6826 | 78 | 1.142690% |
| C | 6826 | 121 | 1.772634% |
| D | 6826 | 346 | 5.068854% |
Noise dominated data is calculated using 1-second bins in cleaned event files. If a bin has >2000 counts, and if more than 50% of those come from <1% of pixels, then it is considered to be noise-dominated and hence unusable.
| Quadrant | # 1 sec bins | Bins with >0 counts | Bins with >2000 counts | High rate bins dominated by noise | Noise dominated (total time) | Noise dominated (detector-on time) | Marked lightcurve |
|---|---|---|---|---|---|---|---|
| A | 9171 | 6826 | 52 | 52 | 0.57% | 0.76% | 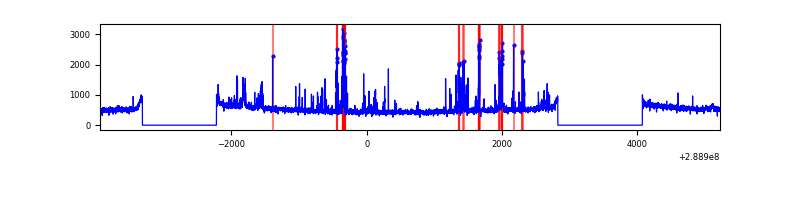 |
| B | 9171 | 6826 | 0 | 0 | 0.00% | 0.00% | 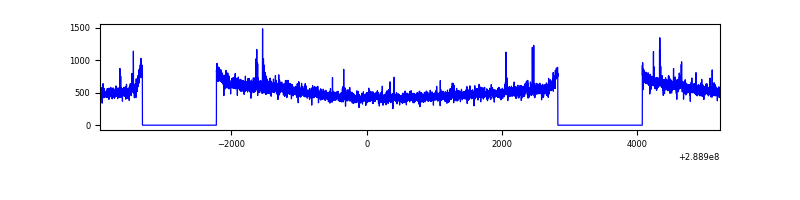 |
| C | 9171 | 6826 | 0 | 0 | 0.00% | 0.00% | 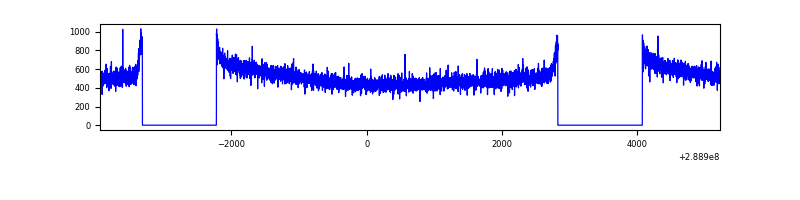 |
| D | 9171 | 6826 | 291 | 291 | 3.17% | 4.26% | 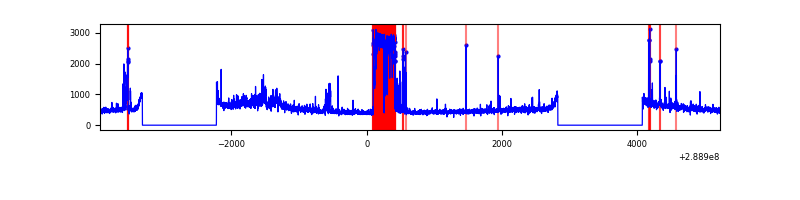 |
Top three noisy pixels from each quadrant. If the there are fewer than three noisy pixels in the level2.evt file, extra rows are filled as -1
| Pixel properties | Quadrant properties | ||||||
|---|---|---|---|---|---|---|---|
| Quadrant | DetID | PixID | Counts | Sigma | Mean | Median | Sigma |
| A | 0 | 13 | 356788 | 1978.95 | 892 | 875 | 179.8 |
| A | 15 | 174 | 43096 | 234.76 | 892 | 875 | 179.8 |
| A | 14 | 238 | 33272 | 180.13 | 892 | 875 | 179.8 |
| B | 10 | 245 | 45253 | 260.61 | 899 | 879 | 170.3 |
| B | 12 | 111 | 20001 | 112.3 | 899 | 879 | 170.3 |
| B | 11 | 111 | 17336 | 96.65 | 899 | 879 | 170.3 |
| C | 14 | 238 | 133959 | 656.94 | 871 | 879 | 202.6 |
| C | 3 | 233 | 11319 | 51.54 | 871 | 879 | 202.6 |
| C | 13 | 61 | 6054 | 25.55 | 871 | 879 | 202.6 |
| D | 7 | 238 | 871140 | 4135.8 | 865 | 843 | 210.4 |
| D | 7 | 38 | 173273 | 819.42 | 865 | 843 | 210.4 |
| D | 1 | 52 | 50552 | 236.23 | 865 | 843 | 210.4 |
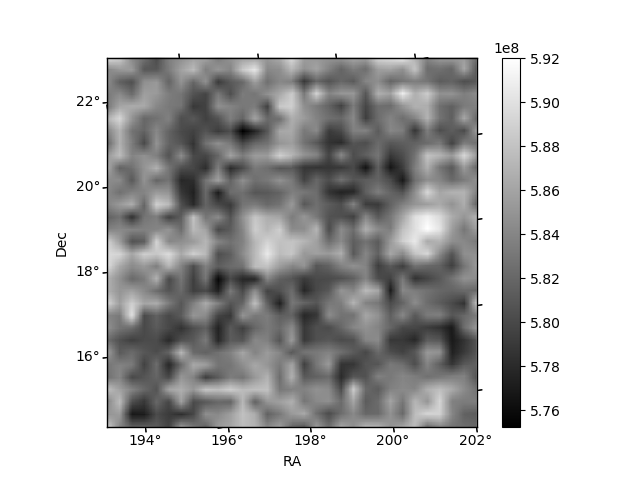
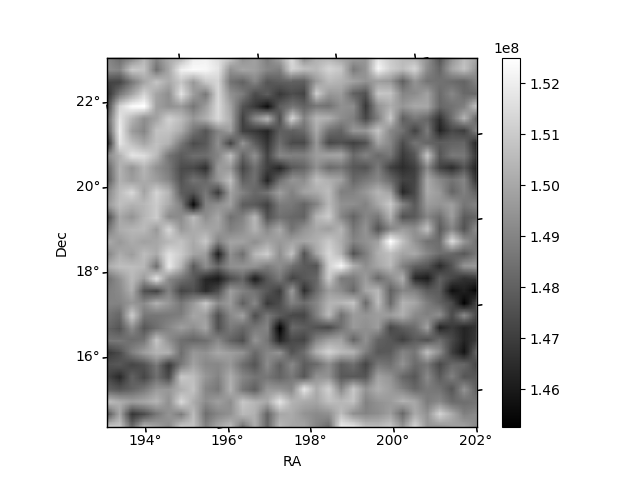
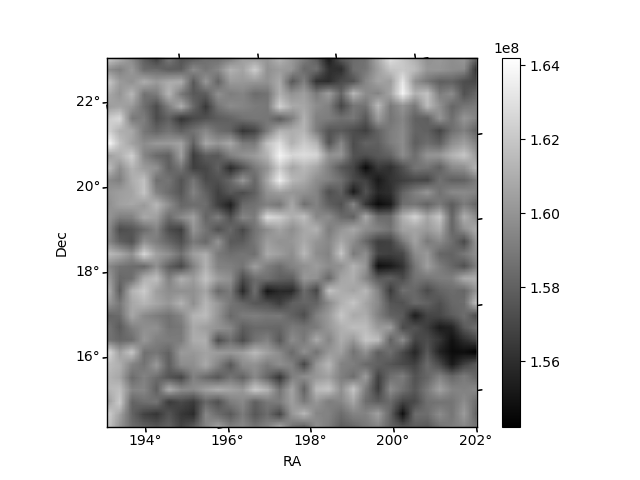
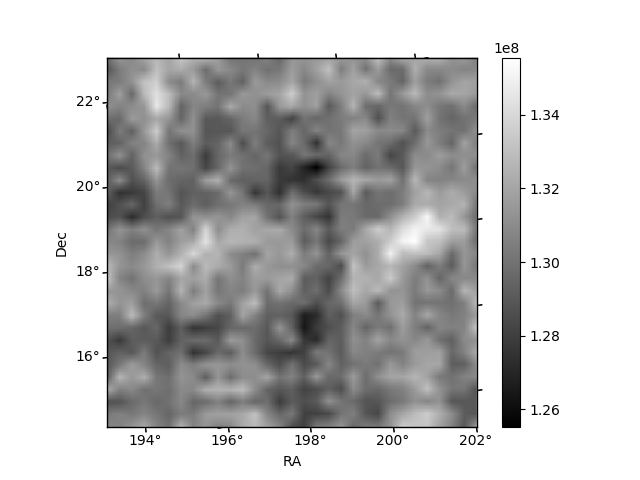
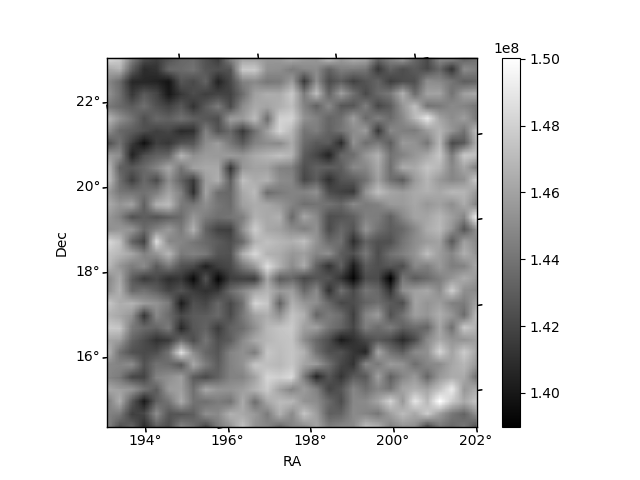
Histogram calculated using DETX and DETY for each event in the final _common_clean file
| Quadrant A | 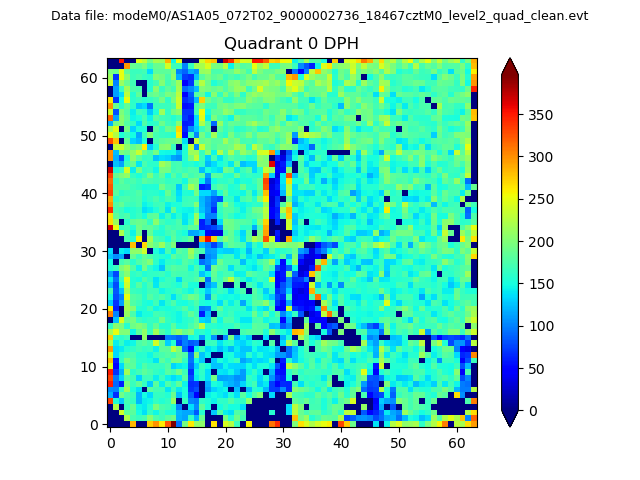 |
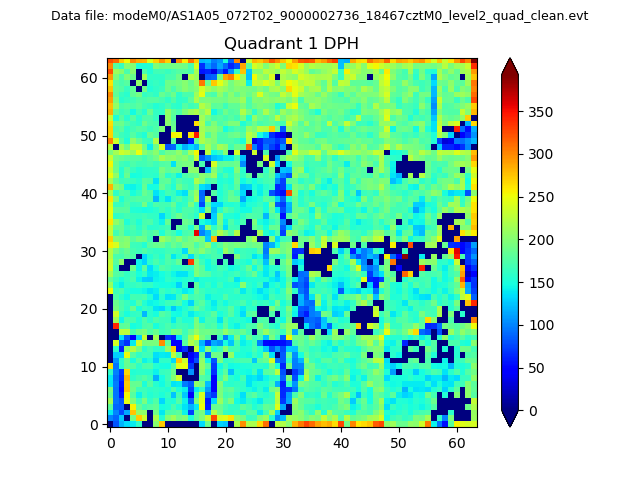 |
Quadrant B |
|---|---|---|---|
| Quadrant D | 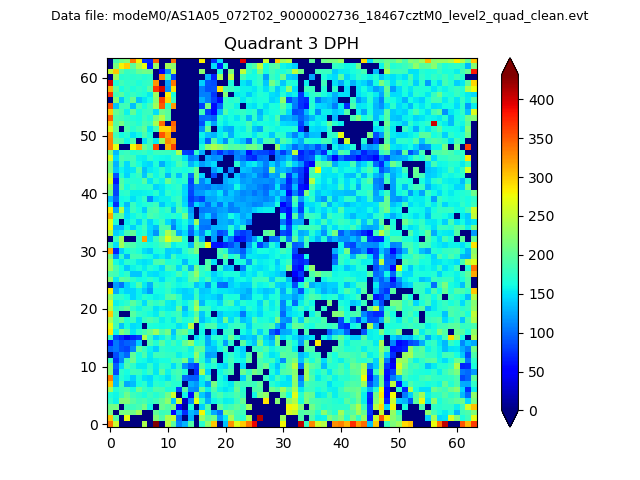 |
 |
Quadrant C |
| Plot type | Count rate plots | Images |
|---|---|---|
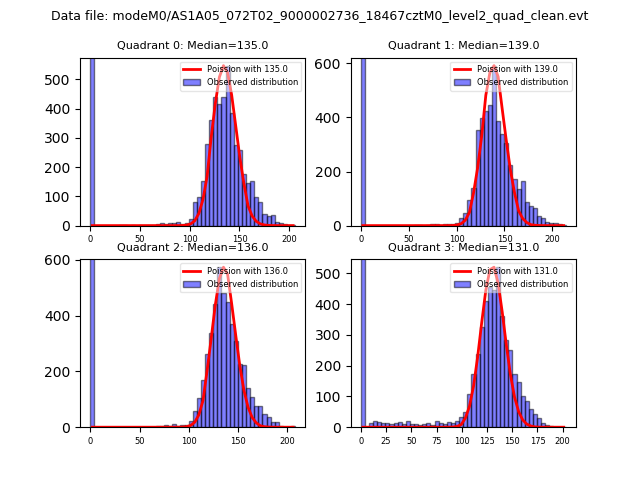
| Comparison with Poisson distribution Blue bars denote a histogram of data divided into 1 sec bins. Red curve is a Poisson curve with rate = median count rate of data. |
 |
 |
| Quadrant-wise count rates Data is divided into 100 sec bins |
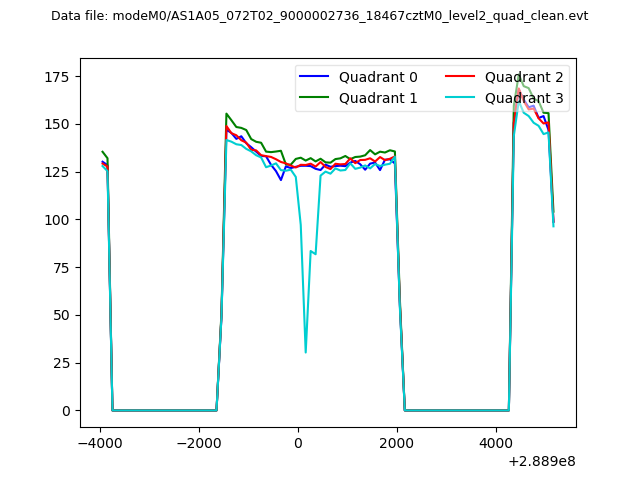 |
|
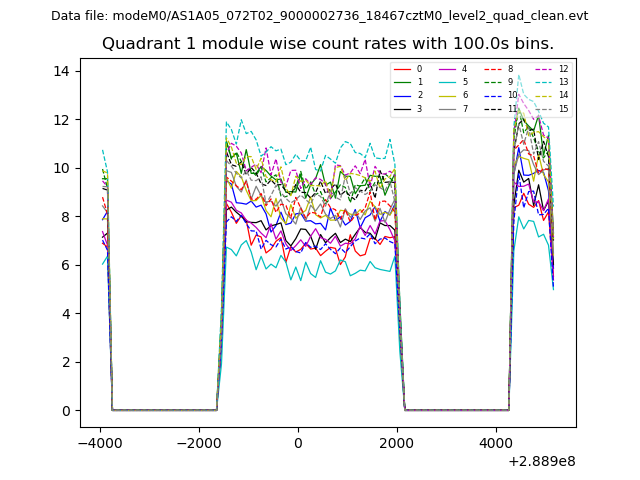
| Module-wise count rates for Quadrant A Data is divided into 100 sec bins |
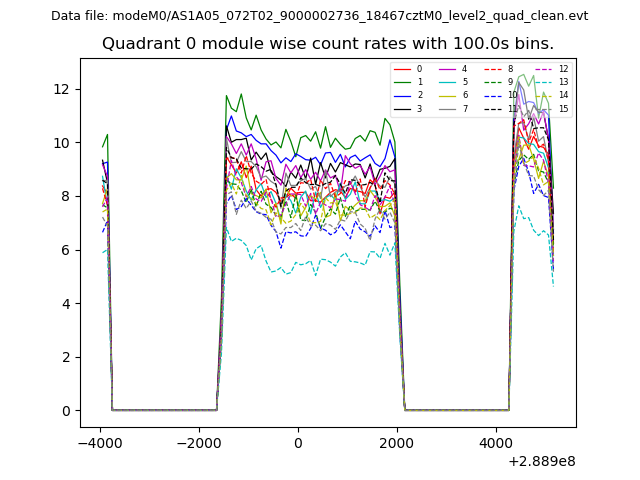 |
 |
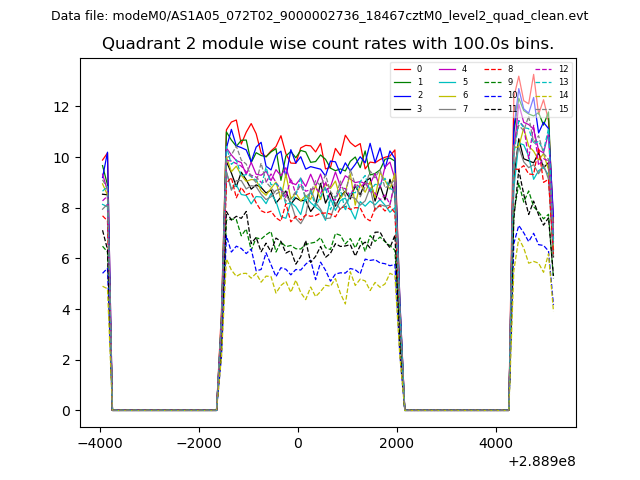
| Module-wise count rates for Quadrant B Data is divided into 100 sec bins |
 |
 |
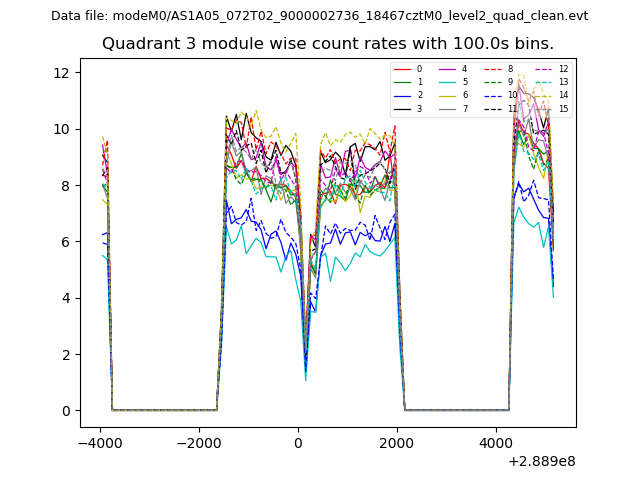
| Module-wise count rates for Quadrant C Data is divided into 100 sec bins |
 |
 |
| Module-wise count rates for Quadrant D Data is divided into 100 sec bins |
 |
 |
| Parameter | Plot |
|---|---|
| CZT HV Monitor | 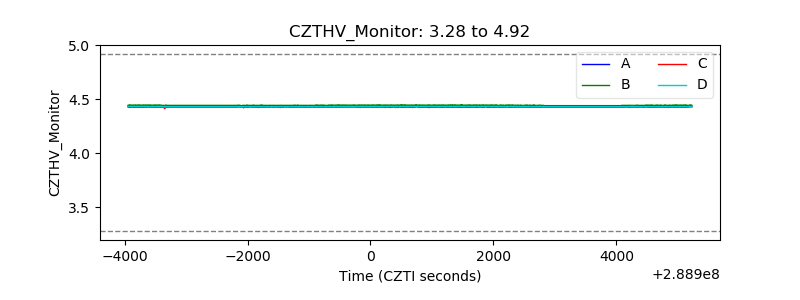 |
| D_VDD | 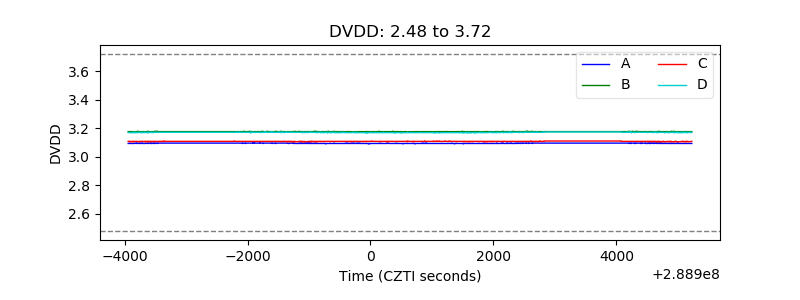 |
| Temperature 1 | 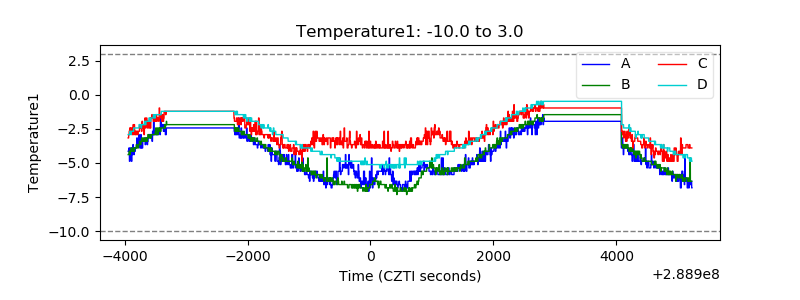 |
| Veto HV Monitor | 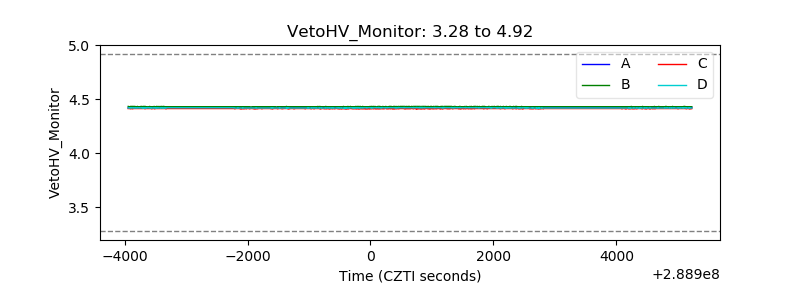 |
| Veto LLD | 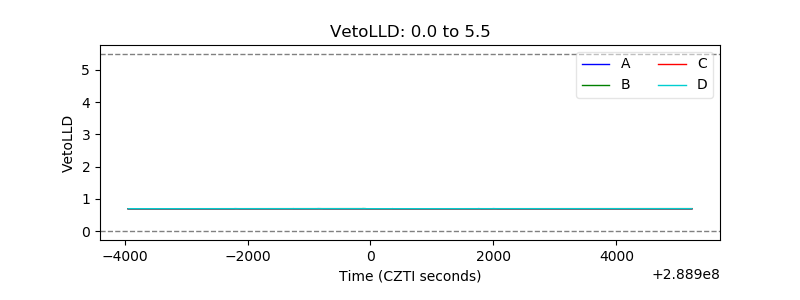 |
| Alpha Counter | 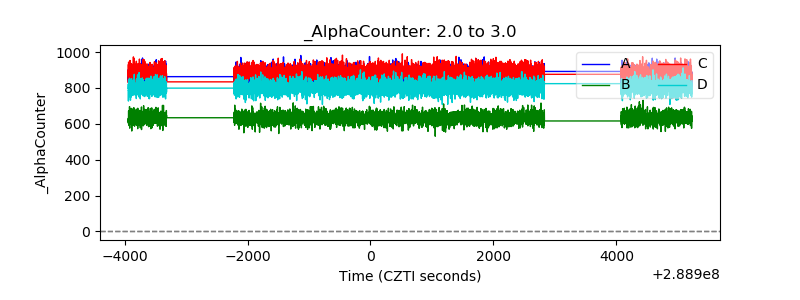 |
| _CPM_Rate | 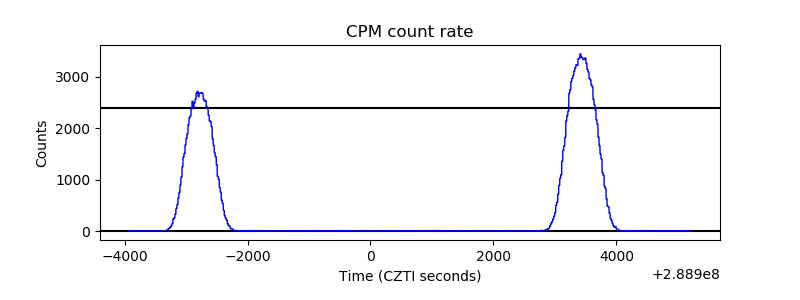 |
| CZT Counter |  |
| +2.5 Volts monitor | 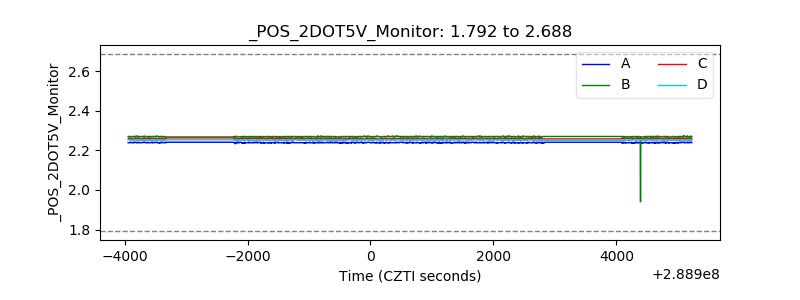 |
| +5 Volts monitor |  |
| _ROLL_ROT | 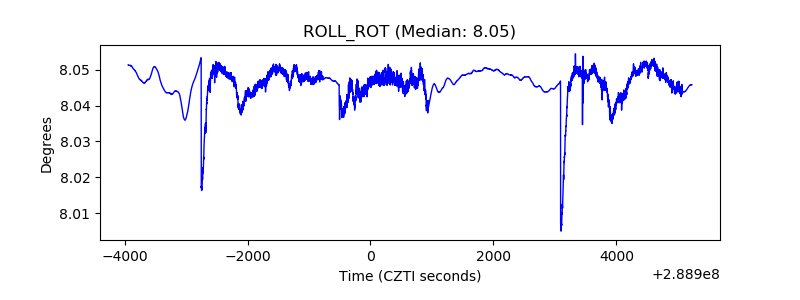 |
| _Roll_DEC | 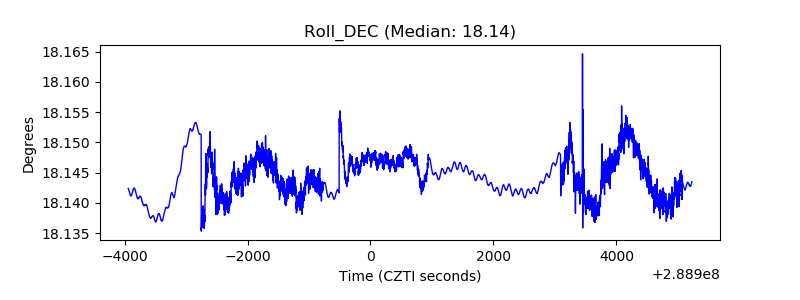 |
| _Roll_RA | 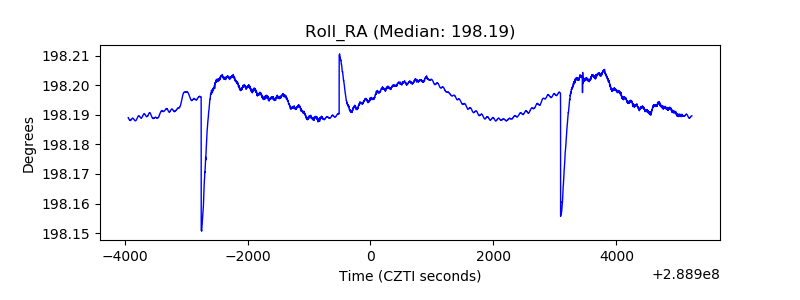 |
| Veto Counter |  |